Vol. 2, No. 2, pp. 99-112, April (2019)
OSA: Orientation Search Algorithm
Mohammad Dehghani
1,†, Zeinab Montazeri
2, Om Parkash Malik
3, Ali Ehsanifar
4, and Ali Dehghani
51, 2
Department of Electrical and Electronics Engineering, Shiraz University of Technology, Shiraz, Iran 3 Department of Electrical Engineering, University of Calgary, Calgary Alberta Canada
4 Department of Electrical and Electronics Engineering, Shiraz University, Shiraz, Iran 5
Department of Civil Engineering Islamic Azad Universities of Estahban, Estahban, Iran.
Random based inventive algorithms are being widely used for optimization. An important category of these algorithms comes from the idea of physical processes or the behavior of beings. A new method for achieving quasi-optimal solutions related to optimization problems in various sciences is proposed in this paper. The proposed algorithm for optimizing the orientation game is a series of optimization algorithms that are formed with the idea of an old game and the search operators are an arrangement of players. These players are displaced in a certain space, under the influence of the referee's orders. The best position would be achieved by following the game laws. In this paper, the real version of the algorithm is presented. The optimization results of a set of standard functions confirm the optimal efficiency of the proposed method, as well as the superiority of the proposed method over the other well-known metaheuristic algorithms.
Article Info
Keywords:
Heuristic algorithms, Optimization, Orientation, Orientation game ,Orientation search algorithm. Article History:
Received 2018-08-07 Accepted 2018-12-16
I.I
NTRODUCTIONWith increasing desire and importance of speeding up the response, nowadays, classical approaches are not responsive for solving many problems, and, more often, random search algorithms are used instead of the full search of the problem space. In this regard, the use of heuristic search algorithms (intuitive or inventive) has grown significantly in recent years [1-7]. Innovative algorithms have demonstrated their high capability in many fields of science, data mining [8], physical chemistry [9], electronics [10, 11] and other related fields.
Finding a mathematical model is an extremely difficult and may be even an impossible process in searching processes for the innovative methods [8].
In the demographic methods, interactions and information exchange between members are done in a variety of ways. These algorithms include; Genetic algorithm (GA) inspired by heredity and evolution [1], Simulated Annealing (SA)
inspired by thermodynamic observations [2] Artificial Immune System (AIS) algorithm inspired by simulating the human defense system [3], Ant Colony Optimization (ACO) algorithm by simulating the behavior of ants searching for food [4], Particle Swarm Optimization (PSO) by imitation of the social behavior of birds [5] , Spring Search Algorithm (SSA) by simulating body and spring system [6,7]; among others.
In this paper, a new approach based on an old game titled orientation Game for designing optimization algorithms is investigated. In the proposed algorithm, the rules governing the game and the influence of the players in the game from each other and the referee has been used to design an optimizer called the Orientation Search Algorithm (OSA).
A brief explanation of the optimization methods is provided in Section II. The game of orientation is introduced in Section III. The general outline of the OSA algorithm is given in Section IV with further description provided in section V. Results of some studies are given in Section VI and, finally, the summing up and conclusions are given in Section VII.
†Corresponding Author: [email protected] Tel: +989170510608,
Department of Electrical and Electronics Engineering ,shiraz university of technology
A Brief Introduction of Intelligent Algorithm
An intelligent algorithm is a way to find the right answer for an optimization problem, which the problem is solved as soon as possible with the least information about its details [12]. In ancient Greece, the word "innovative" means "knowing", "discovering", "finding" or "guiding a research" [13- 15]. In a more complete definition, the innovative method is a strategy that ignores some portion of the information in order to get the decision quickly, with the maximum savings in time and with the utmost care, over complex methods [16]. Biological processes or theories of physics usually inspire innovative algorithms. In the last decade, countless of these algorithms have been presented. The most popular of these methods are genetic algorithm [1], metal fusion simulation [2], Harmony Search (HS) [17], synthetic immune system [3], ant colony optimization [4], particle swarm optimization [5], Bacteria search algorithm [18], and others. The genetic algorithm is derived from the Genetic Law and Reincarnation is based on the evolution of
Darwin's theory [1]. The simulation of metals fusion is based
on the process of cooling metals during the metalworking [2]. Harmonic Search is an algorithm which has been created by imitating the melody recovery process when music is
composed by the composer [17]. An artificial immune system
is inspired by the behavior of the biological system of the human body [3]. An ACO algorithm simulates the behavior of ants when they are searching for food [4]. The PSO algorithm is derived from the social behavior of the bird group during migration [5], and the bacterial search algorithm is inspired by the behavior of the Annealing bacterial social nutrition [18].
All of the above-mentioned algorithms use a statistical property and random phenomena in their performance structure as they are in nature. In some other algorithms like Central Force optimization (CFO) algorithms, which are metaphors of the global law of gravity, these random phenomena are not used, and algorithms of this kind have Deterministic properties [14, 19].
Population-based methods are inspired by social interactions among the members of a community. For example, the PSO algorithm has simulated the collaboration within the birds group community. In this approach, each particle tries to move with the help of its past experiences and the guidance of its closest neighboring particles to the best position in the search space [20]. Heuristic search algorithms are algorithms that are inspired by physical, biological, and nature processes, and most of them act in a population-based manner.
Innovative search approaches act randomly unlike classical methods, and they perform space search in parallel. Another difference is the lack of use of the space gradient information. These types of methods only use the fitness function for searching, but because of having intelligence from Swarm
intelligence type, they are able to determine the answer. Swarm intelligence appears in cases where a population of non-expert agents exist. Each of these agents, under certain conditions, exhibits simple behavior and interacts locally on each other. Local interactions of members cause unexpected global effects outcomes and, ultimately, the entire set can discover a solution to a problem without having a central controller. The members' behavior leads to the organization of the system from within by creating features such as positive feedback, negative feedback, balance between exploration and exploitation, and multiple interactions, which called Self-organization [21, 22].
Although many innovative algorithms have been introduced, improved and applied by researchers in many different fields of science, there is still no algorithm that provides convincing response to optimize all the problems in engineering and other branches of science. This paper is an attempt on an innovative new algorithm to help overcome the problems of previous methods.
II.
O
RIENTATION GAMEOrientation game is an old game. The overall goals of this game are to cultivate the spirit of honesty and truthfulness, compliance training and improving actions and reactions. The game's description is as follows: The referee places the players in a scattered position in the schoolyard or playground so that he could have enough visibility to all of them. Then he describes the rules and regulations of the game, which is a kind of a group running, and wants from each of them to set aside whenever they could not pass one of the game phases. Now the referee makes the players realize that they only walk along the hand's hint while the referee moves around in front of them.
Players must pay attention that the direction of the hand's hint is the criterion and they should not be fooled by the movement of the referee to make mistakes and be fired. The game continues until, with the elimination of the players, the final player of the game can be restarted. Therefore, in this game, players move according to the direction of the referee's hand.
III.
ORIENTATIONS
EARCHA
LGORITHM(OSA)
In this paper, optimization is performed in a discrete-time artificial system by means of the rules ruling the game. The system environment is the same as the definition of the problem. The players of the game can be used as a means of exchanging information. The designed optimizer can be utilized to solve any optimization problem, with each problem solution defined as a position in space.
positioning for members, regulation of rules, and setting parameters, and 2. Time passage until stop time.
A. Formation of the system, rules and parameters setting
In the first step, the system space is determined. The environment consists of a multidimensional coordinate system in the context of the problem definition. Each point in space is a possible solution to the problem. The search operators are a set of players that are participating in the game. In fact, each player is connected to all other players; the player's position on the playing field is a point in space, which is a response of the problem.
After the formation of the system, the governing rules are identified. It is assumed that players are affected by each other.
Now imagine the system as a set of ‘m’ players. Each player's position is a point of space, which is the answer to the problem. In Equ. (1), the position ‘d’ of player ‘i’ is
shown as .
(1)
= ( , … , , … , )
At start, the initial position of the players in this game is created randomly on the playing field (problem definition space). These players proceed according to the governing rules of the game in the direction specified by the referee.
In this algorithm, the location of the best player is shown as the referee. This position is defined in Equ. (2).
(2)
=
: min! "#
: max! "#
In the above relation, ", is the value of the objective function of player ‘j’ and N is the number of players.
As noted in Section 3, in the orientation game, each player pays attention to the referee's hand. The referee's hand direction is not necessarily the same as the referee's direction of motion. However, players must only consider the referee's hand. This direction is simulated in the form of Equs. (3)-(4):
(3)
& = 0.8 + 0.2 ,
(4)
-= −. / (. / ( − & 1− & 1 ),), .2 < &
Where, & is the Equivalence probability of the referee's
hand direction and move direction, and - , is the
direction created by the referee for member i in dimension d. In Equ. (4), the referee's hand direction is appointed for each player, but the player may not move in this direction. The new location of each player will be updated according to
Equs. (5)-(6).
(5)
= 0.2 (1 − ,)
(6)
= + 2 - 5 , 2 >
78+ 2 ( 5 − 78), .
B. Time passage and parameters updates
At the beginning of the system formation, each player is placed randomly at one point of the game space, which is the answer of the problem. At every moment of time, the position of the players is evaluated and then the changes in the location of each player is obtained after calculating relations (1) to (6) and at the next time, the player is placed in that position. The stop condition can be determined after a specified period. Various steps of the optimization algorithm for the orientation game are as follows.
1. Determining the system environment and initializing. 2. The initial positioning of the players.
3. Evaluation of the players.
4. Determination of the direction by the referee for each player
5- Updating the referee's position 6. Updating the player status.
7- Repeat steps 3 to 6 until the stop condition is met. 8- The end
IV.
C
HARACTERISTICS OF THE PROPOSED ALGORITHMIn the proposed algorithm, it is tried to create an optimization method using governing rules of the game. In this algorithm, a set of players are randomly searching the space. The direction, which is created for the players by the referee, is used as a means of exchanging information. Each player acquires an approximate understanding of its surroundings with the influence of its own position and other players. The algorithm must be directed in such a way that the player's position could be improved over time.
Developing the algorithm's discovery power is an approach among the suggested solutions for algorithm improvement. There are two issues in optimization: Exploration and Exploitation. In the Exploration discussion, each optimization algorithm should have fine enough capability to search in the problem space, and not to be restricted to some areas. In terms of Exploitation, the ability of the algorithm to discover the optimal areas is discussed. In demographic algorithms, at the early stages of the algorithm's implementation, there is a need for a thorough search of space. Moreover, the algorithm should emphasize the much better search of the space in the initial repetitions. However, over time, the discovering ability of the algorithm becomes more evident, and the algorithm should be able to locate using population data at the optimal points [14, 25].
error coefficients. For this purpose, P and error are controlled by equations (3) and (5), respectively. Players in accordance with the P and the error coefficients, follow the referee in each iteration of the algorithm. In the early iterations of the algorithm, the problem still needs to be searched, but with the advance of time, the population has comes up with better results. Therefore, the values of P and error coefficients are controlled as time variables. In this way, at the start time, good values for P and error are selected, and over time, the amount of P is increased and the error value is decreased until at the end they have reached their maximum and minimum values. This topic makes it possible that, in the initial iterations, the search space is well explored so that the algorithm does not settle in the local optimal. Over time, the players have gathered around the better positions, and it is
necessary that the space be searched with smaller and more accurate steps. The impact on players from the referee increases over time. Therefore, it is expected that the players go to the more appropriate positions with the passage of time. One of the limitations and disadvantages of OSO is that these coefficients are only based on time.
V.
R
ESULTSIn this section, a comparison of OSA with several algorithms is brought. Performance of the proposed algorithm is evaluated using 23 standard test functions [26].
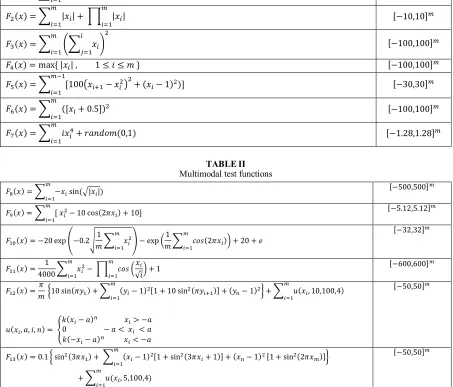
A. The utilized standard test functions
Table I-III show the standard test functions.
TABLEI Unimodal test functions
9−100,100:;
< ( ) = =; > ?
9−10,10:;
<>( ) = = | | + A | | ;
? ;
?
9−100,100:;
<B( ) = = C=
"? D
> ;
?
9−100,100:;
<E( ) = max F | | , 1 G G H
9−30,30:;
<J( ) = = 9100! K − >#>+ ( − 1)>) ;L
? :
9−100,100:;
<M( ) = = (9 + 0.5:)> ;
?
9−1.28,1.28:;
<O( ) = = E+ 2 (0,1)
;
?
TABLEII Multimodal test functions
9−500,500:;
<P( ) = = − sin (R| |) ;
?
9−5.12,5.12:;
<S( ) = = 9 >− 10 cos(2V ) + 10: ;
?
9−32,32:;
<W( ) = −20 exp Z−0.2[1= > ;
? \ − exp ]
1
=; .(2V )
? ^ + 20 +
9−600,600:;
< ( ) =4000 =1 ; >
? − A .
;
? ]√^ + 1
9−50,50:;
<>( ) =V b10 sin(V1 ) + = (1 − 1)>91 + 10 sin>(V1K): + (1 − 1)> ;
? c + = d( , 10,100,4)
;
?
d( , , , ) = ef( − ) > −0 − < < f(− − ) < −
9−50,50:;
<B( ) = 0.1 b sin>(3V ) + = ( − 1)>91 + sin>(3V + 1): + ( − 1)> ;
? 91 + sin
>(2V ;):c
+ = d( , 5,100,4);
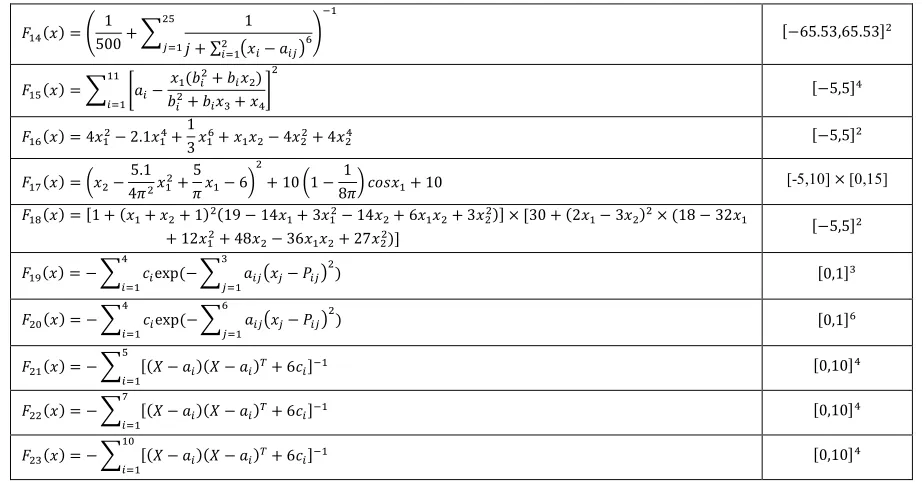
TABLEIII
Multimodal test functions with fixed dimension
9−65.53,65.53:>
<E( ) = g500 + =1 1
h + ∑ ! −>? "#M >J
"? j
L
9−5,5:E
<J( ) = = k − (
>+ >) >+
B+ El
>
?
9−5,5:>
<M( ) = 4 >− 2.1 E+13 M+ >− 4 >>+ 4 >E
[-5,10] m [0,15] <O( ) = ] >−4V5.1> >+
5 V − 6^
>
+ 10 ]1 −8V^ . + 101
9−5,5:>
<P( ) = 91 + ( + >+ 1)>(19 − 14 + 3 >− 14 >+ 6 >+ 3 >>): m 930 + (2 − 3 >)>m (18 − 32
+ 12 >+ 48
>− 36 >+ 27 >>):
90,1:B
<S( ) = − = exp (− = "! "− &"#> B
"? )
E
?
90,1:M
<>W( ) = − = exp (− = "! "− &"#> M
"? )
E
?
90,10:E
<> ( ) = − = 9( − )( − )p+ 6 :L J
?
90,10:E
<>>( ) = − = 9( − )( − )p+ 6 :L
O
?
90,10:E
<>B( ) = − = 9( − )( − )p+ 6 :L
W
?
B. Unimodal high-dimensional functions
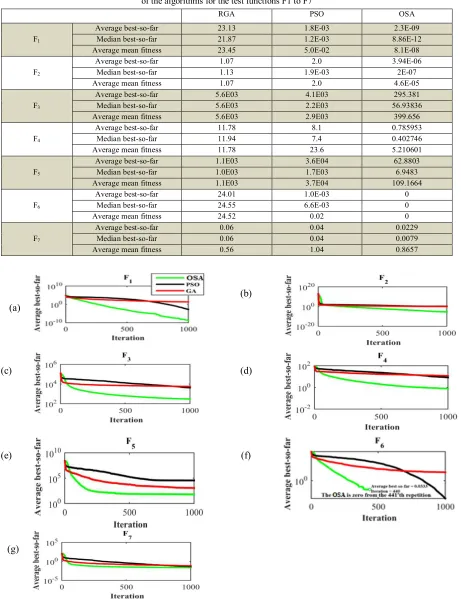
Functions F1 to F7 are the one state functions. The average of the achieved results in 20 times independent implementation of the algorithm is presented in Table IV. These results show that the OSA algorithm has a better performance than PSO and GA algorithms in all F1 to F7 test functions. In order to have a comparison of the search space in terms of the algorithm's repetition, the process of reaching the response for all of these test functions is presented in Fig.1.
C. Multimodal high-dimensional functions
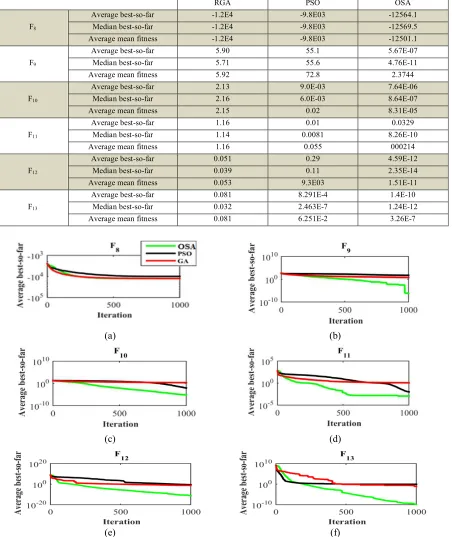
In multi-state functions, F8 to F13, the number of local responses increases exponentially with increasing the function dimensions. Therefore, achieving the minimum response in this kind of functions is hardly possible. In these type of functions, reaching the closest answer to the problem response reveals the high power of the algorithm in the passage of the wrong local responses. The results of the evaluation of functions F8 to F13 for 20 times implementation of the OSA, PSO and GA algorithms are shown in Table V. In all these functions, the OSA continues to provide better performance. Performance of the algorithms in achieving the answer is displayed in Fig. 2.
D. Multimodal low-dimensional functions
Functions F14 to F23 have a low number of dimensions and a low local response. The results of 20 times using of OSA, GA and PSO algorithms are presented in Table VI.
These results express the proper performance of the OSA algorithm over GA and PSO algorithms in these types of functions. The performance of these algorithms is shown in Fig. 3.
E. Comparing OSA with some other algorithms
In the previous section, OSA was compared with two well-known algorithms (RGA and PSO). In the current section, the performance of OSA is compared with some other algorithms: GSA [14], WCA [27], TLBO [28], SFL [29], GWO [30] and GOA [31]. The results of this comparison are shown in Table VIII.
The functions F1 to F7 are unimodal test problems, which
are used to assess the exploitation capability of the metaheuristic algorithms. As shown in Table VIII, OSA is very competitive as compared with the other algorithms. The obtained results demonstrate that OSA has better exploitation capability and it is able to determine the best optimal solution for functions F1 to F7 very efficiently.
Multimodal test functions have an ability to evaluate the exploration of an optimization algorithm. Tables IX and X depict the performance of above-mentioned algorithms on multimodal test functions (F8 − F13), and fixed-dimension
multimodal test functions (F14 − F23). From these tables, it
TABLEIV
A comparison between OSA, GA and PSO algorithms from the average of the achieved results in 20 times independent implementation of the algorithms for the test functions F1 to F7
OSA PSO
RGA
2.3E-09 1.8E-03
23.13 Average best-so-far
F1 Median best-so-far 21.87 1.2E-03 8.86E-12
8.1E-08 5.0E-02
23.45 Average mean fitness
3.94E-06 2.0
1.07 Average best-so-far
F2 Median best-so-far 1.13 1.9E-03 2E-07
4.6E-05 2.0
1.07 Average mean fitness
295.381 4.1E03
5.6E03 Average best-so-far
F3 Median best-so-far 5.6E03 2.2E03 56.93836
399.656 2.9E03
5.6E03 Average mean fitness
0.785953 8.1
11.78 Average best-so-far
F4 Median best-so-far 11.94 7.4 0.402746
5.210601 23.6
11.78 Average mean fitness
62.8803 3.6E04
1.1E03 Average best-so-far
F5 Median best-so-far 1.0E03 1.7E03 6.9483
109.1664 3.7E04
1.1E03 Average mean fitness
0 1.0E-03
24.01 Average best-so-far
F6 Median best-so-far 24.55 6.6E-03 0
0 0.02
24.52 Average mean fitness
0.0229 0.04
0.06 Average best-so-far
F7 Median best-so-far 0.06 0.04 0.0079
0.8657 1.04
0.56 Average mean fitness
(b) (a)
(d) (c)
(f) (e)
(g)
TABLEV
A comparison between OSA, GA and PSO algorithms for the achieved results of the functions evaluation in 20 times implementation of the algorithms for the test functions F8 to F13
OSA PSO
RGA
-12564.1 -9.8E03
-1.2E4 Average best-so-far
F8 Median best-so-far -1.2E4 -9.8E03 -12569.5
-12501.1 -9.8E03
-1.2E4 Average mean fitness
5.67E-07 55.1
5.90 Average best-so-far
F9 Median best-so-far 5.71 55.6 4.76E-11
2.3744 72.8
5.92 Average mean fitness
7.64E-06 9.0E-03
2.13 Average best-so-far
F10 Median best-so-far 2.16 6.0E-03 8.64E-07
8.31E-05 0.02
2.15 Average mean fitness
0.0329 0.01
1.16 Average best-so-far
F11 Median best-so-far 1.14 0.0081 8.26E-10
000214 0.055
1.16 Average mean fitness
4.59E-12 0.29
0.051 Average best-so-far
F12 Median best-so-far 0.039 0.11 2.35E-14
1.51E-11 9.3E03
0.053 Average mean fitness
1.4E-10 8.291E-4
0.081 Average best-so-far
F13 Median best-so-far 0.032 2.463E-7 1.24E-12
3.26E-7 6.251E-2
0.081 Average mean fitness
(b) (a)
(d) (c)
(f) (e)
TABLEVI
A comparison between OSA, GA and PSO algorithms from the achieved results of the functions evaluation in 20 times implementation of the algorithms for the test functions F14 to F23
OSA PSO
RGA
0.998 0.998
0.998 Average best-so-far
F14 Median best-so-far 0.998 0.998 0.998
0.998 0.998
0.998 Average mean fitness
9.4E-04 2.8E-03
4.0E-03 Average best-so-far
F15 Median best-so-far 1.7E-03 7.1E-04 3.3E-05
5.2-E03 215.6
4.0E-03 Average mean fitness
-1.03163 -1.03136
-1.0313 Average best-so-far
F16 Median best-so-far -1.0313 -1.03136 -1.03163
-1.03136 -1.03136
-1.0313 Average mean fitness
0.3979 0.3979
0.3996 Average best-so-far
F17 Median best-so-far 0.3980 0.3979 0.3978
0.3999 2.4112
1.1696 Average mean fitness
3.0 3.0
5.70 Average best-so-far
F18 Median best-so-far 3.0 3.0 3.0
3.0 3.0
5.70 Average mean fitness
-3.8628 -3.8628
-3.8627 Average best-so-far
F19 Median best-so-far -3.8628 -3.8628 -3.8628
-3.8628 -3.8628
-3.8627 Average mean fitness
-3.3099 -3.2369
-3. 2823 Average best-so-far
F20 Median best-so-far -3.3217 -3.2531 -3.3320
-3.3098 -3.2369
-3. 2704 Average mean fitness
-6.22713 -6.6290
-5.6605 Average best-so-far
F21 Median best-so-far -2.6824 -5.1008 -10.1532
-6.11845 -5.7496
-5.6605 Average mean fitness
-9.03047 -8.1118
-7.3421 Average best-so-far
F22 Median best-so-far -10.3932 -10.402 -10.4029
-9.83367 -7.9305
-7.3421 Average mean fitness
-9.71723 -6.7634
-6.2541 Average best-so-far
F23
-10.5364 -10.536
-4.5054 Median best-so-far
-8.59024 -6.7626
-6.2541 Average mean fitness
(b) (a)
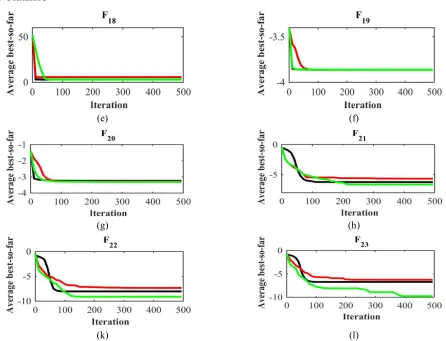
Fig.3 Continued (f) (e) (h) (g) (l) (k)
Fig. 3. A comparison between OSA, GA and PSO algorithms for the process of reaching the response for the test functions F14 to F23
TABLEVII
Results of unimodal benchmark test functions.
OSA GOA GWO FLC TLBO WCA GSA PSO RGA 2.3E-09 3.09E-08 2.54E-08 3.21E-08 3.51E-08 2.93E-08 3.75E-08 1.8E-03 23.13 Average best-so-far
F1 Median best-so-far 21.87 1.2E-03 1.53E-09 1.03E-09 1.33E-09 1.14E-09 9.07E-10 1.16E-09 8.86E-12 8.1E-08 9.75E-06 9.27E-06 1.12E-05 1.29E-05 9.22E-06 1.37E-05 5.0E-02 23.45 Average mean fitness
3.94E-06 5.31E-05 4.48E-05 5.81E-05 5.77E-05 4.89E-05 6.81E-05 2.0 1.07 Average best-so-far
F2 Median best-so-far 1.13 1.9E-03 2.70E-06 2.39E-06 2.44E-06 2.40E-06 2.13E-06 2.40E-06 2E-07 4.6E-05 5.65E-04 4.88E-04 5.72E-04 6.41E-04 5.14E-04 7.21E-04 2.0 1.07 Average mean fitness
295.381 428.5135 327.185795 434.5015 474.3833 376.0085 515.8255 4.1E03 5.6E03 Average best-so-far
F3 Median best-so-far 5.6E03 2.2E03 310.8519 211.9048 273.7557 244.2885 154.51697 222.0258 56.93836 399.656 467.3401 413.335365 460.8487 506.003 422.5738 596.5089 2.9E03 5.6E03 Average mean fitness
0.785953 0.993865 0.858736823 1.080866 1.135605 0.875257 1.205542 8.1 11.78 Average best-so-far
F4 Median best-so-far 11.94 7.4 0.539036 0.454636 0.543148 0.529933 0.446200961 0.525235 0.402746 5.210601 6.903329 5.571285788 6.923197 7.554117 5.870374 8.759519 23.6 11.78 Average mean fitness
62.8803 100.7185 71.00497787 99.36905 101.8052 85.70288 111.0475 3.6E04 1.1E03 Average best-so-far
F5 Median best-so-far 1.0E03 1.7E03 36.65635 24.395652 33.06776 29.83538 17.457305473 26.15271 6.9483 109.1664 140.6996 122.2325338 139.6439 146.3147 136.6725 149.2912 3.7E04 1.1E03 Average mean fitness
0 9.47E-07 8.7960E-12 1.08E-06 1.12E-05 9.18E-8 1.17E-04 1.0E-03 24.01 Average best-so-far
F6 Median best-so-far 24.55 6.6E-03 8.17E-05 5.58E-8 7.47E-06 7.05E-07 5.6426E-13 6.20E-07 0 0 8.19E-02 6.6251E-5 8.75E-02 9.34E-01 7.30E-03 9.39E-03 0.02 24.52
Average mean fitness
0.0229 0.031013 0.025915398 0.030744 0.034787 0.026285 0.036461 0.04 0.06 Average best-so-far
TABLEVIII
Results of multimodal benchmark test functions.
OSA GOA GWO FLC TLBO WCA GSA PSO RGA -12564.1 -10023.1 -12433.3 -11189.8 -8983.16 -12339.5 -7649.61 -9.8E03 -1.2E4 Average best-so-far
F8 Median best-so-far -1.2E4 -9.8E03 -7596.7 -12421.6 -8927.64 -11215.5 -12515.8 -10030.5 -12569.5 -12501.1 -10049.4 -12483.2 -11235.2 -8963.13 -12387.2 -7625.17 -9.8E03 -1.2E4 Average mean fitness
5.67E-07 2.89E-06 7.21E-07 9.65E-06 4.02E-05 1.74E-06 2.00E-04 55.1 5.90 Average best-so-far
F9 Median best-so-far 5.71 55.6 3.80E-08 6.72E-11 3.85E-09 8.58E-10 5.74E-11 2.66E-10 4.76E-11 2.3744 7.16236 4.51464 8.7214 6.5655 7.808032 5.897 72.8 5.92 Average mean fitness
7.64E-06 3.90E-05 1.05E-05 1.38E-04 4.64E-04 1.48E-05 7.24E-04 9.0E-03 2.13 Average best-so-far
F10 Median best-so-far 2.16 6.0E-03 3.91E-04 1.94E-06 7.38E-05 1.23E-05 1.23E-06 3.93E-06 8.64E-07 8.31E-05 2.73E-04 9.37E-05 8.56E-04 4.31E-03 1.19E-04 4.53E-02 0.02 2.15 Average mean fitness
0.0329 0.09272 0.036649 0.271735 0.659285 0.078421 0.229344 0.01 1.16 Average best-so-far
F11 Median best-so-far 1.14 0.0081 2.44E-04 3.44E-04 1.66E-04 2.75E-04 1.41E-04 9.35E-04 8.26E-10 000214 0.169546 0.95923 0.570567 0.18194 0.542009 0.6753 0.055 1.16 Average mean fitness
4.59E-12 4.26E-11 7.79E-12 1.11E-10 1.12E-10 1.86E-11 1.20E-10 0.29 0.051 Average best-so-far
F12 Median best-so-far 0.039 0.11 2.71E-11 1.03E-13 2.83E-12 6.69E-13 4.58E-14 2.46E-13 2.35E-14 1.51E-11 4.13E-11 2.07E-11 1.12E-10 2.64E-10 2.55E-11 1.82E-09 9.3E03 0.053 Average mean fitness
1.4E-10 1.36E-09 2.55E-10 4.62E-09 1.40E-08 6.30E-10 4.79E-08 8.291E-4 0.081 Average best-so-far
F13 Median best-so-far 0.032 2.463E-7 9.47E-10 2.71E-12 1.23E-10 1.98E-11 1.46E-12 7.29E-12 1.24E-12 3.26E-7 2.42E-06 5.51E-07 4.78E-06 2.38E-05 1.03E-06 6.71E-05 6.251E-2 0.081 Average mean fitness
TABLEIX
Results of fixed-dimension multimodal benchmark test functions.
OSA GOA GWO FLC TLBO WCA GSA PSO RGA 0.998 0.998 0.998 0.998 0.998 0.998 0.998 0.998 0.998 Average best-so-far
F14 Median best-so-far 0.998 0.998 0.998 0.998 0.998 0.998 0.998 0.998 0.998 0.998 0.998 0.998 0.998 0.998 0.998 0.998 0.998 0.998 Average mean fitness
9.4E-04 9.26E-04 9.35E-04 9.31E-04 9.17E-04 9.21E-04 9.12E-04 2.8E-03 4.0E-03 Average best-so-far
F15 Median best-so-far 1.7E-03 7.1E-04 3.20E-04 3.23E-04 3.22E-04 3.27E-04 3.28E-05 3.25E-04 3.3E-05 5.2-E03 1.54E-01 1.56E-01 1.55E-01 1.53E-01 1.54E-01 1.52E-01 215.6 4.0E-03 Average mean fitness
-1.03163 -1.03136 -1.03136 -1.03136 -1.03136 -1.03136 -1.03136 -1.03136 -1.0313 Average best-so-far
F16 Median best-so-far -1.0313 -1.03136 -1.03136 -1.03136 -1.03136 -1.03136 -1.03136 -1.03136 -1.03163 -1.03136 -1.03136 -1.03136 -1.03136 -1.03136 -1.03136 -1.03136 -1.03136 -1.0313 Average mean fitness
0.3979 0.3979 0.3979 0.3979 0.3979 0.3979 0.3979 0.3979 0.3996 Average best-so-far
F17 Median best-so-far 0.3980 0.3979 0.3979 0.3979 0.3979 0.3979 0.3979 0.3979 0.3978 0.3999 0.4165 0.4125 05264 0.8965 0.4015 0.9526 2.4112 1.1696 Average mean fitness
3.0 3.0 3.0 3.0 3.0 3.0 3.0 3.0 5.70 Average best-so-far
F18 Median best-so-far 3.0 3.0 3.0 3.0 3.0 3.0 3.0 3.0 3.0
3.0 3.0 3.0 3.0 3.0 3.0 3.0 3.0 5.70 Average mean fitness
-3.8628 -3.8628 -3.8628 -3.8628 -3.8628 -3.8628 -3.8628 -3.8628 -3.8627 Average best-so-far
F19 Median best-so-far -3.8628 -3.8628 -3.8628 -3.8628 -3.8628 -3.8628 -3.8628 -3.8628 -3.8628 -3.8628 -3.8628 -3.8628 -3.8628 -3.8628 -3.8628 -3.8628 -3.8628 -3.8627 Average mean fitness
-3.3099 -3.28005 -3.29299 -3.29813 -3.28169 -3.26889 -3.26538 -3.2369 -3. 2823 Average best-so-far
F20 Median best-so-far -3.3217 -3.2531 -3.27472 -3.2809 -3.29111 -3.3075 -3.29751 -3.28588 -3.3320 -3.3098 -3.26808 -3.27929 -3.28913 -3.27271 -3.26879 -3.25648 -3.2369 -3. 2704 Average mean fitness
-6.22713 -5.99554 -6.16590 -5.9699 -5.90225 -6.02935 -5.93613 -6.6290 -5.6605 Average best-so-far
F21 Median best-so-far -2.6824 -5.1008 -6.96062 -7.06551 -6.92589 -6.99546 -7.10096 -7.03038 -10.1532 -6.11845 -5.69266 -5.74972 -5.66421 -5.60805 -5.72103 -5.63615 -5.7496 -5.6605 Average mean fitness
-9.03047 -8.03153 -8.1121 -7.99172 -7.91237 -8.07163 -7.95206 -8.1118 -7.3421 Average best-so-far
F22 Median best-so-far -10.3932 -10.402 -10.1963 -10.3502 -10.1456 -10.2474 -10.4022 -10.2989 -10.4029 -9.83367 -7.85179 -7.93066 -7.81259 -7.73514 -7.89114 -7.77376 -7.9305 -7.3421 Average mean fitness
-9.71723 -6.6965 -6.76354 -6.66315 -6.59689 -6.72983 -6.62987 -6.7634 -6.2541 Average best-so-far
F. Multimodal low-dimensional functions
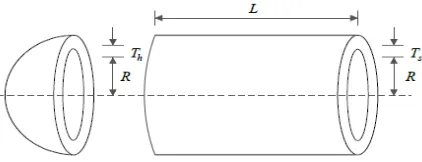
Functions Kannan and Kramer proposed this method for minimizing the total fabrication cost [32]. Fig. 4 displays the schematic view of pressure vessel, which are capped at both ends by hemispherical heads. Four variables are used in this problem:
• Ts ( , thickness of the shell).
• Th( >, thickness of the head).
• R ( B, inner radius).
• L ( E, length of the cylindrical section without
considering the head).
Among these variables, R and L are continuous variables, while Ts and Th are integer values which are multiples of
0.0625 in. The formula, which express this problem, is given
below:
Consider Z = 9 > B E: = 9,q ,5 r:
Minimize (s) = 0.6224 B E+ 1.7781 > B>+
3.1661 >
E+ 19.84 > B
Subject to:
/ (s) = − + 0.0193 BG 0
/>(s) = − B+ 0.00954 BG 0
/B(s) = −V B> E−43 V B>+ 1296000 G 0
/E(s) = E− 240 G 0
Where,
1 m 0.0625 G , >G 99 m 0.0625 , 10 G B , EG 200
Table X shows the comparison of best obtained optimal solution from OSA and other algorithms such as GWO, GOA, PSO, GA, TLBO, GSA, WCA, and SFL. The proposed OSA
provides optimal solution at Z= (0.778099, 0.383241,
40.315121, 200.00000) with corresponding fitness value equal to f (Z) = 5880.0700. From this table, it could be seen that OSA is able to find the best optimal design with minimum cost.
Table XI shows the statistical results of the problem. The results depict that OSA performs better than the other competitor algorithms in terms of best mean, and median.
VI.
CONCLUSIONRandom-based algorithms are widely used for optimization these days. Most of these algorithms are inspired by physical processes or beings' behavior. In this paper, a new optimization algorithm called Orientation Search Algorithm (OSA), based on the governing rules of a game, is introduced. The players in this game try to find the optimal response with the influence from each other and the referee.
OSA has been tested on 23 benchmark test functions. Moreover, one real-life engineering design problem is employed to determine the efficiency of the proposed algorithm. The results express that OSA provides very competitive results as compared with other well-known metaheuristics such as GOA, GWO, PSO, TLBO, WCA, GSA, GA, and SFL. The results on the unimodal and multimodal test functions shows the superior exploitation and exploration capability of OSA, respectively. Moreover, the proposed algorithm is applicable on real-life optimization problem to show its efficiency in a given search space.
Fig. 4. Schematic view of the pressure vessel problem.
TABLEX
Comparison results for pressure vessel design problem.
Algorithm Optimum variable Optimum cost
Ts Th R L
OSA 0.778099 0.383241 40.315121 200.000000 5880.0700 GWO 0.778210 0.384889 40.315040 200.000000 5885.5773 GOA 0.779035 0.384660 40.327793 199.65029 5889.3689 PSO 0.778961 0.384683 40.320913 200.000000 5891.3879 GA 0.845719 0.418564 43.816270 156.38164 6011.5148
TLBO 0.817577 0.417932 41.74939 183.57270 6137.3724
GSA 1.0855800 0.949614 49.345231 169.48741 11550.2976 WCA 0.752362 0.399540 40.452514 198.00268 5890.3279
TABLEXI
Statistical results obtained from different algorithms for pressure vessel design problem.
Algorithm Best Mean worst Std. Dev Median
OSA 5880.0700 5884.1401 5891.3099 024.341 5883.5153 GWO 5885.5773 5887.4441 5892.3207 002.893 5886.2282 GOA 5889.3689 5891.5247 5894.6238 013.910 5890.6497 PSO 5891.3879 6531.5032 7394.5879 534.119 66416.1138
GA 6011.5148 6477.3050 7250.9170 327.007 6397.4805
TLBO 6137.3724 6326.7606 6512.3541 126.609 6318.3179
GSA 11550.2976 23342.2909 33226.2526 5790.625 24010.0415 WCA 5890.3279 6264.0053 7005.7500 496.128 6112.6899
SFL 6550.0230 6643.9870 8005.4397 657.523 7586.0085
R
EFERENCES
[1] K.S. Tang, K.F. Man, S. Kwong and Q. He, “ Genetic algorithms and their applications ”, IEEE Signal Processing Magazine, 13 (6), 1996.
[2] S. Kirkpatrick, , C.D. Gelatto and M.P. Vecchi, "Optimization by simulated annealing", Science 220 (4598), 671–680, 1983.
[3] J.D. Farmer, N.H. Packard and A.S. Perelson, "The immune system, adaptation, and machine learning", Physica D 22, 187–204, 1986.
[4] M. Dorigo, V. Maniezzo, and A. Colorni, "The Ant System: optimization by a colony of cooperating agents.", IEEE Transaction on Systems, Man, and Cybernetics-part B, vol. 26, no.1, 1996, pp. 1-13.
[5] J. Kennedy and R.C. Eberhart, “Particle swarm optimization”, Proceedings of IEEE International Conference on Neural Networks, vol. 4, 1995.
[6] M. Dehghani, Z. Montazeri, A. Dehghani, and A. Seifi, "Spring search algorithm: A new meta-heuristic optimization algorithm inspired by Hooke's law," in Knowledge-Based Engineering and Innovation (KBEI), 2017 IEEE 4th International Conference on, 2017, pp. 0210-0214.
[7] M. Dehghani, Z. Montazeri, A. Dehghani, N. Nouri, and A. Seifi, "BSSA: Binary spring search algorithm," in Knowledge-Based Engineering and Innovation (KBEI), 2017 IEEE 4th International Conference on, 2017, pp. 0220-0224.
[8] Zahiri, S.H., “Swarm Intelligence and Fuzzy Systems”, Nova Science Publishers, USA, (2010).
[9] Darby, S., Mortimer-Jones, T.V., Johnston, R.L., Roberts, C., “Theoretical study of CuAunano alloy clusters using a genetic algorithm”, Journal of Chemical Physics, vol. 116, no. 4, pp. 1536–1550, (2002).
[10] M. Dehghani, Z. Montazeri, A. Ehsanifar, A. R. Seifi, M. J. Ebadi, and O. M. Grechko, "PLANNING OF ENERGY CARRIERS BASED ON FINAL ENERGY CONSUMPTION USING DYNAMIC PROGRAMMING AND PARTICLE SWARM OPTIMIZATION," 2018, p. 10, 2018-10-19 2018.
[11] M. Dehghani, M. Mardaneh, Z. Montazeri, A. Ehsanifar, M. J. Ebadi, and O. M. Grechko, "SPRING SEARCH ALGORITHM FOR SIMULTANEOUS PLACEMENT OF DISTRIBUTED GENERATION AND CAPACITORS," 2018, p. 6, 2018-12-12 2018
[12] Gigerenzer, G., Todd, P.M., the ABC Research Group (Eds.), “Simple heuristics that make us smart”, Oxford University Press, New York (1999).
[13] Voges, K.E., Pope, N.K., Brown, M.R., “Cluster Analysis of Marketing Data Examining On-line Shopping Orientation: A Comparison of K-Means and Rough Clustering Approaches”, In: H. Abbass, C. Newton, R. Sarker (Eds.) Heuristics and Optimization for Knowledge Discovery, pp. 208–225, IGI Global, (2002).
[14] Rashedi, E., Nezamabadi-pour, H., Saryazdi, S., “GSA: A Gravitational Search Algorithm”, Information Sciences, vol. 179, no. 13, pp. 2232– 2248, (2009).
[15] A. Lazar, R.G. Reynolds, “Heuristic knowledge discovery for archaeological data using genetic algorithms and rough sets”, Artificial Intelligence Laboratory, Department of Computer Science, Wayne State University, 2003. [16] Gigerenzer, G., Gaissmaier, W., “Heuristic decision
making”, Annual Review of Psychology, 62, pp. 451–482, (2011).
[17] Geem, Z.W., Kim, J.H., Loganathan, G.V., “A new Heuristic Optimization Algorithm: Harmony Search, Simulation, Society of Computer Simulation”, vol.76, no. 2, pp. 60–68, (2001).
[18] V. Gazi, K.M. Passino, “Stability analysis of social foraging swarms”, IEEE Transactions on Systems, Man, and Cybernetics – Part B 34 (1), (2004), 539–557. [19] Formato, R.A., “Central force optimization: A new
metaheuristic with applications in applied electromagnetics”, Progress In Electromagnetics Research, vol. 77, pp. 425–491, (2007).
[20] Silva, A., Neves, A., Costa, E., “An Empirical Comparison of Particle Swarm and Predator Prey Optimization. Artificial Intelligence and Cognitive Science”, vol. 2462, Springer Berlin, Heidelberg, (2002).
[21] P. Tarasewich, and P. R. McMullen," Swarm intelligence: power in numbers.", Appears in communication of ACM, August 2002, 45(8), 62-67.
[22] T. Kohonen, "Self-Organization and Associative Memory", Third Ed. Springer, Berlin, 1996.
[23] Holliday, R. Resnick and J. Walker, "Fundamentals of Physics", John Wiley and Sons, 1993.
[24] Semat, Henry and Katz, Robert, "Physics, Chapter 10: Momentum and Impulse" (1958). Robert Katz Publications. Paper #142.
[25] Eiben, A.E., Schippers, C.A., “On Evolutionary Exploration and Exploitation”, Fundamenta Informaticae, vol. 35, no. 1-4, IOS Press, Amsterdam, (1998).
faster”, IEEE Transactions on Evolutionary Computation, 3, (1999), 82–102.
[27] H. Eskandar, A. Sadollah, A. Bahreininejad, and M. Hamdi, "Water cycle algorithm–A novel metaheuristic optimization method for solving constrained engineering optimization problems," Computers & Structures, vol. 110, pp. 151-166, 2012.
[28] R. V. Rao, V. J. Savsani, and D. Vakharia, "Teaching– learning-based optimization: a novel method for constrained mechanical design optimization problems," Computer-Aided Design, vol. 43, pp. 303-315, 2011. [29] M. Eusuff, K. Lansey, and F. Pasha, "Shuffled
frog-leaping algorithm: a memetic meta-heuristic for discrete optimization," Engineering optimization, vol. 38, pp. 129-154, 2006.
[30] S. Mirjalili, S. M. Mirjalili, and A. Lewis, "Grey wolf optimizer," Advances in engineering software, vol. 69, pp. 46-61, 2014.
[31] S. Saremi, S. Mirjalili, and A. Lewis, "Grasshopper optimisation algorithm: theory and application," Advances in Engineering Software, vol. 105, pp. 30-47, 2017. [32] B. Kannan and S. N. Kramer, "An augmented Lagrange
multiplier based method for mixed integer discrete continuous optimization and its applications to mechanical design," Journal of mechanical design, vol. 116, pp. 405-411, 1994.
Mohammad Dehghani received a B.S. degree in Electrical Engineering from Shahid Bahonar University, Kerman, Iran, in 2012, and M.S. degree in the same subject from Shiraz University, Shiraz, Iran, in 2016. He has been PhD. Student at Shiraz University of Technology, Shiraz, Iran, since 2016. His current research interests include optimization, power systems, microgirds, distributed generation, and optimal operation of distribution networks.
Zeinab Montazeri received a B.S. degree in Electrical Engineering from Electrical Engineering Islamic Azad University of Marvdasht. Marvdasht, I.R. Iran, in 2016 and M.Sc. degree in Electrical Engineering Islamic Azad University of Marvdasht, Marvdasht, I.R. Iran, in 2018. She has been PhD. Student at Shiraz University of Technology, Shiraz, Iran, since 2018. Her current research interests include optimization, power systems, microgirds, distributed generation, and optimal operation of distribution networks.
O.P. Malik received the National Diploma in electrical engineering from Delhi Polytechnic, Delhi, India, in 1952, the M.E. degree in electrical machine design from Roorkee University, Roorkee, India in 1962, and the Ph.D. degree from the University of London, London, U.K. and the Diploma of the Imperial College of the Imperial College of Science and Technology, London, in 1965.
He became a Professor in the Department of Electrical and Computer Engineering, University of Calgary, Calgary, Canada, in 1974 where he is currently a Professor Emeritus. He has been engaged in research in collaboration with industry and teams from many countries in the areas of adaptive control and protection of power systems, and generation of electricity from renewable sources. He has served in many additional capacities at the University of Calgary including Associate Dean Academic and Student affairs, and Acting Dean of the Faculty of engineering
Ali Ehsanifar received the B.Sc. degree in electrical engineering from Razi University, Kermanshah, Iran, in 2013 and the M.Sc. degree in electrical engineering from Shiraz University, Shiraz, Iran, in 2017. His research interests include diagnosis of power transformer, high voltage, insulation and power quality, evolutionary algorithms, and multi-objective optimization.