Evaluation of Chipping Productivity with
Five Different Mobile Chippers at Different
Forest Sites by a Stochastic Model
Mika Yoshida, Simon Berg, Rin Sakurai, Hideo Sakai
Abstract
It is important to evaluate chipping productivity that often differed according to the timing of observations and varied unexpectedly. A variation in production was the major concern of stakeholders for sustainable forest operation to establish regularly attainable production sched -ules on many operational levels. The aim of this study was to estimate the variance of chipping productivity by using a stochastic simulation model to achieve the objective evaluation of chipper performances. Chipping operations of five different kinds of mobile chippers, i.e. three smaller and two middle and larger ones in horse powers, were investigated. Probability dis -tributions of material size and feeding time for chipping in a log-normal distribution were estimated. The estimates were made based on chipping operations performed 2000 or 4000 times by mechanical repetitions. Except for the largest chipper, whose observed productivity was 338 loose m3/hr, all of the observed productivities, varying from 18 to 68 loose m3/hr, were located within a two-sided confidential interval whose difference between both ends was 4 to 10 loose m3/hr. The estimates were, generally, reliable with small variances around the median productivity values in the model. By this stochastic model, chipper productivity could be shown objectively, while the accuracy would be improved more by increasing sample size and accurate material size measurement. It was elucidated that the operations followed by chipping should encompass enough volume capacity to provide stable chipping productivity.
Keywords: biomass energy, feeding operation, forestry operation, stochastic simulation, supply chain management
1. Introduction
The wood use as a renewable energy resource is a global trend. In EU, for instance, the target rate of renewable energy share was clearly stated as 20% in
2020 (European Commission 2013) and the share of woody biomass might account for two-thirds of the target (European Commission 2015). In Canada and
the US, the regular share of wood as a renewable en -ergy was also reported (Government of Canada 2014, US Energy Information Administration 2015). Wood demand as an energy resource enabled the use of lower quality timbers and logging residues. It was, therefore, expected to provide additional resources and profit for forest companies or forestland owners while improving forest health and quality.
In Japan, the planted forests occupied a quarter of land, and about half of them were under 50 years old (Japanese Forestry Agency 2015). It was a major con-cern to manage and utilize the lower quality of timbers produced from such planted forests. While there were conventional chip supply chains for pulp industries using fixed chippers at factories or storage sites, some mobile chippers had begun to be introduced to pro-duce wood chips at forest roadside with the expecta-tion of stable chip supply to power plants as a resource. One of the emerging issues on mobile chippers was estimating the productivity of chipping operations because their working conditions and wood materials always changed compared to fixed chippers.
required a well-balanced transportation and logistics to factory or storage sites to realize the maximum uti-lization of chipper (Talbot and Suadicani 2005), be-cause the price of chippers was generally expensive (Yoshida and Sakai 2014). Indeed, it was possible to discharge chips on the ground and to reload them onto
the truck, but additional cost would occur in the re -loading process (Stampfer and Kanzian 2006) and chips would lose quality by getting contaminated with soil (Spinelli and Hartsough 2001). Therefore, the im-portance of chipping productivity estimation of mo-bile chippers has been gradually recognized for opti-mized transportation scheduling.
It was well known that the productivity of wood chipping was mainly affected by the total solid volume of a piece of material and the relationship could be expressed in various ways: such as chipping time per ton/volume for average piece size (Spinelli and Hart-sough 2001, Assirelli et al. 2013); for load size of a loader (Röser et al. 2012); for piece size under a multi-linear regression analysis (Ghaffariyan et al. 2013); and for butt-end diameter of logs (Yoshida and Sakai 2014). Previous models of productivity estimation were gen-erally analyzed by using linear regression for the aver-age of material sizes in a forest area. Furthermore, productivity usually differed according to the timing of observations. It was also proved that there were dif-ferences between estimated and actual productivities across chipper machines (e.g. Spinelli and Magagnot-ti 2010, Ghaffariyan et al. 2013). As the material supply and the product delivery were scheduled under the typical productivity, unexpected variances of chipping productivity sometimes diminished or eroded profit in its supply chain. Therefore, the realistic and typical value of chipping productivity and its possible vari-ance should be grasped in advvari-ance for profitable and sustainable management of chip supply chain.
The variance of chipping productivity seemed to be decided mainly by fluctuations in feeding time of a piece of material to a chipper. Compared to other for-estry operations, such as timber harvesting, chipping operation had less complex operations (Röser et al. 2012), and operator’s effect could be regarded as secon-dary and minute to overall production (Spinelli and Magagnotti 2010). Thus, the variance of chipping pro-ductivity might be mainly derived from the accumula-tion of uncertainty in material volume and feeding op-erations, and the machinery condition such as blade wear (Spinelli et al. 2014).
The aim of this study is to estimate the variance of chipping productivity by using a stochastic simulation model for the objective evaluation of chipper perfor-mance. Stochastic simulation method was selected to analyze the productivity variance since the method is suitable to describe complex problems including
in-teractions and uncertainty. This approach had been used in previous studies such as Gallis (1996), Talbot and Suadicani (2005), Asikainen (2010) and Zamora-Cristales et al. (2013) to analyze interactions among production and transportation processes. Since feed-ing and chippfeed-ing operations were in an interactive relationship (Röser et al. 2012), this study analyzed productivity of five different types of currently used mobile chippers considering the interaction within a process and verified the robustness of the method.
2. Material and methods
2.1 Time observation and machine selection
To obtain real data at forest chipping site, time ob-servations recorded by stop watch were conducted nearby the five mobile chippers during operations. The observed productive chipping system factors in a cycle were divided into two main elements: feeding to chip-per and ochip-perational delay. A cycle of feeding to chipchip-per operation, which essentially determined the productiv-ity, was defined as the time between the start of grap-pling by the loader movement onto the material pile after the previous releasing of materials and the end of releasing materials on the feeder. The operational delay was time of extra operations that included cleaning the landing site; preparing logs from piles; and removal of stuck logs in the feeder, which randomly occurred. All operational delays less than 15 minutes were taken into consideration in the productivity calculation for secur-ing comparability; they were used as one of the criteria to classify delays (Samset 1990). Other delays over 15 minutes could be regarded as avoidable delays that could be excluded from the analysis by giving appro-priate considerations. Mechanical and observation
de-lays were also excluded.
To derive productivity, the common formula for chipping productivity P (loose m3/hr) was used as
shown below: 1 / n i i
P d V h =
=
∑
(1)Where:
d density coefficient for converting solid vol-ume to chip volvol-ume (loose m3/solid m3)
n total number of feeding operations in a pro-duction period
Vi material solid volume in each i time of feeding
operation (solid m3)
h gross working time of a chipping operation (hr) consisting of the time for feeding opera-tions and operational delays less than 15
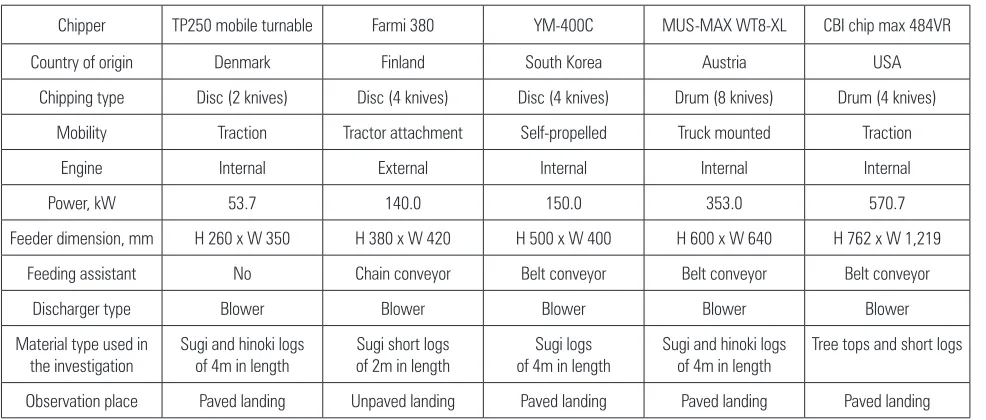
In this study, analysis was made of five different types and sizes of mobile chippers: TP250 mobile turn-able disc chipper (expressed as TP250); Farmi 380 disc chipper; YM-400C disc chipper; MUS-MAX WT8-XL drum chipper (expressed as MUS-MAX); and CBI chip max 484VR drum chipper (expressed as CBI). They had been already in active use in their countries of origin and could be considered as representative. The chipper machine details are summarized in Table 1.
TP250 was the smallest chipper in size with engine power of 53.7 kW, and it was chosen for its small size. This chipper was designed for manual loading and vehicle traction, and an independent wheel loader was used to assist its loading operation. Farmi 380 and YM-400C had similar engine power of 140 kW and 150 kW, respectively. Farmi 380 was one of the attachments connected to the tractor power take off (PTO). It had a feeding assistant chain conveyor and an integrated grapple loader. YM-400C was an inde-pendent machine mounted on a four-wheeled vehicle equipped with a feeding assistant belt conveyor and it had to be supported by a separate grapple loader. Because of their relatively smaller size and mobility, these three chippers seemed to be fitted to small-scale forestry and operations along forest roads. MUS-MAX was a truck mounted chipper with a feeding assistant belt conveyor and an integrated grapple loader. It was chosen for its all-in-one system. It had an engine with 353 kW power, and could be regarded as a middle class chipper. CBI was the representative of large chippers both in size and engine power. It was equip-ped with an engine of 570.7 kW power and a belt con-veyor in front of the feeder.
At a feeding operation, plural pieces of material were fed at every feeding cycle in the investigations except for YM-400C. Although YM-400C had a feeder big enough for plural pieces, only a piece of material was fed per cycle because plural pieces were stuck when fed. The investigation sites were located in dif-ferent areas of Japan: TP250, YM-400C, and CBI were observed in Shimane Prefecture; Farmi 380 was ob-served in Yamagata Prefecture; and MUS-MAX in Akita Prefecture. The operational sites were at paved landings except for Farmi 380 at a storage landing.
2.2 Material size measurement
The number of logs of each feeding operation was observed and recorded by a video camera to verify the number or quantity of fed materials. The materials were prepared in accordance with the usual practice and the size was measured during actual investiga-tions by different methods. In the investigainvestiga-tions of TP 250 and YM-400C, logs of 4 m in length were used, and their top and butt-end diameter and length were mea-sured for the volume calculation by Smalian’s formula. In the investigation of Farmi 380, short logs of 2 m in length were used; the top-end diameter of 124 logs was randomly measured from the pile to estimate the ma-terial size distribution. It was possible to regard such short logs as column-shaped timber, and the volume was calculated by squared diameter method from top-end diameters. In the investigation of CBI, the total weight of logs was measured as 7.3 wet-tonnes before chipping. The average volume of a piece of material was calculated by the number of logs and the weight density coefficient of 0.6 wet-tonne/solid m3 assuming
Table 1 Chipper machine details
Chipper TP250 mobile turnable Farmi 380 YM-400C MUS-MAX WT8-XL CBI chip max 484VR
Country of origin Denmark Finland South Korea Austria USA
Chipping type Disc (2 knives) Disc (4 knives) Disc (4 knives) Drum (8 knives) Drum (4 knives)
Mobility Traction Tractor attachment Self-propelled Truck mounted Traction
Engine Internal External Internal Internal Internal
Power, kW 53.7 140.0 150.0 353.0 570.7
Feeder dimension, mm H 260 x W 350 H 380 x W 420 H 500 x W 400 H 600 x W 640 H 762 x W 1,219
Feeding assistant No Chain conveyor Belt conveyor Belt conveyor Belt conveyor
Discharger type Blower Blower Blower Blower Blower
Material type used in
the investigation Sugi and hinoki logs of 4m in length Sugi short logs of 2m in length of 4m in lengthSugi logs Sugi and hinoki logs of 4m in length Tree tops and short logs
that the wet-based moisture content was 50% moisture base whose oven-dry weight was 0.3 oven-dry tonnes (Greenhouse Gas Inventory Office of Japan et al. 2014). The number of fed logs at a feeding operation was regarded as the material size distribution. In the inves-tigation of MUS-MAX, logs of 4 m in length were used; thier top-end diameters were previously classified in 2 cm increment by the operation contractor for the cal-culation of volume by using a volume table used in practice. The unit »loose m3« meant a cubic meter of
chip volume.
2.3 Simulation method
The probability distributions of feeding time and material size were assumed to follow a log-normal distribution because all of the figures were positive numbers and theoretically could be infinite. To obtain appropriate location m and scale s parameters, feeding time, and material size data, these parameters were re-sampled by bootstrapping 2000 repetitions on TP250, YM-400C, Farmi 380 and MUS-MAX, and by 4000 repetitions on CBI because of its small original sample size. The normality of generated parameters was tested by Shapiro-Wilk normality test, and the adaptability of mean and median values was also ex-amined.
By using these obtained parameters, chipping pro-ductivity at j time of repetitions Pj (loose m3/hr) was
expressed by using two independent probability dis-tributions, as the formula (2):
(
)
j
, D
(1 ) ( ) / ( )
M F
P d f M g F
∈
= −a
∑ ∫
(2)Where:
a operational delay time ratio observed in ac-tual operations
data set of trials indicating the number of
op-eration cycles F and materials M
f(M) probability distribution of material size at a feeding operation
g(F) probability distribution of feeding time. These denominators and numerators were inde-pendent. The density coefficient d was set at 2.8 loose m3/solid m3 here (Serup et al. 2002). R-language ver.
3.1.2 (R Core Team 2014) was used for all analyses and simulations.
3. Results
3.1 Result of chipping observation
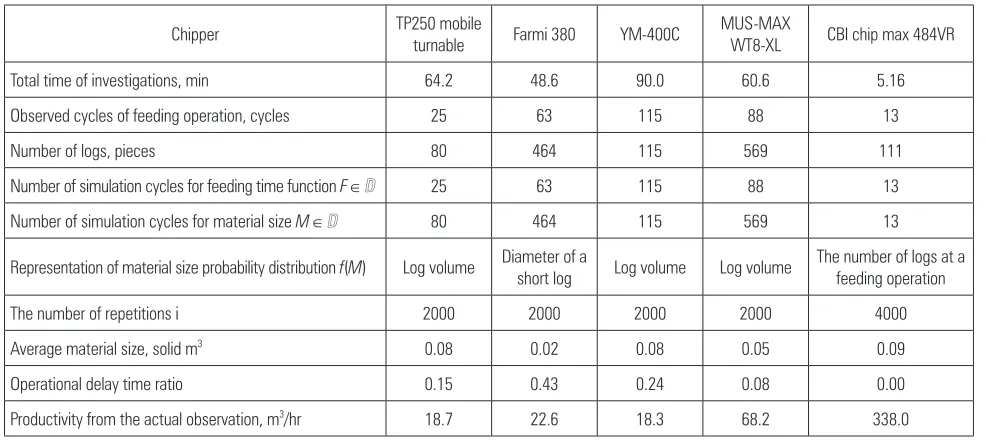
Investigation details are summarized in Table 2. The productivity of MUS-MAX was higher than that of other three smaller chippers with the relatively lower operational delay time ratio. CBI showed the highest productivity. In all of the observations, there were no operational delays exceeding 15 minutes. The delay ratio of Farmi 380 was greater than that of others and the delay time of CBI was not observed.
3.2 Result of simulation
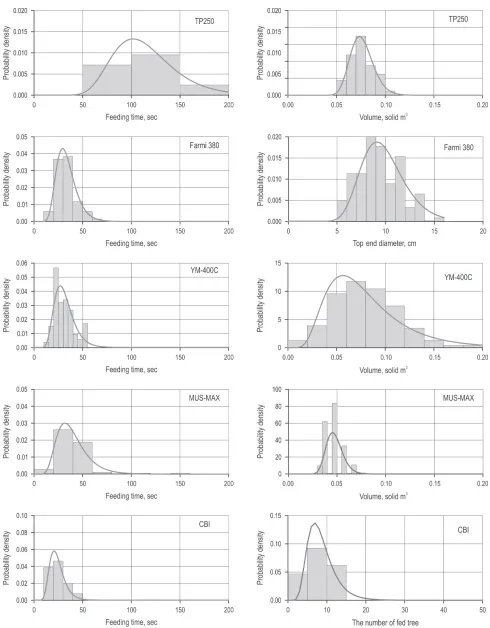
Fig. 1 shows the histograms and fitted probability distributions for the time of feeding operation and ma-terial size of each chipper. The fitted distribution of
Table 2 Investigation details and simulation constraints
Chipper TP250 mobile turnable Farmi 380 YM-400C MUS-MAX
WT8-XL CBI chip max 484VR
Total time of investigations, min 64.2 48.6 90.0 60.6 5.16
Observed cycles of feeding operation, cycles 25 63 115 88 13
Number of logs, pieces 80 464 115 569 111
Number of simulation cycles for feeding time function F Î 25 63 115 88 13
Number of simulation cycles for material size M Î 80 464 115 569 13
Representation of material size probability distribution f(M) Log volume Diameter of a
short log Log volume Log volume
The number of logs at a feeding operation
The number of repetitions i 2000 2000 2000 2000 4000
Average material size, solid m3 0.08 0.02 0.08 0.05 0.09
Operational delay time ratio 0.15 0.43 0.24 0.08 0.00
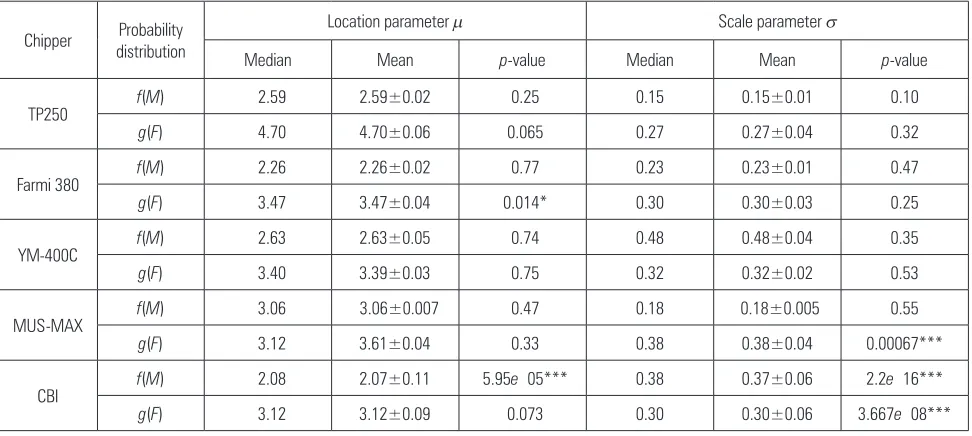
material size of CBI had a peaked distribution higher than its histogram, and that of MUS-MAX had a gen-tler peak compared to its histogram, while the others were generally well-fitted to log-normal distribution. The location and scale parameters and p-values by Shapiro-Wilk normality test of these parameters are shown in Table 3. Although the p-values were partly significant for Farmi 380, MUS-MAX and CBI, all of the location and scale parameters were concentrated in a very narrow range around the mean/median val-ues as normal distribution. The median valval-ues were, therefore, represented as both location and scale pa-rameters for probability distribution.
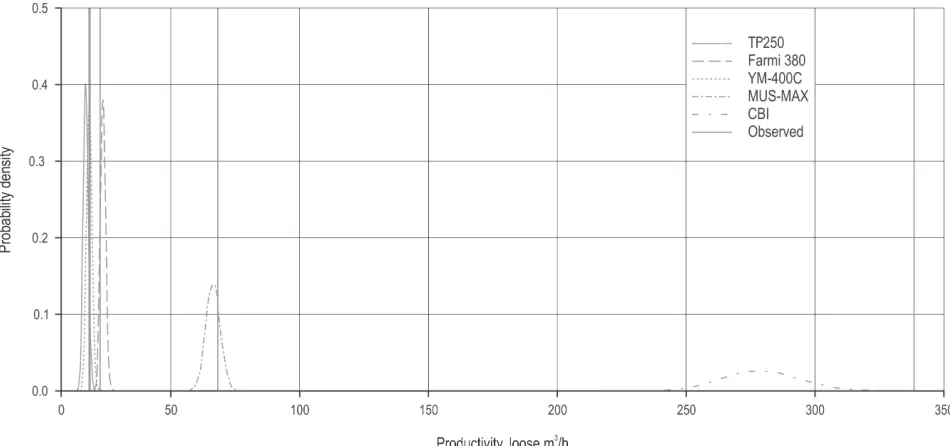
The estimated productivity distributions are sum-marized in Table 4, and illustrated visually in Fig. 2. Productivities could be estimated with variance, and objectively evaluated. The productivities from actual observations were within each two-sided confidential interval (p =0.05) except for CBI, and the obtained pro-ductivity distributions generally seemed to be reliable. All of the productivity distributions were positively skewed, and the median values were available as the representative productivity. The productivity distribu-tion of TP250 and YM-400C was similar to each other despite their differences in machine size and engine power. Comparing the estimated productivities of YM-400C and Farmi 380, that of Farmi 380 was higher while the machine size and engine power were similar
to each other.
The productivity of chippers TP250, YM-400C, and Farmi 380 concentrated in a narrow variance with about 4 loose m3/hr difference in two-sided
confiden-tial interval. The estimated productivity of middle class machine MUS-MAX, which had bigger mechan-ical power potential, also varied only in 10 loose m3/hr
differences in the two-sided confidential interval, and the productivity was also concentrated around the me-dian value as well as those of other three smaller chip-pers. On the contrary, the productivity of CBI, whose engine power was about double to 10 times larger than those of others, varied in about 60 loose m3/hr difference
Table 4 Summary of chipping productivity estimation using a sto-chastic modeling method
Chipper TP250 Farmi 380 YM-400C MUS-MAX CBI
Min, m3/hr 13.55 20.12 15.44 58.15 226.77
Median, m3/hr 17.01 23.72 18.40 66.33 278.44
Mean, m3/hr 17.04 23.72 18.41 66.37 270.09
Max, m3/hr 20.63 27.69 23.04 75.83 343.62
Two sided confidential interval, m3/hr
Lower 15.25 21.84 16.42 60.94 250.98
Upper 19.12 25.79 20.51 71.90 309.65
Skewness 0.14 0.15 0.16 0.06 0.20
Kurtosis 0.002 0.11 0.11 –0.018 0.10
The term »m3« means loose m3 here
Table 3 Parameters of log-normal distribution for material size and feeding time, and p-value of Shapiro-wilk normality test
Chipper distributionProbability Location parameter m Scale parameter s
Median Mean p-value Median Mean p-value
TP250 f(M) –2.59 –2.59±0.02 0.25 0.15 0.15±0.01 0.10
g(F) 4.70 4.70±0.06 0.065 0.27 0.27±0.04 0.32
Farmi 380 f(M) 2.26 2.26±0.02 0.77 0.23 0.23±0.01 0.47
g(F) 3.47 3.47±0.04 0.014* 0.30 0.30±0.03 0.25
YM-400C f(M) –2.63 –2.63±0.05 0.74 0.48 0.48±0.04 0.35
g(F) 3.40 3.39±0.03 0.75 0.32 0.32±0.02 0.53
MUS-MAX f(M) –3.06 –3.06±0.007 0.47 0.18 0.18±0.005 0.55
g(F) 3.12 3.61±0.04 0.33 0.38 0.38±0.04 0.00067***
CBI f(M) 2.08 2.07±0.11 5.95e–05*** 0.38 0.37±0.06 2.2e–16***
g(F) 3.12 3.12±0.09 0.073 0.30 0.30±0.06 3.667e–08***
in the two-sided confidential interval. Indeed, the CBI had high potential of productivity, but this large dif-ference could be a problem in production scheduling and investment. Business planning would need im-provement.
4. Discussion
4.1 Suggestions for productivity improvement
The operational delay time ratios of chippers var-ied and it implvar-ied the possibility of productivity im-provement because delay had a big influence on chip-ping operation (Spinelli and Visser 2009). The productivity of YM-400C was similar to that of small-er chippsmall-er, TP250. Increasing the avsmall-erage size of mate-rial and consecutive feeding were an effective way to improve productivity. As only a log could be fed at one feeding operation for YM-400C due to its weak power of feeding roller, reducing operational delays at least to the delay time ratio that TP250 showed was also another way to improve productivity. Farmi 380 also had a larger operational delay time ratio, which might have a negative effect on the productivity at the inves-tigation site, where material piles were located behind the feeder entrance. It would be possible to decrease such operational delay by locating the material pile in front of the feeder. The other three chippers, TP250, CBI and MUS-MAX, showed smaller operational de-lay time ratios. The productivity of bigger class chip-pers could be improved and made sustainable by pre-paring sufficiently large amounts of material.
The size of TP250 was, however, small and manual feeding system restricted log sizes even if the operator used a wheel loader for feeding assistance. Hence, it had few possibilities of productivity improvement. Conversely, MUS-MAX had a larger entrance and a feeding-assistant belt conveyor. The capacity seemed to be used at maximum because the chipper could have multiple logs fed at the same time at the feeding operation during the observation. As for MUS-MAX, its chipping productivity improvement could only be possible by extending the length of timber logs. The largest machine, CBI, had a greater feeding space for putting more material onto the conveyor during the observations. Furthermore, utilization of a grapple loader with larger grappling capacity would increase the volume of a feeding operation. In general, the ap-propriate use and setup of operation on site are impor-tant to achieve the full performance of chippers. It is also necessary to determine how the system could be improved to increase its performance and efficiency.
4.2 Discussion of the model
There were almost no differences between the mean and median values. Log-normal distribution was generally well-correlated to express feeding time and material size distributions because chipping op-eration was simple to form a supply chain and stable in its production. The location and scale parameters estimated from one dataset of an actual operation could represent feeding time and material size distri-butions at an acceptable level by applying re-sampling method used in this study.
The observed productivities were in the range of two-sided confidential intervals except for CBI. One possible reason for this result on the CBI was that the actual number of material during investigation might be more than that recorded. The true material size dis-tribution of CBI in the investigation might be wider and the average would actually be smaller.
The productivity variance expressed by two-sided confidential intervals could be derived from the num-ber of trials in a simulation . Based on a common law known as the law of large numbers, the average of the results obtained from a larger number of trials should be close to the real mean. The trial numbers of CBI was smaller than others in the material size distribution, which caused wider productivity variance of more about 60 loose m3/hr difference in the two-sided
con-fidential interval. A continuous operation with larger operation cycles and materials was, therefore, prefer-able to achieve productivities in a narrow variance and to establish a stable chip supply chain based on a reli-able chipping productivity by neutralizing the vari-ance in chipping productivity.
For MUS-MAX, the material size was measured by the conventional method using volume table with a diameter increment of 2 cm. For example, the volume of a log with the diameter of 17.9 cm was actually cal-culated as that of a log with the diameter of 16.0 cm. Therefore, the histogram was discrete and concen-trated on some specific volumes. The volume of mate-rials used in this study seemed to be underestimated, causing differences between the histogram from ac-tual data and the fitted distribution. However, this underestimation was minor in this study because the size distribution would not be varied enough to affect the result of productivity estimation, and because the number of feeding cycles in a continuous operation was enough to neutralize the variation of each feeding operation. Nevertheless, the measurement of mate-rial size was important and should be precise as much as possible to provide the estimated chipping produc-tivity.
For further development of this simulation meth-od, it is necessary to have a large and accurate data pool of feeding time, material size distribution, and operational delay time obtained from practice on dif-ferent kinds of chippers. Recently, some grapple load-ers have been equipped with an automatic data collec-tion system to record their actual productive time ratio and fuel consumption. Such technology is useful to get feeding and operational delay time automatically. Data sharing among researchers and stakeholders of chip supply chain are also useful to increase the amount of verified data for objective comparison of chippers with a comprehensive database.
4.3 Evaluation of five chippers and suggestion
Considering the hot system in which chips were transported directly after chip production (Asikainen 1998), MUS-MAX would have an advantage in terms of interaction with transportation because the capac-ity of typical semi-trailers/large trucks was around 40 m3 in Japan, so that chipping time would be less
than one hour by MUS-MAX and chipping and trans-port could be harmonized. The other three smaller chippers would take more time for chipping and they would be suitable for the combination with smaller trucks, whereas all of truck capacities commonly used in Japan seemed to be too small for CBI to show its potential. Therefore, for CBI, it was preferable to ar-range a system with no interaction between chipping operation and chip transportation systems. Table 4 showed that the productivity began to vary increas-ingly as the chipper size became larger; therefore, the conditions of operation at chipping site, and quantity and quality of material should be made as good as possible especially for large class chippers.
5. Conclusions
The variance of productivities for each chipper could be estimated from recorded observations, and it could be neutralized by increasing the number of feed-ing cycles. This stochastic model applyfeed-ing log-normal distributions both to feeding operations and material size was useful to estimate the objective productivity and its variance. Accurate material size measurement was indispensable to make this estimation more pre-cise, and the optimal operational setup for each ma-chine characteristics should be applied in order to present its productivity. Typical productivities could be represented by the median values of the productiv-ity distribution, and these corresponded to their en-gine powers. At the same time, the variance of produc-tivity should be taken into account when choosing chippers and planning chip supply chain.
Acknowledgements
We are grateful to Mr. Ishiyama from Forest Realize Co., Ltd., Kaneyama-machi forest owners’ association, Kazuno forest owners’ association, Sekiou forest own-ers’ association, Okidouzen forest ownown-ers’ association and Shinwa-Sangyo Co., Ltd. for offering opportuni-ties of chipping observation. We would like to thank Dr. Dillon Chrimes for his English revision. This work was partly supported by Grant-in-Aid for JSPS
6. References
Asikainen, A., 1998: Chipping terminal logistics. Scandina-vian Journal of Forest Research 13(1–4): 386–392.
Asikainen, A., 2010: Simulation of stump crushing and truck transport of chips. Scandinavian journal of forest research 25(3): 245–250.
Assirelli, A., Civitarese, V., Fanigliuo, R., Pari, L., Pochi, D., Santangelo, E., Spinelli, R., 2013: Effect of piece size and tree part on chipper performance. Biomass and Bioenergy 54: 77–82.
European Commission, 2013: Report from the Commission to the European Parliament, the Council, the European Eco-nomic and Social Committee and the Committee of the Re-gions, Renewable Energy Progress Report. European Com-mission. Brussels, Belgium, 15 p.
European Commission, 2015: Biomass potential. Webpage on the Internet; last access 2016 March 7. Available from http://ec.europa.eu/agriculture/bioenergy/potential/index_ en.htm.
Gallis, C.T., 1996: Activity oriented stochastic computer simulation of forest biomass logistics in Greece. Biomass and Bioenergy 10(5–6): 377–382.
Ghaffariyan, M.R., Spinelli, R., Brown, M., 2013: A model to predict productivity of different chipping operations. South-ern Forests 75(3): 129–136.
Greenhouse Gas Inventory Office of Japan, Center for Glob-al EnvironmentGlob-al Research, NationGlob-al Institute for Environ-mental Studies, Japan, 2014: National Greenhouse Gas In-ventory Report of Japan. National Institute for Environmental Studies, Japan, 712 p.
Government of Canada, 2014: About electricity, Natural re-source Canada. Webpage on the Internet; last access 2015 November 24. Available from http://www.nrcan.gc.ca/en-ergy/electricity-infrastructure/about-electricity/7359. Japanese Forestry Agency, 2015: Annual Report on Forest and Forestry in Japan, Fiscal Year 2014. Japanese Forestry Agency, Tokyo, 206 p. (In Japanese)
R Core Team., 2014: R: A language and environment for sta-tistical computing. R Foundation for Stasta-tistical Computing, Vienna, Austria. URL http://www.R-project.org/.
Röser, D., Mola-Yuego, B., Prinz, R., Emer, B., Sikanen, L., 2012: Chipping operations and efficiency in different opera-tional environments. Silva Fennica 46(2): 275–286.
Samset, I., 1990: Some observations on time and performance studies in forestry. Communication of the Norwegian Forest Research Institute 43(5): 1–80.
Serup, H., Falster, H., Gamborg, C., Gundersen, P., Hansen, L., Heding, N., Jakobsen, H.H., Kofman, P., Nikolaisen, L, Thomsen, I.M., 2002: Wood for Energy Production, Technol-ogy-Environment-Economy. Second revised edition. The Centre for Biomass Technology. 69 p.
Spinelli, R., Hartsough, B., 2001: A survey of Italian chipping operations. Biomass and Bioenergy 21(6): 433–444.
Spinelli, R., Magagnotti, N., 2010: A tool for productivity and cost forecasting of decentralized wood chipping. Forest Policy and Economics 12(3): 194–198.
Spinelli, R., Visser, R., 2009: Analyzing and estimating delays in wood chipping operations. Biomass and Bioenergy 33(3): 429–433.
Spinelli, R., Glushkov, S., Markov, I., 2014: Managing chipper knife wear to increase chip quality and reduce chipping cost. Biomass and Bioenergy 62: 117–122.
Stampfer, K., Kanzian, C., 2006: Current state and develop-ment possibilities of wood chip supply chains in Austria. Croatian Journal of Forest Engineering 27(2): 135–145. Talbot, B., Suadicani, K., 2005: Analysis of two simulated in-field chipping and extraction system in spruce thinnings. Biosystems Engineering 91(3): 283–292.
US Energy Information Administration, 2015: Annual En-ergy Review 10.1 Renewable enEn-ergy production and con-sumption by primary energy source, 1949–2012. Web page on the Internet; Last access 2015 October 20. Available at http://www.eia.gov/totalenergy/data/monthly/index.cfm. Yoshida, M., Sakai, H., 2014: Importance of capital cost re-duction of chippers and their required productivity. Journal of Forest Research 19(4): 361–368.
Received: November 2, 2015 Accepted: March 9, 2016
Authors’ address: Mika Yoshida, PhD.*
e-mail: [email protected] University of Tsukuba
Faculty of life and Environmental Sciences 1-1-1 Tennoudai, Tsukuba-shi
Ibaraki, 305-8577 JAPAN
Prof. Hideo Sakai, PhD.
e-mail: [email protected] Simon Berg, PhD.
e-mail: [email protected] Department of Forest Science The University of Tokyo
Graduate School of Agricultural and Life Sciences 1-1-1, Yayoi, Bunkyo-ku
Tokyo, 113-8657 JAPAN
Rin Sakurai, PhD.
e-mail: [email protected] University of Miyazaki
Faculty of Agriculture
1-1, Gakuen-Kibanadai-Nishi, Miyazaki City Miyazaki, 889-2192
JAPAN