SKILLS LEARNING COMPETENCY OF THE SECONDARY SCHOOL
STUDENTS IN THE PHYSICS LABORATORY
By Iqbal Shah•
Abstract
Practical skills occupy a pivotal position in the laboratory teaching learning process. Developing the practical skills in the students is a very common objective of teaching Physics. Laboratories are one of the characteristic features of education in the sciences at all levels. It would be rare to find any course in any institution of education without a substantial component of laboratory activity.
This paper describes the performance of girl students’ skills learning at secondary school level in the Physics laboratory. A teacher made criterion - reference test was applied to measure three practical skills that is measuring skills, graph drawing skills and graph interpreting skills. The objectives were to study competency in measurement skills, in graph drawing skills and in graph interpreting skills. Only eight percent of the student achieved the mastery level in any of the three skills. The performance of the students in measurement skills was comparatively better than the other two skills. The performance of the students in graph interpreting was very poor of all the three skills.
It is important to think about the ways of teaching in the context of laboratory work and also the facilities in the laboratories. In developed countries like UK, where great time and money is spent on doing practical work in schools, there is a need for sound empirical based evidence to justify the laboratory work. For developing countries, like Pakistan, the same justification is needed in order to set up and manage good laboratory for all science courses.
This study has aimed at exploring the competency in Physics laboratory skills learning of the secondary school level students.
Only 8% students achieved the mastery level in learning the three skills. The competences of the students were much below than the criterion marks (80%) fixed for this study.
Introduction
The tools and techniques of measurements provide the most useful bridge between every day world of the layman and of the specialist in science (Kline, 1998). In their daily lives and concerns laymen are involved in the activities and the ideas of measurement.
Gagne (1963) included measuring among the skills needed to learn science and carry out experiments. Coelho and Sere (1998) note that despite the centrality and the considerable
•
conceptual activity that both precedes and follows the issue, insufficient time is given to discussing measurement in school. Lubben and Millar (1996) report that many students, aged 9-14, make measurements with no apparent awareness of the uncertainty associated with the measurement process or of the need to be able to defend their data as reliable.
From an historical perspective the importance of practical work in science courses has increased significantly over the last hundred years and has been accompanied by shift in emphasis from the lecture-demonstration to the hands-on approaches. What are the reasons that practical work is so important in science courses?
There are many reasons but the following may be the most important:
Each scientific discipline has a range of specific techniques, skills, which are used by professional scientists of that discipline, and must be mastered by students before they can practice as experimentalists. Because these operations involve skills in the psychomotor domain, typically the manipulation of practical pieces of apparatus together with skills in the cognitive domain, such as the ability to interpret, calculate and evaluate results from the measurements, which were made.
Shymansky and Penick, (1975) and Black and Ogorn (1979) grouped the aims of practical work into four classifications:
1. The specific techniques or skills.
2. The more abstract skills of experimental inquiry and the scientific method. 3. The illustration of ideas of the subject.
4. Aims in the affective domain.
Canduff and Reid (2003) outlined the need of the laboratory work in terms of three broad areas:
1. Practical skills (including safety, hazards, risks assessment, procedures, instruments observation of methods).
2. Transferable skills (including team working, organization, time management communication, presentation, information retrieval, data processing, numeric, designing strategies, problem solving): and
3. Intellectual stimulation, connection with the ‘real world’, raising enthusiasm for science course.
Most of these will be and perhaps can be achieved only in the laboratories or in the laboratory related activities. It could be argued that laboratories might illustrate scientific method, help to learn different types of skills and improve understanding. They of course allow the students to see substances and effects, and can encourage students – students and students – staff interactions (Pickering, 1987).
To date, discussion about student learning in physics been largely student – and content- centered in all levels (McDermott and Redish 1999; Redish 2003). A common goal of these efforts is to design activities that promote conceptual change in the students who fail in traditional forms of instruction. According to Rothman (1972), Physics is a complex structure of concepts, hypotheses, theories and observation that are interrelated in such away that it is often difficult to separate inferences based on theory from direct observation based primarily on laboratory experiments.
McDermott (1993) quoted by Americas’ laboratory report, 2005, contends that a growing body of research in Physics education indicates that a majority of students have difficulty in learning basic physical concepts in a course built around traditional lectures, textbook problems and verification experiments. The practical work in Physics, even at school stage is essential because of the fact that we learn by doing.
Hake (1998) quoted by Wegener, (2000), stated that a number of studies have probed students’ outcomes from Physics courses and have questioned effectiveness of traditional teaching methods in this area. The ‘traditional’ teaching sequence typically consists of transmission of information in passive – student lectures, algorithmic exercises in written assessment and definitively guided laboratory work. Rief and St. John (1979), quoted by Wessel, (2004), stated that the students in traditional Physics courses have difficulties in satisfactorily acquiring skills like measurement and graphing uncertainty analysis, widely used by physicists.
According to Shami (1999), the major processes of science include observation, measurement, classification, recording, problem solving, concluding experiments and investigations, collection and interpretation of information, analyzing, and formulation of generalization, application, communication and manual operation.
Methodology
This study was aimed to explore skills learning in Physics laboratory. The major focus of the study was to evaluate the students’ performance in practical skills at secondary level. The long - term aims of the study were to help the students in learning the practical skills and also to help the science educational planners while developing the practical course. The sample included 80 students selected randomly, which was 29% of the whole population of the five urban female secondary schools at District Abbotabad. The data was collected through a teacher made criterion reference test. The test aimed to measure the mastery level of students in practical skills. (The criteria for the mastery of the skills were determined to be 80% according to the opinion of the experts.) The validity of the test was checked by a team of experts (teachers) who taught Physic and minor amendments were incorporated on the basis of their suggestions. Test-retest reliability was checked by administering the test on a group of ten students, with interval of two weeks between each test.
The data was collected from five girls secondary schools of urban area:
The discussions with the practicing secondary teachers of Physics were held. It was related that presently the most frequently used/ needed skills in Physics experiments included the following skills:
• Measurement skills
• Graph Drawing skills
• Graph Interpreting skills
On the bases of this information gleaned from teachers of physics, it was decided to check students’ competency in these skills.
Description of the Skills
i. Measurement skills in Physics
Christian and Crossley (1993) have explained that, measurement of physical quantities with appropriate accuracy is very basic skill in Physics and is important for the scientists as well as for the layman. This skill requires a high degree of accuracy in experiments because these measurements provide data for interpretation and analysis. Therefore, the students need to competency in the measurement skill, for making decisions about the measuring instrument and scale needed in reading the scale to smallest celebrated unit, avoiding internal and external errors. They should also be competent in eliminating the degree of uncertainty in instrument by making proper use of significant figures.
ii. Skills in drawing graphs
According to Christain and Crossley (1993), and Hussain, Shah and Qureshi (1975), a student should be expert in recognizing dependent and independent variables, making proper scale for plotting different sets of relative values of independent and independent variables and drawing graph by joining the points lying close to line or curve.
iii. Skills in interpreting the graph
If graphs are to be a valuable tool for students, then we must know the level of the students’ graphing ability. The students have identified difficulties with such graphing abilities. The students have difficulties in making connections among graphs of different variables, physical concepts and the real world they often perceive graphs as just a picture, (Wegener, 2002).
Results
Measurement Skills
Table – 1
Score of Students in Measurement Skills Total No. of
Students (N) Mean Score (X) Standard Deviation (S.D.) Mode (M) Criterion Marks
80 32.6% 8.02% 31% 80%
As the mean score (X) of students in measurement skills were much lower than the criterion marks. This shows that students were weak in the measurement skills. The high value of standard deviation (S.D.) indicated worst performance of the students in measurement skills. The values of mode reveal that the performance of majority students was below than the standard.
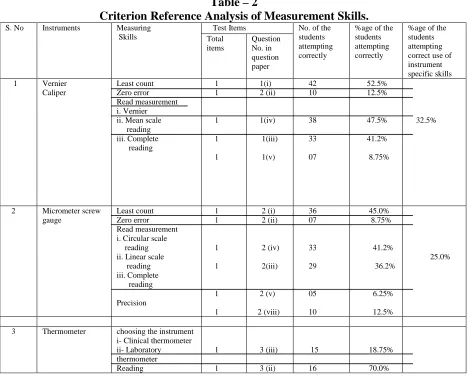
Table – 2
Criterion Reference Analysis of Measurement Skills.
S. No Instruments Measuring
Skills
Test Items No. of the
students attempting correctly
%age of the students attempting correctly
%age of the students attempting correct use of instrument specific skills Total items Question No. in question paper
1 Vernier
Caliper
Least count Zero error Read measurement i. Vernier ii. Mean scale reading iii. Complete reading 1 1 1 1 1 1(i) 2 (ii) 1(iv) 1(iii) 1(v) 42 10 38 33 07 52.5% 12.5% 47.5% 41.2% 8.75% 32.5%
2 Micrometer screw
gauge
Least count Zero error Read measurement i. Circular scale reading ii. Linear scale reading iii. Complete reading Precision 1 1 1 1 1 1 2 (i) 2 (ii) 2 (iv) 2(iii) 2 (v) 2 (viii) 36 07 33 29 05 10 45.0% 8.75% 41.2% 36.2% 6.25% 12.5% 25.0%
3 Thermometer choosing the instrument
i- Melting point ii-Freezing point. 1 1 3 (v) 3 (iv) 40 45 50.0% 56.2% 36.2% 4 5 Graduated cylinder Physical balance
Measuring level of i- Coloured liquid ii- Colourless liquid.
Proper use of physical balance. 1 1 1 3 (iv) 3 (vii) 3 (i) 15 18 10 18.75% 22.5% 12.5% 20.62% 12.5%
Table 2 indicates that 36.2% students correctly knew the use of thermometer. 32.5% were aware of the use of vernier caliper 25% knew the use of micrometer screw gauge, 12.5% had learn use of physical balance and only 20.62% knew the use of graduated cylinder. The data shows that very few students have the ability to use the measuring instruments.
Graph drawing skill
Table – 3
Score of Students in Graph Drawing Skills Total No. of
Students (N) Mean Score (X) Standard Deviation (S.D.) Mode (M) Criterion Marks
80 20.5% 7.5% 19.6% 80%
Table 3 indicates that the mean score of the students in graph drawing skills were 20.5%, which were much lower than the criterion marks. This shows that students were weak in graph drawing skill. Standard deviation value 7.5% indicates worst performance of the students. Mode score 19.6% also reveals that the performances of the majority students were below from the criterion marks.
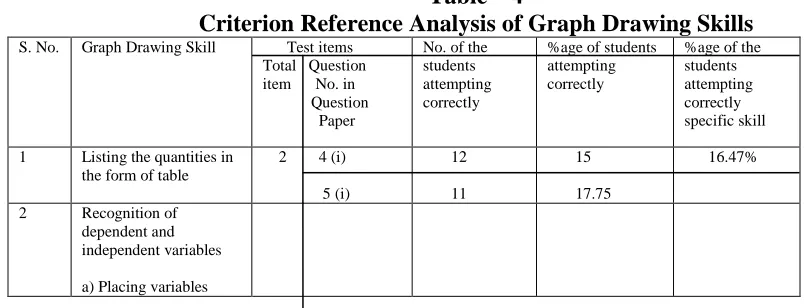
Table – 4
Criterion Reference Analysis of Graph Drawing Skills S. No. Graph Drawing Skill Test items
Total Question item No. in Question Paper
No. of the students attempting correctly
%age of students attempting correctly
%age of the students attempting correctly specific skill
1 Listing the quantities in the form of table
2 4 (i) 5 (i) 12 11 15 17.75 16.47%
2 Recognition of
dependent and independent variables
along x-axis
b) Placing variable along y-axis
2 4 (ii) 5 (ii)
2 4 (iii) 5 (v) 17 18 15 17 21.25 22.50 18.75 21.75 20.90%
3 Taking proper scale
a) Along x-axis b) Along y-axis
2 4 (iv) 2 5 (vi)
12 13
15.00 17.00
16.7%
4 Joining the plotted point
and drawing graph 2 4(v) 5 (v) 07 08 08.75 10.00 09.37%
5 Plotting different sets of variable
2 4(vi) 5 (vi)
05 07
06.25
08.75 07.50%
Table 4 indicates as only 20.9% students had concept of dependent and independent variables. 16.7% students knew about taking proper scale along x-axis and y-axis. 16.4% list the variable in the form of table, 9.37% properly join the points and put different sets of variables. All these results show very disappointing condition of students in graph drawing skills as a whole.
Graph Interpreting Skills
Table – 5
Score of Students in Graph Interpreting Skills Total No. of
students
Mean (X) Standard
Deviation (S.D.)
Mode Criterion
Marks
80 15.5% 5.5% 14.6% 80%
Table 5 reveales that the mean score of students in graph interpreting skills was 15.5% that score is much mo re lower than the criterion marks. Its mean that students were much weak in graph interpreting skills. The value of mode 14.6% also shows that the performances of majority students were very much below the standard.
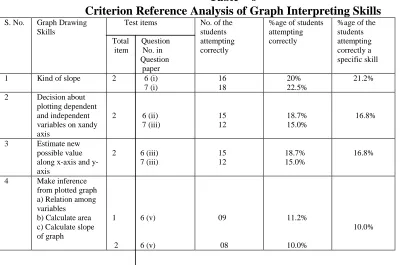
Table – 6
Criterion Reference Analysis of Graph Interpreting Skills S. No. Graph Drawing
Skills
Test items
Total Question item No. in Question paper
No. of the students attempting correctly
%age of students attempting correctly
%age of the students attempting correctly a specific skill
1 Kind of slope 2 6 (i) 7 (i) 16 18 20% 22.5% 21.2%
2 Decision about
plotting dependent and independent variables on xandy axis
2 6 (ii) 7 (iii) 15 12 18.7% 15.0% 16.8%
3 Estimate new
possible value along x-axis and y-axis
2 6 (iii) 7 (iii) 15 12 18.7% 15.0% 16.8%
4 Make inference
from plotted graph a) Relation among variables b) Calculate area c) Calculate slope of graph
1 6 (v)
2 6 (v)
09
08
11.2%
10.0%
7 (vi) 1 6 (vi)
08
07 10.0% 8.8%
Table 6 reflects that 16.8% students correctly attempted questions related to decision about dependent and independent variables. 21.2% students aware about the kinds of slope. 10% make inference from potted graph.
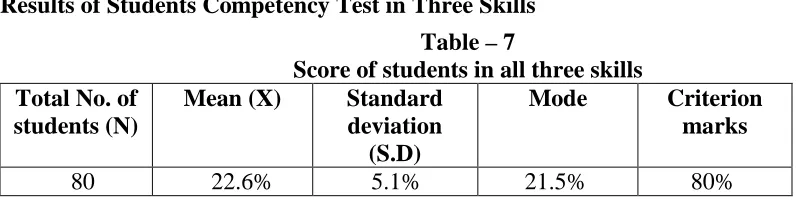
Results of Students Competency Test in Three Skills Table – 7
Score of students in all three skills Total No. of
students (N)
Mean (X) Standard
deviation (S.D)
Mode Criterion
marks
80 22.6% 5.1% 21.5% 80%
Table 7 shows that the mean score of the students in all three skills is 22.6%, which is much lower than the criterion marks. The value of mode is 21.5%, which indicate that the performance of majority of the students were much below than the standard.
Conclusions
It was stated that the laboratory is a place where a learner may experiment, applying skills and knowledge to gain understanding. This study has aimed at exploring the competency in laboratory skills learning of the secondary school level students. Looking at the pattern of overall results, the following general conclusions can be drawn.
a) Only eight percent student achieved the mastery level in Physics practical.
b) The performance of students in measurement skills was comparatively better than other two skills i.e. graph drawing and graph interpreting.
c) The performance of students in graph interpreting skills was most poor of all the two skills, i.e. graph drawing and measurement skills.
Recommendations
On the basis of finding and conclusions of this study, following recommendations are made:
a) The first and most important issue is to clarify the aims and objectives of the practical work or laboratory work at secondary school level. It could be argued that all the students need to know the basic methods used in the measurement skills, graph drawing skills and graph interpreting skills. Understanding these skills are important and being able to carry out is more important.
b) The second recommendation derives from this, to see what is taught in the classroom? Planned properly these practical skills and integrated with the theory of the subject matter. There are opportunities to allow students to see a science in action. Students have opportunities to experience this.
the aim. Formative evaluation practical skills may be included in assessment and evaluation.
d) More research may be conducted to investigate the problems related to laboratory work and development of practical / science skills among the students.
e) The potential for laboratory work is simply enormous. It need more clear guidelines to achieve exciting outcomes. I do need careful use of all aspects of assessment. Together, these can offer the next generation of students a much more enriching experiences.
REFERENCES
America’s Laboratory Report (2005). Investigation in high school science Retrieved from http://www.nap.edu/books/0309096715/html.
Arons A B (1990). A Guide to Introductory Physics Teaching Wiley.
Black, P. J. and Ogborn, J., (1979). Laboratory work in undergraduate teaching, in McNally D. (ed.) Learning strategies in university science, Cardiff University College, Cardiff Press
Canduff, J. and Reid, N., (2003). Enhancing undergraduate chemistry laboratories, Pre-laboratory and post-Pre-laboratory exercises-examples and advice, Education Department, Royal Society of Chemistry, Burlington House, Piccadilly, London, WIJ 0BA.
Christian, D. and Crossley, W., (1993). Study mate: HSC Physics – Core, McGraw Hill Book Company, Australia, 1-7 (204).
Coelho, S. M. and Sere, M G (1998). Pupils’ reasoning and practice during hands-on activities in the measurement phase, Research in Science and Technological Education, Vol. 16 (1), 79-97.
Gage, R. M (1963). Learning requirements for enquiry, Journal of Research in Science Teaching, Vol. 1, 144-153.
Hake, R. R., (1998). Socrate pedagogy in the introductory Physics lab, Physics Teacher, 30, 546.
Hussain, A., Qutub-Ud-Din, Shah, I.H. and Qureshi, M. T., (1975). Laboratory Manual, National Educational Equipment Center, Wahdat Colony Lahore, Pakistan, 13.
Kline, H. A., (1998). The Science measurement a historical survey, Dover Publications Inc. New York.
Lubben, F. and Millar, R., (1996). Children ideas about the reliability of experimental data, International Journal of Science Education, Vol. 18 (8), 955-968.
Pickering, M., (1982). Are laboratory course a waste of time? The Chronicle og Higher Education, 19, 80
Rao, M. (1993). Teaching of Physics, Annual Publication, New Delhi, India, 70.
Rief and St. John (1979). Teaching Physics, ‘thinking skills in the laboratory’, American Journal of Physics, Vol. 47, 950-937.
Rothman, M., (1972). Discovering Natural Laws: The Experimental basis of Physics, Doubledy, New York, 8.
Shami, P. A., (1999). Synthesis of Science Teaching, Inter Board Committee, Secondary Education, Ministry of Education, Islamabad, Pakistan, 19-23.
Shymansky J A and Penick J E (1979). Use of systematic observations to improve college science laboratory instruction, Science Education, 63(2), pp 195-203.
Wegenger M (2002). Fundamental skills in Physics Embeded Learning Retrieved from, htt://www.tedi.uq.edu.au/conferce.do/papers/ wehener.html
Wessel W (2004). Knowledge construction in high school Physics: A study of Student Teacher
Interaction, SSTA Research Center Report, Retrieved from,