NSW PUBLIC HEALTH
BULLETIN
Year in Review 2008
Vol. 20(9–10) • September–October 2009 ISSN 1034 7674
Year in review: communicable disease
surveillance, NSW, 2008
Communicable Diseases Branch,
NSW Department of Health
w w w. p u b l i s h . c s i r o. a u / j o u r n a l s / p h b CONTENTS – See back page
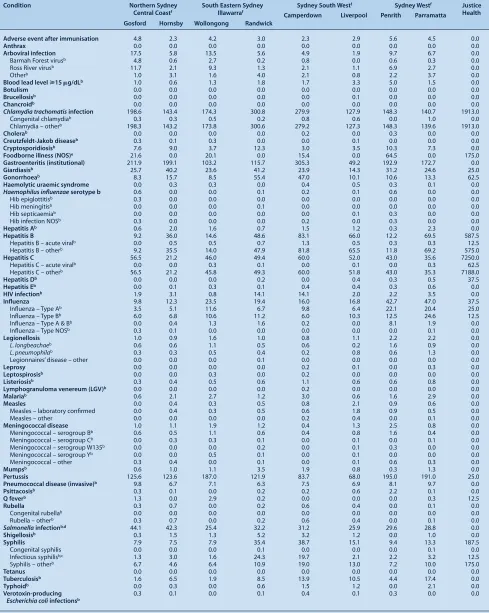
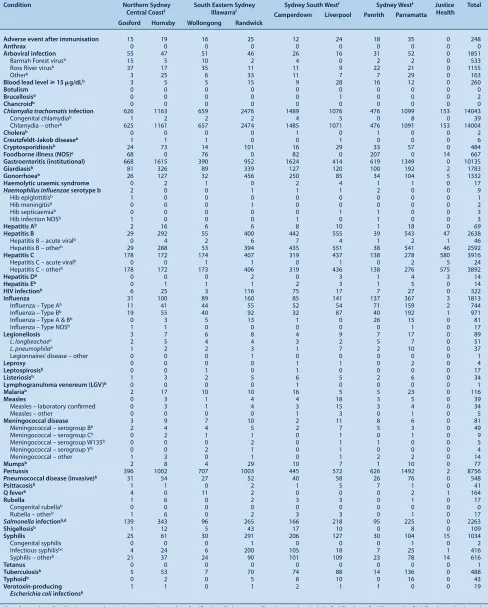
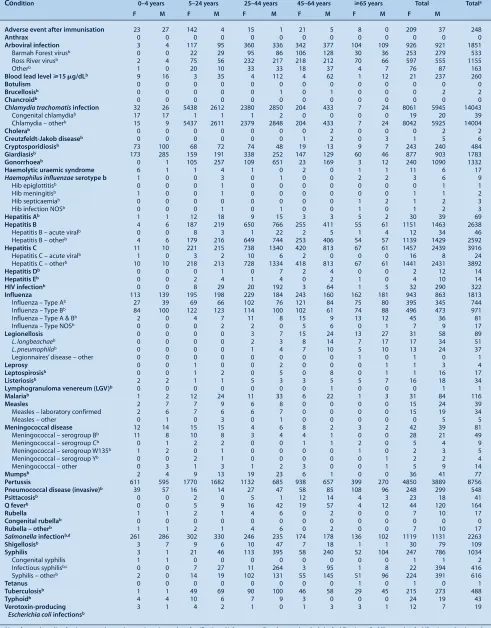
In this issue, we present our annual review of notifiable diseases reported in New South Wales (NSW) residents. For greater depth of detail, refer to Tables 2–6, which show disease-specific data reported by: year of onset; month of onset; area health service (AHS); and age group and sex.
Trends
Among the 53 573 notifications of medical conditions by doctors, hospital staff and laboratory staff in NSW residents in 2008, highlights included:
Conditions most frequently reported
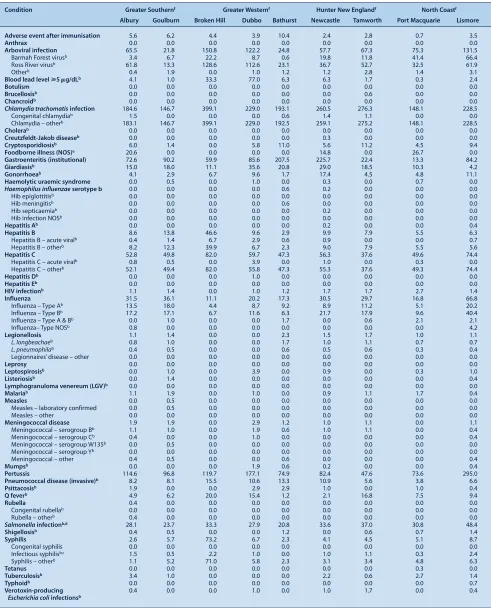
• Chlamydia: 14 043 cases (201 per 100 000 population), with the highest crude rates by geographical area in the Greater Western (Broken Hill region), South Eastern Sydney Illawarra (Randwick region), Sydney South West (Camperdown region) and Hunter New England (Tamworth region) AHSs.
• Pertussis: 8756 cases (126 per 100 000 population), with the highest crude rates in the North Coast
(Lismore region), Sydney West (Penrith and Parramatta regions), South Eastern Sydney Illawarra (Wollongong region) and Greater Western (Dubbo region) AHSs. • Hepatitis C: 3916 cases (56 per 100 000 population),
with the highest crude rates in the Greater Western (Broken Hill and Dubbo regions), North Coast (Lismore region) and Sydney South West (Camperdown region) AHSs.
• Hepatitis B: 2638 cases (38 per 100 000 population) with the highest crude rates in the Sydney South West (Camperdown and Liverpool regions) and Sydney West (Parramatta region) AHSs.
• Salmonella infection: 2263 cases (32 per 100 000 population) with the highest crude rates in the
North Coast (Lismore region) and Northern Sydney Central Coast (Gosford and Hornsby regions) AHSs.
Conditions with the most meaningful declines in the number of notifications compared with previous years • Hepatitis A: cases have more than halved in number
since 2002 (69 cases in 2008 compared with 149 in 2002 and 421 in 1999). This may be due in part to the introduction of a commercial vaccine in the 1990s. Travel to countries where Hepatitis A is endemic was the most commonly reported risk factor for disease acquisition in 2008.
• Hepatitis C: cases have decreased by over 50% in number in the last 10 years (3916 cases in 2008 compared with 8598 cases in 1999). The cause of this decline is unclear. It may reflect a real decrease in transmission related to prevention programs, or it may reflect a decrease in hepatitis C testing.
• Meningococcal serogroup C disease: notifications continue to decline (nine cases reported for 2008), largely due to the introduction of meningococcal C vaccination in late 2003.
• Meningococcal serogroup B disease: notifications have decreased steadily over the past few years. In 2008, there were 49 cases reported, compared with 103 in 2002. The reason for this decrease is unclear. • Rubella: notifications have decreased from 191 cases in
2000 to 17 cases in 2008. This may be due to higher rates of immunisation over the past decade.
Conditions with the most meaningful increases in the number of notifications compared with previous years • Pertussis has shown the greatest increase in the number
142 | Vol. 20(9–10) 2009 NSW Public Health Bulletin
with past cyclical fluctuations in Ross River virus activity.
• The number of Salmonella infections showed a small decline compared with the previous year (2263 in 2008 compared with 2555 in 2007), but numbers remain high compared with the 10-year average. • The number of verotoxigenic Escherichia coli
infections remained higher than usual, with 17 cases reported in 2008, compared with an average of four cases per year for the 10-year period prior to 2007. All cases were investigated and no epidemiological links were identified.
• The number of cases of infectious syphilis remained at comparatively high levels in 2008, reflecting an outbreak among men who have sex with men residing in inner-Sydney.
Conditions least frequently reported
There were no reported cases of anthrax, avian influenza, botulism, chancroid, diphtheria, lyssavirus, plague, polio, severe acute respiratory syndrome (SARS), smallpox, typhus, viral haemorrhagic fever or yellow fever in NSW in 2008. One case of tetanus was reported.
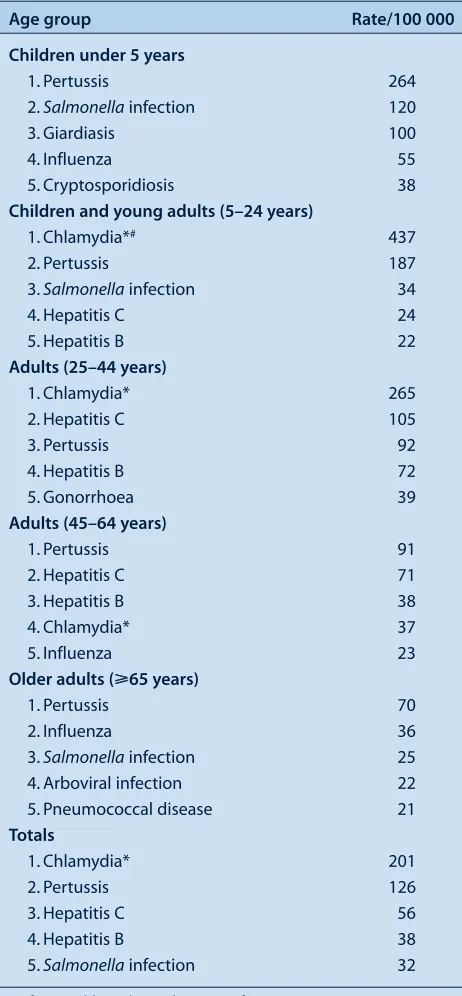
Top five notifiable diseases
Rates for the most commonly reported notifiable diseases for each age group and geographical area of residence at the time of notification are presented in Figure 1 and Table 1. These lists indicate the relative importance of notifiable diseases only and should not be used to indicate the spread of all infectious diseases in NSW. It should also be noted that these rates are heavily influenced by testing practices and, in many instances, do not necessarily indi-cate the true or relative incidence in the community. Finally, these lists do not include institutional gastro -intestinal outbreaks because comprehensive demographic data are not collected for such outbreaks.
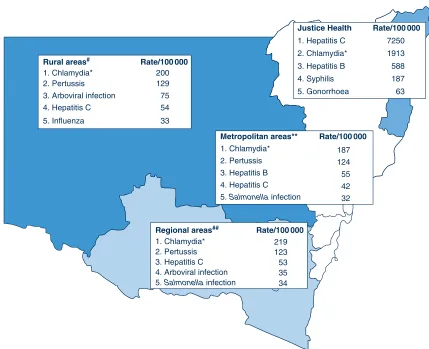
Geographical distribution of notifiable diseases • Chlamydia trachomatis infection was the most
commonly reported infection across NSW, with the highest rates observed in rural areas, followed by regional and metropolitan areas.
• The rate of pertussis infections was highest in rural areas, particularly in northern NSW, followed by metropolitan and regional areas.
• Rates of hepatitis C infection were comparable across rural, regional and metropolitan areas. Most of these cases represent chronic infection rather than acute hepatitis C acquisition and as such may not accurately reflect the recent spread of hepatitis C in the
community.
• Arboviral infections were more commonly reported in people residing in rural and regional areas than in metropolitan areas.
• Tuberculosis was most frequently reported in metropolitan areas, and was rare in rural regions.
Table 1. The five most commonly reported notifiable diseases by age group, NSW, 2008
Age group Rate/100 000
Children under 5 years
1. Pertussis 264
2. Salmonellainfection 120
3. Giardiasis 100
4. Influenza 55
5. Cryptosporidiosis 38
Children and young adults (5–24 years)
1. Chlamydia*# 437
2. Pertussis 187
3. Salmonellainfection 34
4. Hepatitis C 24
5. Hepatitis B 22
Adults (25–44 years)
1. Chlamydia* 265
2. Hepatitis C 105
3. Pertussis 92
4. Hepatitis B 72
5. Gonorrhoea 39
Adults (45–64 years)
1. Pertussis 91
2. Hepatitis C 71
3. Hepatitis B 38
4. Chlamydia* 37
5. Influenza 23
Older adults (⭓65 years)
1. Pertussis 70
2. Influenza 36
3. Salmonellainfection 25
4. Arboviral infection 22
5. Pneumococcal disease 21
Totals
1. Chlamydia* 201
2. Pertussis 126
3. Hepatitis C 56
4. Hepatitis B 38
5. Salmonellainfection 32
*refers to Chlamydia trachomatisinfections.
#where a case is reported in a child under 16 years of age, the rele-vant public health unit contacts the treating doctor outlining his/her obligation to notify the Department of Community Services. Source: NSW Notifiable Diseases Database.
this reflects a large, statewide outbreak that continues in 2009, as well as improved diagnostic technology. • Chlamydia has been reported at the highest rate since
it became a notifiable disease in 1998 (14 043 cases in 2008), reflecting a long-standing trend of increases in notifications of this disease.
Year in review
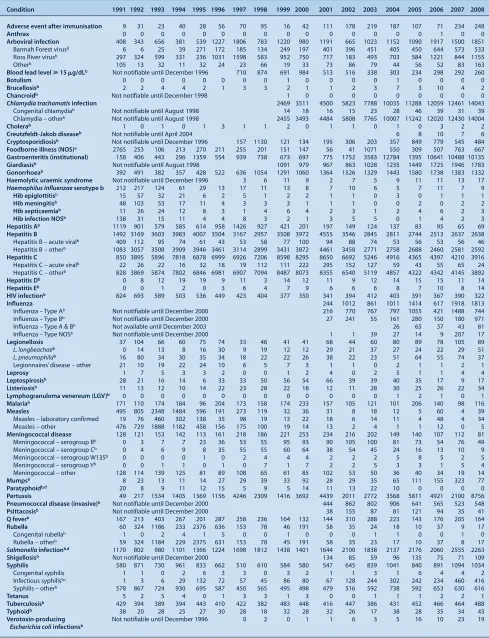
Table 2. Disease notifications by year of onset of illnessa, NSW, 1991–2008
Condition 1991 1992 1993 1994 1995 1996 1997 1998 1999 2000 2001 2002 2003 2004 2005 2006 2007 2008 Adverse event after immunisation 9 31 23 40 28 56 70 95 16 42 111 178 219 187 107 71 234 248
Anthrax 0 0 0 0 0 0 0 0 0 0 0 0 0 0 0 1 0 0
Arboviral infection 408 343 656 381 539 1227 1806 783 1220 980 1191 665 1023 1152 1090 1917 1500 1851 Barmah Forest virusb 6 6 25 39 271 172 185 134 249 197 401 396 451 405 450 644 573 533
Ross River virusb 297 324 599 331 236 1031 1598 583 952 750 717 183 493 703 584 1221 844 1155
Otherb 105 13 32 11 32 24 23 66 19 33 73 86 79 44 56 52 83 163
Blood lead level⭓15g/dLb Not notifiable until December 1996 710 874 691 984 513 516 338 303 234 298 292 260
Botulism 0 0 0 0 0 0 0 0 1 0 0 0 0 1 0 0 0 0
Brucellosisb 2 2 4 4 2 1 3 3 2 1 1 2 3 7 3 10 4 2
Chancroidb Not notifiable until December 1998 1 0 0 0 0 0 0 0 0 0
Chlamydia trachomatisinfection 2469 3511 4500 5823 7788 10035 11288 12059 12461 14043
Congenital chlamydiab Not notifiable until August 1998 14 18 16 15 23 28 46 39 31 39
Chlamydia – otherb Not notifiable until August 1998 2455 3493 4484 5808 7765 10007 11242 12020 12430 14004
Cholerab 1 0 1 0 1 3 1 1 2 0 1 1 0 1 0 3 2 2
Creutzfeldt-Jakob diseaseb Not notifiable until April 2004 6 8 10 7 6
Cryptosporidiosisb Not notifiable until December 1996 157 1130 121 134 195 306 203 357 849 779 545 484
Foodborne illness (NOS)e 2765 253 106 213 270 211 255 201 151 147 56 41 1071 550 309 507 763 667
Gastroenteritis (institutional) 158 406 443 296 1359 554 939 738 673 697 775 1752 3583 12784 1395 10641 10488 10135
Giardiasisb Not notifiable until August 1998 1091 979 967 863 1028 1235 1449 1725 1946 1783
Gonorrhoeab 392 491 382 357 428 522 636 1054 1291 1060 1364 1526 1329 1443 1580 1738 1383 1332
Haemolytic uraemic syndrome Not notifiable until December 1996 3 6 11 9 2 7 5 9 11 11 13 17
Haemophilus influenzaeserotype b 212 217 124 61 29 13 17 11 13 8 7 10 6 5 7 11 7 9
Hib epiglottitisb 15 57 32 21 6 2 5 1 2 2 1 1 0 3 0 1 1 1
Hib meningitisb 48 103 53 17 11 4 3 3 3 1 1 1 0 0 2 0 2 2
Hib septicaemiab 11 26 24 12 8 3 1 4 6 4 2 3 1 2 4 6 2 3
Hib infection NOSb 138 31 15 11 4 4 8 3 2 1 3 5 5 0 1 4 2 3
Hepatitis Ab 1119 901 579 585 614 958 1426 927 421 201 197 149 124 137 83 95 65 69
Hepatitis B 1492 3169 3603 3983 4007 3504 3167 2957 3508 3972 4555 3546 2845 2811 2744 2513 2637 2638 Hepatitis B – acute viralb 409 112 95 74 61 43 53 58 77 100 94 88 74 53 56 53 56 46
Hepatitis B – otherb 1083 3057 3508 3909 3946 3461 3114 2899 3431 3872 4461 3458 2771 2758 2688 2460 2581 2592
Hepatitis C 850 3895 5896 7818 6878 6999 6926 7206 8598 8295 8650 6692 5246 4916 4365 4397 4210 3916 Hepatitis C – acute viralb 22 26 22 16 32 18 19 112 111 222 295 152 127 59 43 55 65 24
Hepatitis C – otherb 828 3869 5874 7802 6846 6981 6907 7094 8487 8073 8355 6540 5119 4857 4322 4342 4145 3892
Hepatitis Db 0 8 12 19 19 9 11 3 14 12 11 9 12 14 15 15 11 14
Hepatitis Eb 0 0 1 2 0 3 6 4 7 9 6 6 6 8 7 10 8 14
HIV infectionb 824 693 589 503 536 449 423 404 377 350 341 394 412 403 391 367 390 322
Influenza 244 1012 861 1011 1414 617 1918 1813 Influenza – Type Ab Not notifiable until December 2000 216 770 767 797 1055 421 1488 744
Influenza – Type Bb Not notifiable until December 2000 27 241 55 161 280 150 180 971
Influenza – Type A & Bb Not available until December 2003 26 65 37 43 81
Influenza – Type NOSb Not notifiable until December 2000 1 1 39 27 14 9 207 17
Legionellosis 37 104 66 60 75 74 33 46 41 41 68 44 60 80 89 78 105 89
L. longbeachaeb 0 14 13 8 16 30 9 19 12 12 29 21 37 27 24 22 29 51
L. pneumophilab 16 80 34 30 35 34 18 22 22 26 38 22 23 51 64 55 74 37
Legionnaires’ disease – other 21 10 19 22 24 10 6 5 7 3 1 1 0 2 1 1 2 1
Leprosy 1 7 5 3 3 2 0 0 1 2 4 0 2 5 1 1 4 4
Leptospirosisb 28 21 16 14 6 33 33 50 56 54 66 39 39 40 35 17 9 17
Listeriosisb 11 13 12 10 14 22 23 28 22 18 12 11 28 30 25 26 22 34
Lymphogranuloma venereum (LGV)b 0 0 0 0 0 0 0 0 0 0 0 0 0 1 2 1 0 1
Malariab 171 110 174 184 96 204 173 158 174 233 157 105 121 101 206 140 98 116
Measles 495 805 2348 1484 596 191 273 119 32 36 31 8 18 12 5 60 4 39 Measles – laboratory confirmed 19 76 460 302 138 35 98 19 13 22 18 6 14 11 4 48 4 34
Measles – other 476 729 1888 1182 458 156 175 100 19 14 13 2 4 1 1 12 0 5
Meningococcal disease 128 121 153 142 113 161 218 186 221 253 234 216 202 149 140 107 112 81
Meningococcal – serogroup Bb 0 3 7 7 23 36 53 55 95 93 90 105 100 81 73 54 76 49
Meningococcal – serogroup Cb 0 4 6 9 8 35 55 55 60 64 38 54 45 24 16 13 10 9
Meningococcal – serogroup W135b 0 0 0 0 1 0 2 4 4 4 2 2 2 5 8 5 2 5
Meningococcal – serogroup Yb 0 0 1 1 0 1 0 7 1 7 2 2 5 3 3 1 5 4
Meningococcal – other 128 114 139 125 81 89 108 65 61 85 102 53 50 36 40 34 19 14
Mumpsb 8 23 13 11 14 27 29 39 33 92 28 29 35 65 111 155 323 77
Paratyphoidb,d 20 8 9 11 12 15 5 9 5 14 11 13 22 10 0 0 0 0
Pertussis 49 217 1534 1405 1369 1156 4246 2309 1416 3692 4439 2011 2772 3568 5811 4921 2100 8756
Pneumococcal disease (invasive)b Not notifiable until December 2000 444 862 802 906 641 565 523 548
Psittacosisb Not notifiable until December 2000 38 155 87 81 121 94 35 41
Q feverb 167 213 403 267 201 287 258 236 164 132 144 310 288 223 143 176 205 164
Rubella 60 324 1186 233 2376 636 153 78 46 191 58 35 24 18 10 37 9 17
Congenital rubellab 1 0 2 4 1 5 0 0 1 0 0 0 1 1 0 0 1 0
Rubella – otherb 59 324 1184 229 2375 631 153 78 45 191 58 35 23 17 10 37 8 17
Salmonellainfectionb,d 1170 802 980 1101 1366 1224 1698 1812 1438 1401 1644 2100 1838 2137 2176 2060 2555 2263
Shigellosisb Not notifiable until December 2000 134 85 59 96 135 75 71 109
Syphilis 580 871 730 961 833 662 510 610 584 580 547 645 839 1041 840 891 1094 1034
Congenital syphilis 1 1 0 2 6 3 3 0 3 2 1 1 3 1 6 4 4 2
Infectious syphilisb,c 1 3 6 29 132 72 57 45 86 80 67 128 244 302 242 234 460 416
Syphilis – otherb 578 867 724 930 695 587 450 565 495 498 479 516 592 738 592 653 630 616
Tetanus 5 2 5 4 0 1 3 3 1 3 0 0 1 1 1 2 2 1
Tuberculosisb 429 394 389 394 443 410 422 382 483 448 416 447 386 431 452 466 464 488
Typhoidb 38 20 28 25 27 30 28 18 32 28 32 26 17 38 28 35 34 43
Verotoxin-producing Not notifiable until December 1996 0 2 0 1 1 6 3 5 16 10 23 19
Escherichia coliinfectionsb
aYear of onset: the earlier of patient reported onset date, specimen date or date of notification. bLaboratory-confirmed cases only. cIncludes Syphilis primary, Syphilis secondary, Syphilis ⬍1-year duration and
Syphilis newly acquired. dFrom 2005, all paratyphoid recorded as salmonellosis. eFoodborne illness cases are only those notified as part of an outbreak. NOS: not otherwise specified. No case of the
144 | Vol. 20(9–10) 2009 NSW Public Health Bulletin
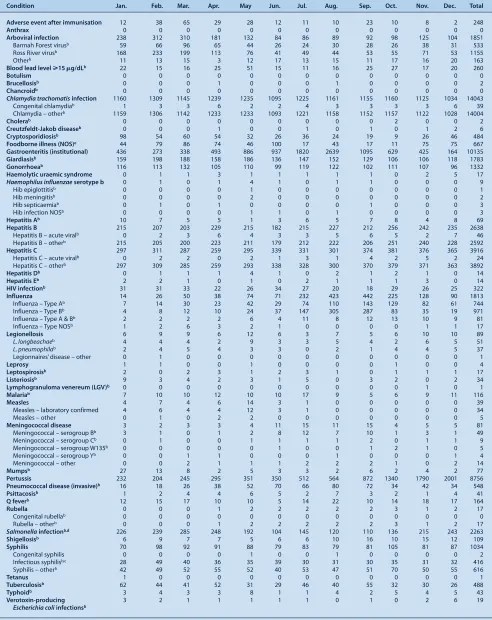
Table 3. Disease notifications by month of onset of illnessa, NSW, 2008
Condition Jan. Feb. Mar. Apr. May Jun. Jul. Aug. Sep. Oct. Nov. Dec. Total Adverse event after immunisation 12 38 65 29 28 12 11 10 23 10 8 2 248
Anthrax 0 0 0 0 0 0 0 0 0 0 0 0 0
Arboviral infection 238 312 310 181 132 84 86 89 92 98 125 104 1851
Barmah Forest virusb 59 66 96 65 44 26 24 30 28 26 38 31 533
Ross River virusb 168 233 199 113 76 41 49 44 53 55 71 53 1155
Otherb 11 13 15 3 12 17 13 15 11 17 16 20 163
Blood lead level⭓15g/dLb 22 15 16 25 51 15 11 16 25 27 17 20 260
Botulism 0 0 0 0 0 0 0 0 0 0 0 0 0
Brucellosisb 0 0 0 1 0 0 0 1 0 0 0 0 2
Chancroidb 0 0 0 0 0 0 0 0 0 0 0 0 0
Chlamydia trachomatisinfection 1160 1309 1145 1239 1235 1095 1225 1161 1155 1160 1125 1034 14043
Congenital chlamydiab 1 3 3 6 2 2 4 3 3 3 3 6 39
Chlamydia – otherb 1159 1306 1142 1233 1233 1093 1221 1158 1152 1157 1122 1028 14004
Cholerab 0 0 0 0 0 0 0 0 0 2 0 0 2
Creutzfeldt-Jakob diseaseb 0 0 0 1 0 0 1 0 1 0 1 2 6
Cryptosporidiosisb 98 54 60 54 32 26 36 24 19 9 26 46 484
Foodborne illness (NOS)e 44 79 86 74 46 100 17 43 17 11 75 75 667
Gastroenteritis (institutional) 436 273 338 493 886 937 1820 2639 1095 629 425 164 10135
Giardiasisb 159 198 188 158 186 136 147 152 129 106 106 118 1783
Gonorrhoeab 116 113 132 105 110 99 119 122 102 111 107 96 1332
Haemolytic uraemic syndrome 0 1 1 3 1 1 1 1 1 0 2 5 17
Haemophilus influenzaeserotype b 0 1 0 1 4 1 0 1 1 0 0 0 9
Hib epiglottitisb 0 0 0 0 1 0 0 0 0 0 0 0 1
Hib meningitisb 0 0 0 0 2 0 0 0 0 0 0 0 2
Hib septicaemiab 0 1 0 1 0 0 0 0 1 0 0 0 3
Hib infection NOSb 0 0 0 0 1 1 0 1 0 0 0 0 3
Hepatitis Ab 10 7 5 5 1 3 6 5 7 8 4 8 69
Hepatitis B 215 207 203 229 215 182 215 227 212 256 242 235 2638
Hepatitis B – acute viralb 0 2 3 6 4 3 3 5 6 5 2 7 46
Hepatitis B – otherb 215 205 200 223 211 179 212 222 206 251 240 228 2592
Hepatitis C 297 311 287 259 295 339 331 301 374 381 376 365 3916
Hepatitis C – acute viralb 0 2 2 0 2 1 3 1 4 2 5 2 24
Hepatitis C – otherb 297 309 285 259 293 338 328 300 370 379 371 363 3892
Hepatitis Db 0 1 1 1 4 1 0 2 1 2 1 0 14
Hepatitis Eb 2 2 1 0 1 0 2 1 1 1 3 0 14
HIV infectionb 31 31 33 22 26 34 27 20 18 29 26 25 322
Influenza 14 26 50 38 74 71 232 423 442 225 128 90 1813
Influenza – Type Ab 7 14 30 23 42 29 74 110 143 129 82 61 744
Influenza – Type Bb 4 8 12 10 24 37 147 305 287 83 35 19 971
Influenza – Type A & Bb 2 2 2 2 6 4 11 8 12 13 10 9 81
Influenza – Type NOSb 1 2 6 3 2 1 0 0 0 0 1 1 17
Legionellosis 6 9 9 6 12 6 3 7 5 6 10 10 89
L. longbeachaeb 4 4 4 2 9 3 3 5 4 2 6 5 51
L. pneumophilab 2 4 5 4 3 3 0 2 1 4 4 5 37
Legionnaires’ disease – other 0 1 0 0 0 0 0 0 0 0 0 0 1
Leprosy 1 1 0 0 1 0 0 0 0 1 0 0 4
Leptospirosisb 2 0 2 3 1 2 3 1 0 1 1 1 17
Listeriosisb 9 3 4 2 3 1 5 0 3 2 0 2 34
Lymphogranuloma venereum (LGV)b 0 0 0 0 0 0 0 0 0 0 1 0 1
Malariab 7 10 10 12 10 10 17 9 5 6 9 11 116
Measles 4 7 4 6 14 3 1 0 0 0 0 0 39
Measles – laboratory confirmed 4 6 4 4 12 3 1 0 0 0 0 0 34
Measles – other 0 1 0 2 2 0 0 0 0 0 0 0 5
Meningococcal disease 3 2 3 3 4 11 15 11 15 4 5 5 81
Meningococcal – serogroup Bb 3 1 0 1 2 8 12 7 10 1 3 1 49
Meningococcal – serogroup Cb 0 1 0 0 1 1 1 1 2 0 1 1 9
Meningococcal – serogroup W135b 0 0 0 0 0 1 0 0 1 2 1 0 5
Meningococcal – serogroup Yb 0 0 1 1 0 0 0 1 0 0 0 1 4
Meningococcal – other 0 0 2 1 1 1 2 2 2 1 0 2 14
Mumpsb 27 13 8 2 5 3 3 2 6 2 4 2 77
Pertussis 232 204 245 295 351 350 512 564 872 1340 1790 2001 8756
Pneumococcal disease (invasive)b 16 18 26 38 52 70 66 80 72 34 42 34 548
Psittacosisb 1 2 4 4 6 5 2 7 3 2 1 4 41
Q feverb 12 15 17 10 10 5 14 22 10 14 18 17 164
Rubella 0 0 0 1 2 2 2 2 2 3 1 2 17
Congenital rubellab 0 0 0 0 0 0 0 0 0 0 0 0 0
Rubella – otherb 0 0 0 1 2 2 2 2 2 3 1 2 17
Salmonellainfectionb,d 226 239 285 248 192 104 145 120 110 136 215 243 2263
Shigellosisb 6 9 7 7 5 6 6 10 16 10 15 12 109
Syphilis 70 98 92 91 88 79 83 79 81 105 81 87 1034
Congenital syphilis 0 0 0 0 1 0 0 1 0 0 0 0 2
Infectious syphilisb,c 28 49 40 36 35 39 30 31 30 35 31 32 416
Syphilis – otherb 42 49 52 55 52 40 53 47 51 70 50 55 616
Tetanus 1 0 0 0 0 0 0 0 0 0 0 0 1
Tuberculosisb 62 44 41 52 31 29 46 40 55 32 30 26 488
Typhoidb 3 4 3 3 8 1 1 4 2 5 4 5 43
Verotoxin-producing 3 2 1 1 1 1 1 0 1 0 2 6 19
Escherichia coliinfectionsb
aYear of onset: the earlier of patient reported onset date, specimen date or date of notification. bLaboratory-confirmed cases only. cIncludes Syphilis primary, Syphilis secondary, Syphilis ⬍1-year duration and
Syphilis newly acquired. dIncludes all paratyphoid cases. eFoodborne illness cases are only those notified as part of an outbreak. NOS: not otherwise specified. No case of the following diseases have been
Year in review
Table 4. Disease notifications by area health service of residence (including breakdown by 2005 AHS boundaries), crude rates per 100 000 population, NSW, 2008
Condition Greater Southernf Greater Westernf Hunter New Englandf North Coastf
Albury Goulburn Broken Hill Dubbo Bathurst Newcastle Tamworth Port Macquarie Lismore Adverse event after immunisation 5.6 6.2 4.4 3.9 10.4 2.4 2.8 0.7 3.5
Anthrax 0.0 0.0 0.0 0.0 0.0 0.0 0.0 0.0 0.0
Arboviral infection 65.5 21.8 150.8 122.2 24.8 57.7 67.3 75.3 131.5
Barmah Forest virusb 3.4 6.7 22.2 8.7 0.6 19.8 11.8 41.4 66.4
Ross River virusb 61.8 13.3 128.6 112.6 23.1 36.7 52.7 32.5 61.9
Otherb 0.4 1.9 0.0 1.0 1.2 1.2 2.8 1.4 3.1
Blood lead level⭓5g/dLb 4.1 1.0 33.3 77.0 6.3 6.3 1.7 0.3 2.4
Botulism 0.0 0.0 0.0 0.0 0.0 0.0 0.0 0.0 0.0
Brucellosisb 0.0 0.0 0.0 0.0 0.0 0.0 0.6 0.0 0.0
Chancroidb 0.0 0.0 0.0 0.0 0.0 0.0 0.0 0.0 0.0
Chlamydia trachomatisinfection 184.6 146.7 399.1 229.0 193.1 260.5 276.3 148.1 228.5
Congenital chlamydiab 1.5 0.0 0.0 0.0 0.6 1.4 1.1 0.0 0.0
Chlamydia – otherb 183.1 146.7 399.1 229.0 192.5 259.1 275.2 148.1 228.5
Cholerab 0.0 0.0 0.0 0.0 0.0 0.0 0.0 0.0 0.0
Creutzfeldt-Jakob diseaseb 0.0 0.0 0.0 0.0 0.0 0.3 0.0 0.0 0.0
Cryptosporidiosisb 6.0 1.4 0.0 5.8 11.0 5.6 11.2 4.5 9.4
Foodborne illness (NOS)e 20.6 0.0 0.0 0.0 0.0 14.8 0.0 26.7 0.0
Gastroenteritis (institutional) 72.6 90.2 59.9 85.6 207.5 225.7 22.4 13.3 84.2
Giardiasisb 15.0 18.0 11.1 35.6 20.8 29.0 18.5 10.3 4.2
Gonorrhoeab 4.1 2.9 6.7 9.6 1.7 17.4 4.5 4.8 11.1
Haemolytic uraemic syndrome 0.0 0.5 0.0 1.0 0.0 0.3 0.0 0.7 0.0
Haemophilus influenzaeserotype b 0.0 0.0 0.0 0.0 0.6 0.2 0.0 0.0 0.0
Hib epiglottitisb 0.0 0.0 0.0 0.0 0.0 0.0 0.0 0.0 0.0
Hib meningitisb 0.0 0.0 0.0 0.0 0.6 0.0 0.0 0.0 0.0
Hib septicaemiab 0.0 0.0 0.0 0.0 0.0 0.2 0.0 0.0 0.0
Hib infection NOSb 0.0 0.0 0.0 0.0 0.0 0.0 0.0 0.0 0.0
Hepatitis Ab 0.0 0.0 0.0 0.0 0.0 0.2 0.0 0.0 0.4
Hepatitis B 8.6 13.8 46.6 9.6 2.9 9.9 7.9 5.5 6.3
Hepatitis B – acute viralb 0.4 1.4 6.7 2.9 0.6 0.9 0.0 0.0 0.7
Hepatitis B – otherb 8.2 12.3 39.9 6.7 2.3 9.0 7.9 5.5 5.6
Hepatitis C 52.8 49.8 82.0 59.7 47.3 56.3 37.6 49.6 74.4
Hepatitis C – acute viralb 0.8 0.5 0.0 3.9 0.0 1.0 0.0 0.3 0.0
Hepatitis C – otherb 52.1 49.4 82.0 55.8 47.3 55.3 37.6 49.3 74.4
Hepatitis Db 0.0 0.0 0.0 1.0 0.0 0.0 0.0 0.0 0.0
Hepatitis Eb 0.0 0.0 0.0 0.0 0.0 0.0 0.0 0.0 0.0
HIV infectionb 1.1 1.4 0.0 1.0 1.2 1.7 1.7 2.7 1.4
Influenza 31.5 36.1 11.1 20.2 17.3 30.5 29.7 16.8 66.8
Influenza – Type Ab 13.5 18.0 4.4 8.7 9.2 8.9 11.2 5.1 20.2
Influenza – Type Bb 17.2 17.1 6.7 11.6 6.3 21.7 17.9 9.6 40.4
Influenza – Type A & Bb 0.0 1.0 0.0 0.0 1.7 0.0 0.6 2.1 2.1
Influenza– Type NOSb 0.8 0.0 0.0 0.0 0.0 0.0 0.0 0.0 4.2
Legionellosis 1.1 1.4 0.0 0.0 2.3 1.5 1.7 1.0 1.1
L. longbeachaeb 0.8 1.0 0.0 0.0 1.7 1.0 1.1 0.7 0.7
L. pneumophilab 0.4 0.5 0.0 0.0 0.6 0.5 0.6 0.3 0.4
Legionnaires’ disease – other 0.0 0.0 0.0 0.0 0.0 0.0 0.0 0.0 0.0
Leprosy 0.0 0.0 0.0 0.0 0.0 0.0 0.0 0.0 0.0
Leptospirosisb 0.0 1.0 0.0 3.9 0.0 0.9 0.0 0.3 1.0
Listeriosisb 0.0 1.4 0.0 0.0 0.0 0.0 0.0 0.0 0.4
Lymphogranuloma venereum (LGV)b 0.0 0.0 0.0 0.0 0.0 0.0 0.0 0.0 0.0
Malariab 1.1 1.9 0.0 1.0 0.0 0.9 1.1 1.7 0.4
Measles 0.0 0.5 0.0 0.0 0.0 0.0 0.0 0.0 0.0
Measles – laboratory confirmed 0.0 0.5 0.0 0.0 0.0 0.0 0.0 0.0 0.0
Measles – other 0.0 0.0 0.0 0.0 0.0 0.0 0.0 0.0 0.0
Meningococcal disease 1.9 1.9 0.0 2.9 1.2 1.0 1.1 0.0 1.1
Meningococcal – serogroup Bb 1.1 1.0 0.0 1.9 0.6 1.0 1.1 0.0 0.4
Meningococcal – serogroup Cb 0.4 0.0 0.0 1.0 0.0 0.0 0.0 0.0 0.4
Meningococcal – serogroup W135b 0.0 0.5 0.0 0.0 0.0 0.0 0.0 0.0 0.0
Meningococcal – serogroup Yb 0.0 0.0 0.0 0.0 0.0 0.0 0.0 0.0 0.0
Meningococcal – other 0.4 0.5 0.0 0.0 0.6 0.0 0.0 0.0 0.4
Mumpsb 0.0 0.0 0.0 1.9 0.6 0.2 0.0 0.0 0.4
Pertussis 114.6 96.8 119.7 177.1 74.9 82.4 47.6 73.6 295.0
Pneumococcal disease (invasive)b 8.2 8.1 15.5 10.6 13.3 10.9 5.6 3.8 6.6
Psittacosisb 1.9 0.0 0.0 2.9 2.9 1.0 0.0 1.0 0.4
Q feverb 4.9 6.2 20.0 15.4 1.2 2.1 16.8 7.5 9.4
Rubella 0.4 0.0 0.0 0.0 0.0 0.0 0.0 0.0 0.0
Congenital rubellab 0.0 0.0 0.0 0.0 0.0 0.0 0.0 0.0 0.0
Rubella – otherb 0.4 0.0 0.0 0.0 0.0 0.0 0.0 0.0 0.0
Salmonellainfectionb,d 28.1 23.7 33.3 27.9 20.8 33.6 37.0 30.8 48.4
Shigellosisb 0.4 0.5 0.0 0.0 1.2 0.0 0.6 0.7 1.4
Syphilis 2.6 5.7 73.2 6.7 2.3 4.1 4.5 5.1 8.7
Congenital syphilis 0.0 0.0 0.0 0.0 0.0 0.0 0.0 0.0 0.0
Infectious syphilisb,c 1.5 0.5 2.2 1.0 0.0 1.0 1.1 0.3 2.4
Syphilis – otherb 1.1 5.2 71.0 5.8 2.3 3.1 3.4 4.8 6.3
Tetanus 0.0 0.0 0.0 0.0 0.0 0.0 0.0 0.3 0.0
Tuberculosisb 3.4 1.0 0.0 0.0 0.0 2.2 0.6 2.7 1.4
Typhoidb 0.0 0.0 0.0 0.0 0.0 0.0 0.0 0.0 0.7
Verotoxin-producing 0.4 0.0 0.0 1.0 0.0 1.0 1.7 0.0 0.4
Escherichia coliinfectionsb
aYear of onset: the earlier of patient reported onset date, specimen date or date of notification. bLaboratory-confirmed cases only. cIncludes Syphilis primary, Syphilis secondary, Syphilis ⬍1-year duration and
Syphilis newly acquired. dIncludes all paratyphoid cases. eFoodborne illness cases are only those notified as part of an outbreak. fAHS further divided into the geographical region covered by their
compo-nent Public Health Unit. NOS: not otherwise specified. No case of the following diseases have been notified since 1991: Plagueb, Diphtheriab, Granuloma inguinaleb, Lyssavirusb, Poliomyelitisb, Rabies, Smallpox,
146 | Vol. 20(9–10) 2009 NSW Public Health Bulletin
Table 4. (Continued)
Condition Northern Sydney South Eastern Sydney Sydney South Westf Sydney Westf Justice
Central Coastf Illawarraf
Camperdown Liverpool Penrith Parramatta Health Gosford Hornsby Wollongong Randwick
Adverse event after immunisation 4.8 2.3 4.2 3.0 2.3 2.9 5.6 4.5 0.0
Anthrax 0.0 0.0 0.0 0.0 0.0 0.0 0.0 0.0 0.0
Arboviral infection 17.5 5.8 13.5 5.6 4.9 1.9 9.7 6.7 0.0
Barmah Forest virusb 4.8 0.6 2.7 0.2 0.8 0.0 0.6 0.3 0.0
Ross River virusb 11.7 2.1 9.3 1.3 2.1 1.1 6.9 2.7 0.0
Otherb 1.0 3.1 1.6 4.0 2.1 0.8 2.2 3.7 0.0
Blood lead level⭓15g/dLb 1.0 0.6 1.3 1.8 1.7 3.3 5.0 1.5 0.0
Botulism 0.0 0.0 0.0 0.0 0.0 0.0 0.0 0.0 0.0
Brucellosisb 0.0 0.0 0.0 0.0 0.0 0.1 0.0 0.0 0.0
Chancroidb 0.0 0.0 0.0 0.0 0.0 0.0 0.0 0.0 0.0
Chlamydia trachomatisinfection 198.6 143.4 174.3 300.8 279.9 127.9 148.3 140.7 1913.0
Congenital chlamydiab 0.3 0.3 0.5 0.2 0.8 0.6 0.0 1.0 0.0
Chlamydia – otherb 198.3 143.2 173.8 300.6 279.2 127.3 148.3 139.6 1913.0
Cholerab 0.0 0.0 0.0 0.0 0.2 0.0 0.3 0.0 0.0
Creutzfeldt-Jakob diseaseb 0.3 0.1 0.3 0.0 0.0 0.1 0.0 0.0 0.0
Cryptosporidiosisb 7.6 9.0 3.7 12.3 3.0 3.5 10.3 7.3 0.0
Foodborne illness (NOS)e 21.6 0.0 20.1 0.0 15.4 0.0 64.5 0.0 175.0
Gastroenteritis (institutional) 211.9 199.1 103.2 115.7 305.3 49.2 192.9 172.7 0.0
Giardiasisb 25.7 40.2 23.6 41.2 23.9 14.3 31.2 24.6 25.0
Gonorrhoeab 8.3 15.7 8.5 55.4 47.0 10.1 10.6 13.3 62.5
Haemolytic uraemic syndrome 0.0 0.3 0.3 0.0 0.4 0.5 0.3 0.1 0.0
Haemophilus influenzaeserotype b 0.6 0.0 0.0 0.1 0.2 0.1 0.6 0.0 0.0
Hib epiglottitisb 0.3 0.0 0.0 0.0 0.0 0.0 0.0 0.0 0.0
Hib meningitisb 0.0 0.0 0.0 0.1 0.0 0.0 0.0 0.0 0.0
Hib septicaemiab 0.0 0.0 0.0 0.0 0.0 0.1 0.3 0.0 0.0
Hib infection NOSb 0.3 0.0 0.0 0.0 0.2 0.0 0.3 0.0 0.0
Hepatitis Ab 0.6 2.0 1.6 0.7 1.5 1.2 0.3 2.3 0.0
Hepatitis B 9.2 36.0 14.6 48.6 83.1 66.0 12.2 69.5 587.5
Hepatitis B – acute viralb 0.0 0.5 0.5 0.7 1.3 0.5 0.3 0.3 12.5
Hepatitis B – otherb 9.2 35.5 14.0 47.9 81.8 65.5 11.8 69.2 575.0
Hepatitis C 56.5 21.2 46.0 49.4 60.0 52.0 43.0 35.6 7250.0
Hepatitis C – acute viralb 0.0 0.0 0.3 0.1 0.0 0.1 0.0 0.3 62.5
Hepatitis C – otherb 56.5 21.2 45.8 49.3 60.0 51.8 43.0 35.3 7188.0
Hepatitis Db 0.0 0.0 0.0 0.2 0.0 0.4 0.3 0.5 37.5
Hepatitis Eb 0.0 0.1 0.3 0.1 0.4 0.4 0.3 0.6 0.0
HIV infectionb 1.9 3.1 0.8 14.1 14.1 2.0 2.2 3.5 0.0
Influenza 9.8 12.3 23.5 19.4 16.0 16.8 42.7 47.0 37.5
Influenza – Type Ab 3.5 5.1 11.6 6.7 9.8 6.4 22.1 20.4 25.0
Influenza – Type Bb 6.0 6.8 10.6 11.2 6.0 10.3 12.5 24.6 12.5
Influenza – Type A & Bb 0.0 0.4 1.3 1.6 0.2 0.0 8.1 1.9 0.0
Influenza – Type NOSb 0.3 0.1 0.0 0.0 0.0 0.0 0.0 0.1 0.0
Legionellosis 1.0 0.9 1.6 1.0 0.8 1.1 2.2 2.2 0.0
L. longbeachaeb 0.6 0.6 1.1 0.5 0.6 0.2 1.6 0.9 0.0
L. pneumophilab 0.3 0.3 0.5 0.4 0.2 0.8 0.6 1.3 0.0
Legionnaires’ disease – other 0.0 0.0 0.0 0.1 0.0 0.0 0.0 0.0 0.0
Leprosy 0.0 0.0 0.0 0.0 0.2 0.1 0.0 0.3 0.0
Leptospirosisb 0.0 0.0 0.3 0.0 0.2 0.0 0.0 0.0 0.0
Listeriosisb 0.3 0.4 0.5 0.6 1.1 0.6 0.6 0.8 0.0
Lymphogranuloma venereum (LGV)b 0.0 0.0 0.0 0.0 0.2 0.0 0.0 0.0 0.0
Malariab 0.6 2.1 2.7 1.2 3.0 0.6 1.6 2.9 0.0
Measles 0.0 0.4 0.3 0.5 0.8 2.1 0.9 0.6 0.0
Measles – laboratory confirmed 0.0 0.4 0.3 0.5 0.6 1.8 0.9 0.5 0.0
Measles – other 0.0 0.0 0.0 0.0 0.2 0.4 0.0 0.1 0.0
Meningococcal disease 1.0 1.1 1.9 1.2 0.4 1.3 2.5 0.8 0.0
Meningococcal – serogroup Bb 0.6 0.5 1.1 0.6 0.4 0.8 1.6 0.4 0.0
Meningococcal – serogroup Cb 0.0 0.3 0.3 0.1 0.0 0.1 0.0 0.1 0.0
Meningococcal – serogroup W135b 0.0 0.0 0.0 0.2 0.0 0.1 0.3 0.0 0.0
Meningococcal – serogroup Yb 0.0 0.0 0.5 0.1 0.0 0.1 0.0 0.0 0.0
Meningococcal – other 0.3 0.4 0.0 0.1 0.0 0.1 0.6 0.3 0.0
Mumpsb 0.6 1.0 1.1 3.5 1.9 0.8 0.3 1.3 0.0
Pertussis 125.6 123.6 187.0 121.9 83.7 68.0 195.0 191.0 25.0
Pneumococcal disease (invasive)b 9.8 6.7 7.1 6.3 7.5 6.9 8.1 9.7 0.0
Psittacosisb 0.3 0.1 0.0 0.2 0.2 0.6 2.2 0.1 0.0
Q feverb 1.3 0.0 2.9 0.2 0.0 0.0 0.0 0.3 12.5
Rubella 0.3 0.7 0.0 0.2 0.6 0.4 0.0 0.1 0.0
Congenital rubellab 0.0 0.0 0.0 0.0 0.0 0.0 0.0 0.0 0.0
Rubella – otherb 0.3 0.7 0.0 0.2 0.6 0.4 0.0 0.1 0.0
Salmonellainfectionb,d 44.1 42.3 25.4 32.2 31.2 25.9 29.6 28.8 0.0
Shigellosisb 0.3 1.5 1.3 5.2 3.2 1.2 0.0 1.0 0.0
Syphilis 7.9 7.5 7.9 35.4 38.7 15.1 9.4 13.3 187.5
Congenital syphilis 0.0 0.0 0.0 0.1 0.0 0.0 0.0 0.1 0.0
Infectious syphilisb,c 1.3 3.0 1.6 24.3 19.7 2.1 2.2 3.2 12.5
Syphilis – otherb 6.7 4.6 6.4 10.9 19.0 13.0 7.2 10.0 175.0
Tetanus 0.0 0.0 0.0 0.0 0.0 0.0 0.0 0.0 0.0
Tuberculosisb 1.6 6.5 1.9 8.5 13.9 10.5 4.4 17.4 0.0
Typhoidb 0.0 0.3 0.0 0.6 1.5 1.2 0.0 2.1 0.0
Verotoxin-producing 0.3 0.1 0.0 0.1 0.4 0.1 0.3 0.0 0.0
Escherichia coliinfectionsb
aYear of onset: the earlier of patient reported onset date, specimen date or date of notification. bLaboratory-confirmed cases only. cIncludes Syphilis primary, Syphilis secondary, Syphilis ⬍1-year duration and
Syphilis newly acquired. dIncludes all paratyphoid cases. eFoodborne illness cases are only those notified as part of an outbreak. fAHS further divided into the geographical region covered by their
compo-nent Public Health Unit. NOS: not otherwise specified. No case of the following diseases have been notified since 1991: Plagueb, Diphtheriab, Granuloma inguinaleb, Lyssavirusb, Poliomyelitisb, Rabies, Smallpox,
Year in review
Table 5. Disease notifications by area health service of residence (including breakdown by 2005 AHS boundaries) of case, NSW, 2008
Condition Greater Southernf Greater Westernf Hunter New Englandf North Coastf
Albury Goulburn Broken Hill Dubbo Bathurst Newcastle Tamworth Port Macquarie Lismore Adverse event after immunisation 15 13 2 4 18 14 5 2 10
Anthrax 0 0 0 0 0 0 0 0 0
Arboviral infection 175 46 68 127 43 338 120 220 378
Barmah Forest virusb 9 14 10 9 1 116 21 121 191
Ross River virusb 165 28 58 117 40 215 94 95 178
Otherb 1 4 0 1 2 7 5 4 9
Blood lead level⭓15g/dLb 11 2 15 80 11 37 3 1 7
Botulism 0 0 0 0 0 0 0 0 0
Brucellosisb 0 0 0 0 0 0 1 0 0
Chancroidb 0 0 0 0 0 0 0 0 0
Chlamydia trachomatisinfection 493 309 180 238 335 1527 493 433 657
Congenital chlamydiab 4 0 0 0 1 8 2 0 0
Chlamydia – otherb 489 309 180 238 334 1519 491 433 657
Cholerab 0 0 0 0 0 0 0 0 0
Creutzfeldt-Jakob diseaseb 0 0 0 0 0 2 0 0 0
Cryptosporidiosisb 16 3 0 6 19 33 20 13 27
Foodborne illness (NOS)e 55 0 0 0 0 87 0 78 0
Gastroenteritis (institutional) 194 190 27 89 360 1323 40 39 242
Giardiasisb 40 38 5 37 36 170 33 30 12
Gonorrhoeab 11 6 3 10 3 102 8 14 32
Haemolytic uraemic syndrome 0 1 0 1 0 2 0 2 0
Haemophilus influenzae serotype b 0 0 0 0 1 1 0 0 0
Hib epiglottitisb 0 0 0 0 0 0 0 0 0
Hib meningitisb 0 0 0 0 1 0 0 0 0
Hib septicaemiab 0 0 0 0 0 1 0 0 0
Hib infection NOSb 0 0 0 0 0 0 0 0 0
Hepatitis Ab 0 0 0 0 0 1 0 0 1
Hepatitis B 23 29 21 10 5 58 14 16 18
Hepatitis B – acute viralb 1 3 3 3 1 5 0 0 2
Hepatitis B – otherb 22 26 18 7 4 53 14 16 16
Hepatitis C 141 105 37 62 82 330 67 145 214
Hepatitis C – acute viralb 2 1 0 4 0 6 0 1 0
Hepatitis C – otherb 139 104 37 58 82 324 67 144 214
Hepatitis Db 0 0 0 1 0 0 0 0 0
Hepatitis Eb 0 0 0 0 0 0 0 0 0
HIV infectionb 3 3 0 1 2 10 3 8 4
Influenza 84 76 5 21 30 179 53 49 192
Influenza – Type Ab 36 38 2 9 16 52 20 15 58
Influenza – Type Bb 46 36 3 12 11 127 32 28 116
Influenza – Type A & Bb 0 2 0 0 3 0 1 6 6
Influenza – Type NOSb 2 0 0 0 0 0 0 0 12
Legionellosis 3 3 0 0 4 9 3 3 3
L. longbeachaeb 2 2 0 0 3 6 2 2 2
L. pneumophilab 1 1 0 0 1 3 1 1 1
Legionnaires’ disease – other 0 0 0 0 0 0 0 0 0
Leprosy 0 0 0 0 0 0 0 0 0
Leptospirosisb 0 2 0 4 0 5 0 1 3
Listeriosisb 0 3 0 0 0 0 0 0 1
Lymphogranuloma venereum (LGV)b 0 0 0 0 0 0 0 0 0
Malariab 3 4 0 1 0 5 2 5 1
Measles 0 1 0 0 0 0 0 0 0
Measles – laboratory confirmed 0 1 0 0 0 0 0 0 0
Measles – other 0 0 0 0 0 0 0 0 0
Meningococcal disease 5 4 0 3 2 6 2 0 3
Meningococcal – serogroup Bb 3 2 0 2 1 6 2 0 1
Meningococcal – serogroup Cb 1 0 0 1 0 0 0 0 1
Meningococcal – serogroup W135b 0 1 0 0 0 0 0 0 0
Meningococcal – serogroup Yb 0 0 0 0 0 0 0 0 0
Meningococcal – other 1 1 0 0 1 0 0 0 1
Mumpsb 0 0 0 2 1 1 0 0 1
Pertussis 306 204 54 184 130 483 85 215 848
Pneumococcal disease (invasive)b 22 17 7 11 23 64 10 11 19
Psittacosisb 5 0 0 3 5 6 0 3 1
Q feverb 13 13 9 16 2 12 30 22 27
Rubella 1 0 0 0 0 0 0 0 0
Congenital rubellab 0 0 0 0 0 0 0 0 0
Rubella – otherb 1 0 0 0 0 0 0 0 0
Salmonellainfectionb,d 75 50 15 29 36 197 66 90 139
Shigellosisb 1 1 0 0 2 0 1 2 4
Syphilis 7 12 33 7 4 24 8 15 25
Congenital syphilis 0 0 0 0 0 0 0 0 0
Infectious syphilisb,c 4 1 1 1 0 6 2 1 7
Syphilis – otherb 3 11 32 6 4 18 6 14 18
Tetanus 0 0 0 0 0 0 0 1 0
Tuberculosisb 9 2 0 0 0 13 1 8 4
Typhoidb 0 0 0 0 0 0 0 0 2
Verotoxin-producingEscherichia 1 0 0 1 0 6 3 0 1
coliinfectionsb
aYear of onset: the earlier of patient reported onset date, specimen date or date of notification. bLaboratory-confirmed cases only. cIncludes Syphilis primary, Syphilis secondary, Syphilis ⬍1-year duration and
Syphilis newly acquired. dIncludes all paratyphoid cases. eFoodborne illness cases are only those notified as part of an outbreak. fAHS further divided into the geographical region covered by their
compo-nent Public Health Unit. gRate is based on a denominator of 8000 persons. hIncludes cases with unknown Public Health Unit. NOS: not otherwise specified. No case of the following diseases have been