*Corresponding author:Rekha Choudhary ISSN: 0976-3031
Research Article
A SYSTEMIC APPROACH FOR THE FORMULATION OF FLOATING
MICROSPHERES OF VALACYCLOVIR
Rekha Choudhary
1., Naveneet Dubey
2., Sarang Jain
3and Sunil K Chaturvedi
41,3,4
Rajeev Gandhi College of Pharmacy Bhopal
2
School of Pharmaceutical Sciences RGPV Bhopal
DOI: http://dx.doi.org/10.24327/ijrsr.2018.0902.1548
ARTICLE INFO ABSTRACT
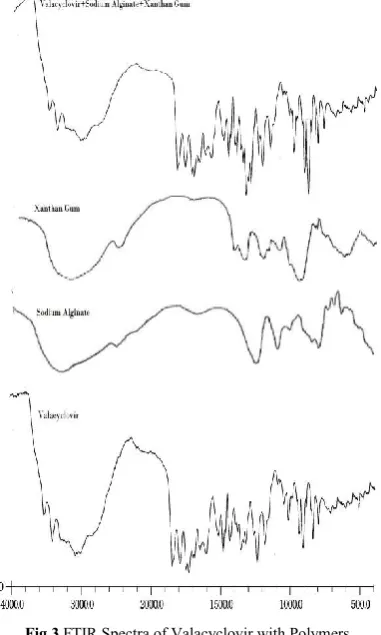
In present study valacyclovir, microsphere was prepared by ionic gelation technique. Valacyclovir HCl, having a short biological half-life of < 30 minutes (Acyclovir 1.5-2 h) and its rapid elimination from the body, is ideally suited to be delivered through floating multiunit dosage form. Six formulations with natural polymers were formulated and characterized for their micromeritic and other properties. The process induced the formation of microspheres with the incorporation efficiency of 98% to 99%. The effect of sodium alginate and xanthan gum concentration and conditions were evaluated with respect to entrapment efficiency, particle size, buoyancy studies, surface characteristics and in vitro release behaviours. The infrared spectroscopic study confirmed the absence of any drug-polymer interaction. Microsphere matrices showing spherical surface, which was confirmed by scanning electron microscopy study. The mean particle size and entrapment efficiency were found to be varied by changing various formulation parameters. The in vitro release profile could be altered significantly by changing various formulation parameters to give a prolonged release of drug from the microspheres.
INTRODUCTION
An effort is being finished to develop and characterize floating microspheres, which subsequent to oral administration might extend gastric residence time and increase drug bioavailability1. Oral delivery of the drug is the greater part preferable route of drug-delivery due to the easiness of administration, patient fulfilment and suppleness of formulation, etc. Beginning immediate release ofsite-specific delivery, oral dosage-forms have really progressed. Numerous difficulties have been faced in designing controlled release systems for better absorption and enhanced bioavailability. The principle of buoyant preparation offers an easy and sensible approach to achieve increased gastric dwelling time for the dosage form and controlled drug release2. Preparation remains buoyant in stomach content due to its lower density than that of gastric fluid. It is the sound accepted fact that it is difficult to predict the real In vivo time of release by way of solid, oral controlled release dosage forms. Thus drug absorption in the gastrointestinal gut may be extremely short and high variable in certain circumstances. Gastric emptying of the multiparticulate floating system would occur in a consistent manner by way of reduced intersubject variability in absorption3. On every subsequent gastric emptying, deep-set particles will spread out
over a big area of absorption site, increasing the opportunity for drug-release and absorption. Valacyclovir, an antiviral used in the treatment of Herpes simplex virus and Varicella zoster virus, has a short biological half-life of fewer than 30 minutes. It is a prodrug of acyclovir intended for oral administration. Because of its short elimination half-life, it requires multiple dosing to achieve and maintain therapeutic levels.
MATERIALS AND METHODS
Valacyclovir obtained as a gift sample from Milan Distribution Private Limited, Mumbai, sodiumalginate and calcium chloride is obtained from Yarrow chemicals Mumbai, Hydroxypropylmethylcellulose (HPMC) obtained from Finar Scientific, Chitosan obtained from Acros scientific.
Analytical Method for Estimation of Valacyclovir
Determination of maximum wavelength (λmax) of Valacyclovir was done by preparing three different dilutions of stock solutions (1mg/ml) and scanned those dilutions under UV-Vis Spectrophotometer.
Available Online at http://www.recentscientific.com
International Journal of
Recent Scientific
Research
International Journal of Recent Scientific Research
Vol. 9, Issue, 2(B), pp. 23848-23854, February, 2018
Copyright © Rekha Choudhary et al, 2018, this is an open-access article distributed under the terms of the Creative Commons Attribution License, which permits unrestricted use, distribution and reproduction in any medium, provided the original work is properly cited.
DOI: 10.24327/IJRSR
CODEN: IJRSFP (USA)
Article History:
Received 10th November, 2017
Received in revised form 14th
December, 2017
Accepted 08th January, 2018
Published online 28th February, 2018
Key Words:
Preparation of Calibration Curve of Valacyclovir in 0.1N HCl
Dissolved 50 mg of Valacyclovir in 50 mL of 0.1N HCl pH-1.2 (stock solution 1mg/ml e.g. e.g. 25 mg accurately weighed dissolved in 100 ml distilled water, then further diluted with solvent). The stock solution of Valacyclovir is diluted with solvent to make solution of 5, 10, 15, 20, 25 and 30 μg/ ml. The prepared solutions were then examined under UV-Vis Spectrophotometer at λmax of 256 nm for absorbance and then calibration curve is plotted between absorbance and concentration.
Loss on Drying
Loss on drying is the loss of weight expressed as percentage w/w resulting from water and volatile matter of any kind that can be driven off under specified conditions. The test is carried out on a well-mixed sample of the substance.
Procedure
A glass-stoppered shallow weighing bottle was weighed that has been dried in an oven at 105°C for 3 hrs. After drying was completed, allowed it to cool to room temperature in a desiccator.1.0 g of the sample was transferred to the bottle, covered it and accurately weighed the bottle and the contents. The substance was dried by placing the loaded bottle in an oven at 105°C for 3 hrs. After drying was completed, allowed it to cool to room temperature in a desiccator before weighing. The bottle and the contents were weighed again (Table- 8.1.5).
Initial weight –final weight
Loss on drying = X 100 Initial weight
Drug Excipients Compatibility Studies [Infrared spectroscopy (IR)]
IR spectrum of any compound gives information about the group present in particular compound. IR transmission spectra were obtained using infrared spectrophotometer (Bruker). An infrared spectrum of the drug was taken using KBr pellets. A small quantity of drug was used for IR analysis. The pellets were placed in a holder and an infrared spectrum was taken. The scanning range was 400–4000 cm−1; various peaks in the infrared spectrum were interpreted for the presence of the different group in the structure of the drug.
Preparation of Valacyclovir loaded Microspheres
The floating microspheres containing Valacyclovir were prepared by orifice ionic gelation technique. Sodium alginate alone or in combination with xanthan gum and the gas forming agent sodium carbonate was dispersed in the purified water to form a homogeneous polymer mixture. The drug, Valacyclovir was added to the polymer dispersion and mixed thoroughly on a magnetic stirrer to form a homogeneous dispersion. The gelation medium was prepared by dissolving calcium chloride in 2% glacial acetic acid. The homogenous alginate solution was extruded using 21G syringe needle into the gelation medium. The distance between the edge of the needle and surface of gelation medium was about 10cms. The gel microspheres formed were left in the solution with gentle stirring for 30 min at room temperature to improve mechanic strength. After that, microsphere was collected and washed with distilled water twice, dried at room temperature for 24 hr
and stored in desiccators.(5,6)The composition and the conditions observed during the preparation of microspheres are showed in table no 1
Table1 Composition of Floating Microspheres of Valacyclovir
S. No. Excipients F1 F2 F3 F4 F5 F6
1. Valacyclovir (mg) 500 500 500 500 500 500
2. Sodium Alginate (mg) 500 1000 1500 250 500 750
3. Xanthan Gum (mg) - - - 250 500 750
4. Sodium bicarbonate
(%w/w) 50 50 50 50 50 50
5. Calcium Chloride
(%w/w) 10 10 10 10 10 10
6. Acetic acid (%w/w) 1.5 1.5 1.5 1.5 1.5 1.5
7. Drug: Polymer ratio 1:1 1:2 1:3 1:1 1:2 1:3
In-vitro drug release profile of formulated microspheres
The dissolution studies executed utilizing (type II) XXIV USP dissolution rate test apparatus in 0.1 N HCl for 2 hrs followed by pH 7.4 900ml dissolution media, at 50 rpm and 37 ± 10C temperature upto 12 hrs. Using Systronics UV-2203 U.V. Spectrophotometer double beam, 5ml of samples taken at different time gaps and 5ml of same dissolution medium added to uphold sink condition. Withdrawn aliquots diluted and analyzed spectrophotometrically at 256 nm. The percent release of Valacyclovir was calculated and agraph plotted against time.
Drug Release Kinetic Studies
To study the release kinetics and mechanism of release in-vitro release data was applied to kinetic models such as zero order (Cumulative % drug release vs. time), first order (Log Mean % drug unreleased vs. time), Higuchi (Mean % cumulative drug release vs. square root of time) and Korsmeyer-Peppas (Log mean % cumulative drug release vs. Log time) using Microsoft Excel software and the regression values (R2) were calculated.
Accelerated Stability Studies of the optimized batch
The period of stability testing can be as long as two years, it is time-consuming and expensive. Therefore it is essential to devise a method that will help rapid prediction of long-term stability of the drug.
The accelerated stability testing is defined as the validated method by which the product stability may be predicted by the storage of the product under the condition that accelerates the change in defined and predictable manner.
Stability study of optimized formulation was carried out to determine the effect of formulation additives on the stability of drug and also to determine the physical stability of formulation (World Health Organization, 2006).
The stability study of formulations was carried out according to the ICH guidelines for zones III and IV. The formulations were stored at 40 ± 2°C/75 ± 5% RH for 4 weeks by storing the samples in a stability chamber. At the end of 4 weeks, tablets were tested for drug content and disintegration time and in-vitro dissolution studies.
International Journal of Recent Scientific Research Vol. 9, Issue, 2(B), pp. 23848-23854, February, 2018
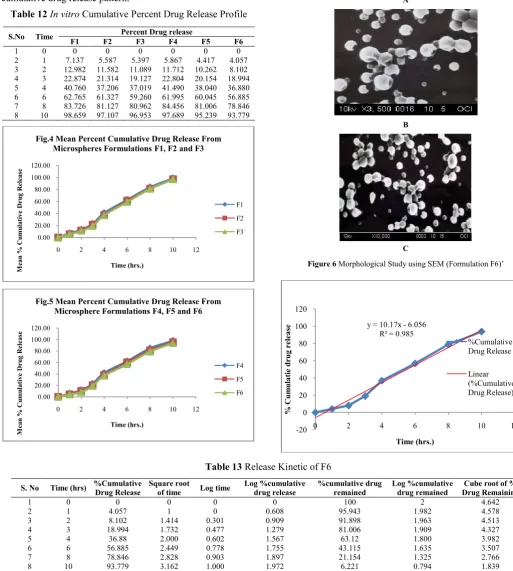
Morphological Study using SEM
Formulation mounted directly on scotch double adhesive tape analyzed under scanning electron microscope SEM model XL-30, operated at 15K SEM thickness of 100% using FEI-Philips Analytical Electron microscope (Diya labs, Mumbai).
RESULTS AND DISCUSSION
Organoleptic Properties
The physical characteristic like organoleptic properties of drug sample was performed and it was found to be bitter in taste, the colour was white crystalline powder and was odourless. And hence the drug sample was found to be as per specifications
Table 2 Organoleptic properties of drug
S. No. Test Observations Standard(90)
1. Colour white powder White crystalline powder
2. Taste Bitter Bitter
3. Odor odourless odourless
Determination of Melting Point
The melting point of Valacyclovir was determined to check the purity of them. The melting point of the drugs was determined by using Digital melting point apparatus. The results of the observed melting point of the drugs are shown in the Table3
Table 3 Melting point
S. No. Drug Observation Specification
1. Valacyclovir 196.5-200.50C 196-2000C
Determination of the Solubility
The solubility of Valacyclovir was determined to find the extent to which they were soluble in different solvents such water, 0.1 N HCl, Methanol, Ethanol, Phosphate buffer pH 6.8 and Phosphate buffer pH 7.4. The solubility of the drug in different solvent assists in identifying the proper release medium for in-vitro release studies. The results for the determination of the solubility of both drugs are shown in Table 4
Table 4 Solubility profile of drug
S. No. Solvents Solubility
1. Distilled water Freely soluble
2. Methanol soluble
3. Ethanol Slightly
soluble
4. 0.1N HCl Soluble
5. PB pH 6.8 Soluble
6. PBS pH 7.4 Soluble
Determination of the Partition Coefficient
Table 5
S. No. Drug Observation
(LogP) Standard (LogP)
1. Valacyclovir -0.3±0.02 -0.3
The partition coefficient observed was resembling with the standard values mentioned in the references
Scanning of Valacyclovir
UV Spectra As Shown In Figure 1 The scanning of Valacyclovir was performed to determine the wavelength at which Valacyclovir absorb a maximum of UV radiation when
the solution of Valacyclovir was exposed to UV radiation. The scanning of Valacyclovir was done by placing solutions of different dilutions (100, 10, 1 μg / mL) of stock solution (1 mg/ml e.g. 25 mg accurately weighed dissolved in 100 ml distilled water, then further diluted with asolvent, under UV Spectrophotometer. The results of scanning of Valacyclovir are shown in Table 6. The results of scanning of Valacyclovir at 100, 10, 1 μg / mL showed that the solution of the 100 μg / mL has a maximum absorbance at a wavelength of 256 nm. This wavelength is selected as λmax for the determination of absorbance of different concentration of solutions
Figure 1
Table 6 Dilution data of stock solution for scanning of Valacyclovir
Sr. No.
Dilution of stock Solution of Valacyclovir (1
mg/mL)
Concentration (μg / mL)
Maximum Wavelength (λmax ) (nm)
Absorbance
1 10 times ( 1in 10 mL) 100 256.5 1.871
2 100 times( 1 in 100 mL) 10 256.0 0.323
3 1000 times( 1 in 1000 mL) 1 256 0.031
Preparation of Calibration Curve of Valacyclovir by U.V Spectroscopy Method
The calibration curve of Valacyclovir in 0.1N HCl pH-1.2 was prepared to identify the linearity range of it. The calibration curve of Valacyclovir was prepared by examining the absorbance of valacyclovir solutions of 5, 10, 15, 20, 25 and 30 μg / ml in saline prepared from stock solution (1mg/ml e.g. e.g. 25 mg accurately weighed dissolved in 100 ml distilled water, then further diluted with solvent) under UV Spectrophotometer at λmax of 256 nm. The results of absorbance of Valacyclovir solutions are shown in Table 7
Table 7 Data for preparation of Calibration Curve of Valacyclovir at λmax of 256 nm
Sr. No. Concentration of
Valacyclovir (μg / mL)
Absorbance ± SD (n=3)
1 5 0.157±0.007
2 10 0.315±0.006
3 15 0.471±0.004
4 20 0.630±0.009
5 25 0.783±0.006
6 30 0.951±0.008
Micromeritics Studies of microspheres
Figure 2 All values are average of three determinations (n=3).The results of calibration curve of Valacyclovir showed that curve is straight line with r2
=0.999
Fig 3 FTIR Spectra of Valacyclovir with Polymers
The values of Average particle size and angle of repose were lies in between 291.46 ±8.3 to 432.62 ±7.3, and 250-12o to 300-20o, respectively indicates acceptable particle size, flow property and also good packing ability
Table 8 Micromeritics Studies of Microspheres BatchAvgmicrospheres Bulk
Density Tap Density
Angle of Repose
Compressibility Index
Hausner's ratio
F1 291.46±8.3 0.298 0.522 25.15 o 13.81 1.15
F2 323.44±6.9 0.542 0.654 26.20 o 13.90 1.15
F3 356.88±8.6 0.526 0.636 25.12 o 12.65 1.13
F4 263.84±8.3 0.430 0.508 30.20 o 12.03 1.12
F5 327.65±7.5 0.482 0.528 25.06 o 13.71 1.14
F6 356.22±8.1 0.516 0.616 31.24 o 13.80 1.15
Floating Behaviour of microspheres
Valacyclovir microsphere was dispersed in 0.1 HCl as simulated gastric fluid. Floating ability of different formulation was found to be differed according to sodium alginate and xanthan gum ratio. F1-F6 formulations showed floating ability (84.92-88.46%). F1-F3 formulations showed less floating ability (84.92-87.30%) as showed in Table-7.1.8.2 compared to F4-F6. The floating ability of microsphere is decreased by increasing the polymer ratio.
Table 9 Floating Behavior studies of Valacyclovir Microspheres
S. No. Batch % In vitro buoyancy
1. F1 84.92±1.4
2. F2 86.12±2.4
3. F3 87.30±1.1
4. F4 85.48±2.6
5. F5 87.94±1.5
6. F6 88.46±2.6
*All the values represent mean ± standard deviation (n=3)
Percentage recovery (i.e. Yield) of microspheres
Best % recovery was obtained for batch F6 - 96.47 %. Overall percent recovery of microspheres obtained was greater than 86%.
Table 10 Total Percent Yield of Valacyclovir Microspheres
S. No. Batch % Yield
1. F1 86.46±1.2
2. F2 88.37±1.8
3. F3 90.41±2.7
4. F4 82.62±2.3
5. F5 88.54±1.7
6. F6 96.47±1.3
*All the values represent mean ± standard deviation (n=3)
Drug Content and Drug Entrapment efficiency
Formulation F6 gave well 80.50±1.7 % drug content largest among the other formulations. The formulations have shown the percent drug content in between 48.14±0.9 to 80.50±1.7. All the batches have shown the percent drug efficiency in between 98.29±1.8 to 99.94±1.6. The F6 batch has shown 99.89±0.5 percent entrapment efficiency higher drug loading than other batches. It can be happened due to viscosity caused by the used material.
Table 11 Percentage Drug Content and Percent drug entrapment of microspheres
S. No. Batch % Drug Content Entrapment
Efficiency
1. F1 48.14±0.9 98.29±1.8
2. F2 68.40±3.6 99.32±1.2
3. F3 79.25±1.9 99.38±0.7
4. F4 49.62±2.6 98.77±1.5
5. F5 71.72±1.4 98.94±1.6
6. F6 80.50±1.7 99.89±0.5
*All the values represent mean ± standard deviation (n=3)
Drug entrapment efficacy slightly increases with increase in sodium alginate content and xanthan gum ratio in Microspheres. This is due to the permeation characteristics of polymers that could facilitate the diffusion of part of entrapped drug to surrounding medium during the preparation of Valacyclovir microspheres.
y = 0.031x - 0.002 R² = 0.999
0 0.2 0.4 0.6 0.8 1 1.2
0 5 10 15 20 25 30 35
Ab
sor
bance
Concentration (µg/ml)
International Journal of Recent Scientific Research Vol. 9, Issue, 2(B), pp. 23848-23854, February, 2018
In-vitro Release Profile Study of Formulated microspheres
The results demonstrated that formulations (F1, F2, F3) showed Valacyclovir discharge speed in series of 96-98% when compared (F4, F5 and F6) demonstrated a Valacyclovir discharge speed from 93 -97% up to the duration of 10 hours. This denotes that if the quantity of rate retarding polymer raised, leads to retard discharge of drug. The synergistic effect was observed when the sodium alginate was combined with xanthan gum. Hence batch F6 indicates the better results than other prepared batches. Formulation F6 shown 93.77% cumulative drug release pattern.
Table 12 In vitro Cumulative Percent Drug Release Profile
S.No Time Percent Drug release
F1 F2 F3 F4 F5 F6
1 0 0 0 0 0 0 0
2 1 7.137 5.587 5.397 5.867 4.417 4.057
3 2 12.982 11.582 11.089 11.712 10.262 8.102 4 3 22.874 21.314 19.127 22.804 20.154 18.994 5 4 40.760 37.206 37.019 41.490 38.040 36.880 6 6 62.765 61.327 59.260 61.995 60.045 56.885 7 8 83.726 81.127 80.962 84.456 81.006 78.846 8 10 98.659 97.107 96.953 97.689 95.239 93.779
0.00 20.00 40.00 60.00 80.00 100.00 120.00
0 2 4 6 8 10 12
M
ean
% Cu
mu
lat
ive
Dru
g
Releas
e
Time (hrs.)
Fig.4 Mean Percent Cumulative Drug Release From Microspheres Formulations F1, F2 and F3
F1
F2
F3
0.00 20.00 40.00 60.00 80.00 100.00 120.00
0 2 4 6 8 10 12
M
ean
% C
u
mu
lat
ive
Dru
g
Releas
e
Time (hrs.)
Fig.5 Mean Percent Cumulative Drug Release From Microsphere Formulations F4, F5 and F6
F4
F5
F6
y = 10.17x - 6.056 R² = 0.985
-20 0 20 40 60 80 100 120
0 2 4 6 8 10 12
%
Cu
m
ula
tie
drug
re
le
a
se
Time (hrs.)
%Cumulative Drug Release
Linear (%Cumulative Drug Release) A
B
C
Figure 6 Morphological Study using SEM (Formulation F6)’
Table 13 Release Kinetic of F6 S. No Time (hrs) %Cumulative
Drug Release
Square root
of time Log time
Log %cumulative drug release
%cumulative drug remained
Log %cumulative drug remained
Cube root of % Drug Remaining
1 0 0 0 0 0 100 2 4.642
2 1 4.057 1 0 0.608 95.943 1.982 4.578
3 2 8.102 1.414 0.301 0.909 91.898 1.963 4.513
4 3 18.994 1.732 0.477 1.279 81.006 1.909 4.327
5 4 36.88 2.000 0.602 1.567 63.12 1.800 3.982
6 6 56.885 2.449 0.778 1.755 43.115 1.635 3.507
7 8 78.846 2.828 0.903 1.897 21.154 1.325 2.766
When the sodium alginate was combined with the natural gums is used for retarding drug discharge.
Valacyclovir liberates from matrix involve solvent diffusion into the matrix, polymer gelation, solubilization Valacyclovir and drug transfer along eddies of themedium
FIGURE 4&5
Drug Release Kinetic Studies
The drug dissolution data was checked to discharge kinetics to check basis for medicament release by microspheres
y = 32.21x - 21.55 R² = 0.855
-40 -20 0 20 40 60 80 100
0 0.5 1 1.5 2
% Cu m ula tie drug re le ase
Square root of time Fig. 7. Higuchi Model for F6
y = 1.738x + 0.365 R² = 0.927
0 0.5 1 1.5 2 2.5
0 0.2 0.4 0.6 0.8
Lo g % Cu m u la tive Drug Rele a se Log Time
Fig.8Korsmeyer Peppas Model for Formulation F6
y = -0.281x + 4.965 R² = 0.951
0.000 1.000 2.000 3.000 4.000 5.000 6.000
0 2 4 6 8
Cu be r o o t o f % D ru g Remain in g Time (hrs.)
FIGURE 09 Hixson Crowell Model for Formulation F6
When the sodium alginate was combined with the natural gums is used for retarding drug discharge. The process of from matrix involve solvent diffusion the matrix, polymer gelation, solubilization Valacyclovir medium.AS SHOWN IN
The drug dissolution data was checked to discharge kinetics to check basis for medicament release by microspheres-
Table 14 R2 Values for Different Kinetic models of F6
S.No. Formulation Zero Order
First Order
1. F6 0.985 0.896
The microspheres were subjected to employing 0.1N Hydrochloric
Fig-7.1.8.5a-7.1.8.5.b. When the amount of drug release values were plotted against time straight lines were obtained in all the cases indicating that the rate of drug release from these microspheres followed zero order kinetics(Table
Fig-7.1.8.7a) .To ascertain the mechanism of drug release from various microspheres, the plot
(Peppas plots) were drawn.
linear (Fig 7.1.8.7a-7.1.8.7.f
the exponential coefficient values were found to be in
between 0.855 and 0.985, indicating
controlled release mechanism (Table
results indicated that the release rate was found to
decrease with increase in the
material applied.
Accelerated Stability Studies
The microspheres from the selected and optimized batch
F6 was studied for stability and kept under the
accelerated conditions like raised temperature and
moisture up to a period
revealed no marked alterations in physical appearance
and drug releasing properties
Table 15 Drug Release From Formulation F6 After Stability Studies of Three Months
Time (Hours)
% Cumulative Drug Released
At 0 day
0 0
1 4.012
2 7.982
3 18.874
4 36.76
6 56.765
8 78.726
10 93.659
21.55
2.5 3 3.5
Fig. 7. Higuchi Model for F6
%Cumulative Drug Release
Linear (%Cumulative Drug Release)
0.8 1 1.2
Fig.8Korsmeyer Peppas Model for Formulation F6
Log %cumulative drug release Linear (Log %cumulative drug release) 10 12
FIGURE 09 Hixson Crowell Model for Formulation
Cube root of % Drug Remaining
Linear (Cube root of % Drug Remaining) 98.2 98.4 98.6 98.8 99 99.2 99.4 99.6 99.8 Initially (0 days) After 1 Month
Drug content (%)
Fig-10 Percent Drug Content in F6 After Stability Studies
Values for Different Kinetic models of F6 Models
First
Order Higuchi’s KorsmeyerPeppas Hixson Crowell
0.896 0.855 0.927 0.951
The microspheres were subjected to In-vitro release studies by Hydrochloric acid and the data was shown in 7.1.8.5.b. When the amount of drug release values were plotted against time straight lines were obtained in all the cases indicating that the rate of drug release from these o order kinetics(Table-7.1.8.7 and To ascertain the mechanism of drug release from plot of log% Released vs log time plots) were drawn.
The plots were found to be
7.1.8.7.f). For the microspheres F6
the exponential coefficient values were found to be in
between 0.855 and 0.985, indicating a fiction diffusion
controlled release mechanism (Table-7.1.8.7.g). These
results indicated that the release rate was found to
increase in the concentration of coating
Accelerated Stability Studies
The microspheres from the selected and optimized batch
F6 was studied for stability and kept under the
accelerated conditions like raised temperature and
of three months. The results
revealed no marked alterations in physical appearance
and drug releasing properties
.Drug Release From Formulation F6 After Stability Studies of Three Months
% Cumulative Drug Released After 1st
Month
After 2nd
Month
After 3rd
Month
0 0 0
3.892 3.782 3.743
7.752 7.712 7.692
18.644 18.604 18.584
36.53 36.49 36.47
56.535 56.495 56.475
78.496 78.456 78.436
93.429 93.389 93.369
After 2Months
After 3Months
Drug content (%)
10 Percent Drug Content in F6 After Stability Studies
International Journal of Recent Scientific Research
Table16 Percent Drug Content in F6 After Stability Studies Optimized
Formulation
Drug content (%) Initially
(0 days)
After 1 Month
After 2Months
F6 99.73 99.25 98.97
CONCLUSION
The microsphere of Valacyclovir was obtained utilizing orifice ionic gelation technique using xanthan gum and sodium alginate as a polymer with various ratios. The prepared microspheres were free-flowing and not sticky
formulations were shown satisfactory result
results stated that the natural polymer can be used for sustaining the release of the drug. In the above view of findings, it can be suggested that sodium alginate, when combined with the hydrophilic natural gums, shows the synergistic effects and hence can be utilized to prolong the release of Valacyclovir. The overall frequency of administration of a drug candidate like Valacyclovir was reduced as compared to the conventional tablet dosage form. The improved patient convenience might thus
the administration of such a dosage form with minimal blood level fluctuations. Among the different combinations of natural polymers and drug, many combinations were shown optimum results. The release retardant materials are cheap, readily available, safe, having wide regulatory acceptance and easy to handle for the economic point of view. It may beneficial to adopt such simple technology for the commercial manufacture of persistent release microspheres. Floating microspheres of Valacyclovir showed good entrapment efficiency with good buoyancy. The release was also prolonged. The formulation variables helped to incorporate different drug content with the variable release with the size of microspheres. Conclusively, the formulation improves patient compliance, decreased dose frequency and will be useful in treatment strategy of simplex virus and varicella-zoster virus.
Cumulative % Drug Released At 0
20 40 60 80 100
0 1 2 3
4 6 8
10
Fig-11 Drug Release From Formulation F6 After Stability Studies of Three Months
Cumulative % Drug Released At 0thMonth
Cumulative % Drug Released After 1st Month
Cumulative % Drug Released After 2nd Month
Cumulative % Drug Released After 3rd Month
How to cite this article:
Rekha Choudhary et al.2018, A Systemic Approach For The Formulation of Floating Sci Res. 9(2), pp. 23848-23854. DOI: http://dx
ecent Scientific Research Vol. 9, Issue, 2(B), pp. 23848-23854, February, 2018
Percent Drug Content in F6 After Stability Studies Drug content (%)
After 2Months
After 3Months
98.97 98.72
of Valacyclovir was obtained utilizing orifice ionic gelation technique using xanthan gum and sodium alginate as a polymer with various ratios. The prepared not sticky. All the formulations were shown satisfactory results. The obtained results stated that the natural polymer can be used for In the above view of it can be suggested that sodium alginate, when combined with the hydrophilic natural gums, shows the cts and hence can be utilized to prolong the release of Valacyclovir. The overall frequency of administration of a drug candidate like Valacyclovir was tablet dosage form. The improved patient convenience might thus be obtained by the administration of such a dosage form with minimal blood Among the different combinations of natural many combinations were shown optimum The release retardant materials are cheap, readily vailable, safe, having wide regulatory acceptance and easy to It may beneficial to adopt such simple technology for the commercial manufacture Floating microspheres of showed good entrapment efficiency with good buoyancy. The release was also prolonged. The formulation variables helped to incorporate different drug content with the of microspheres. Conclusively, ient compliance, decreased dose frequency and will be useful in treatment strategy of Herpes
Reference
1. DeoreBV, Mahajan HS, Deore UV, Development and characterization of sustained release microspheres by quasi emulsion solvent diffusion method.
Journal of Chem Tech Research
2. Leuner C, Dressman J. Improving drug solubility for oral drug delivery using solid dispersions.
Sci. 2000; 50: 47-60.
3. Sharma.S, Bhardwaj.P, and Gupta.G.D; “Formulation, Evaluation & Optimization of Mouth Dissolving Tablets of Losartan Potassium: Effect of Co
Superdisintegrants”,
Pharmaceutical & Biological Archives 83
4. Choi BY, Park HJ, Hwang SJ, Park JB, Preparation of alginate beads for floating delivery system: effects of CO2 gas forming agents,
Pharmaceutics, 2002, 239
5. Syed E, Kishore VS, Sandeep M, Kartheek U, Rizwana SK, Tejaswi L, Preparation and evaluation of floating microspheres of ritonavir,
Research in Pharmacy and Chemistry 841.
6. Goel H, Vora N, Tiwari A.K, and
of orodispersible tablets of ondansetron HCl: investigations using
superdisintegrant”, Yakugaku 129(5):513-21.
7. Swamy P.V, Divate.S.P, Shirsand.S.B and Rajendra.P; “Preparation and Evaluation of Orodispersible Tablets of Pheniramine Maleate by Effervescent Method”,
Pharm Sci, 2009 Mar-Apr
8. Sharma S and Gupta GD; “Formulation and characterization of
fast-theoclate”, Asian J Pharm 9. Battu SK, Repka M.A
R.Y; “Formulation and evaluation of rapidly disintegrating fenoverin
superdisintegrants”, Drug Dev Ind Pharm 33(11):1225-32.
10. Najafi RB, Mostafavi A, Tavakoli N, Taymouri S, Shahraki MM, Preparation and in vitro in vivo evaluation of acyclovir floating tablets, Research in Pharmaceutical sciences
11. Husseiny RA, Lila ASA, Abdallah MH, Elghamry HA, worked on floating and evaluation of sustained release microspheres, International Journal of Trend in Research and Development
Cumulative % Drug Released At …
11 Drug Release From Formulation F6 After Stability
Cumulative % Drug Released At 0thMonth
Cumulative % Drug Released After 1st Month
Cumulative % Drug Released After 2nd Month
Cumulative % Drug Released After 3rd Month
*******
, A Systemic Approach For The Formulation of Floating Microspheres of Valacyclovir DOI: http://dx.doi.org/10.24327/ijrsr.2018.0902.1548
23854, February, 2018
Mahajan HS, Deore UV, Development and characterization of sustained release microspheres by solvent diffusion method. International Journal of Chem Tech Research, 2009,1(3), pp. 634-642 Leuner C, Dressman J. Improving drug solubility for
al drug delivery using solid dispersions. Eur J Pharm Sharma.S, Bhardwaj.P, and Gupta.G.D; “Formulation, Evaluation & Optimization of Mouth Dissolving Tablets of Losartan Potassium: Effect of Co-processed Superdisintegrants”, International Journal of Pharmaceutical & Biological Archives, 2010; 1(1): 76-Choi BY, Park HJ, Hwang SJ, Park JB, Preparation of alginate beads for floating delivery system: effects of CO2 gas forming agents, International Journal of
2002, 239, 81-91.
Syed E, Kishore VS, Sandeep M, Kartheek U, Rizwana SK, Tejaswi L, Preparation and evaluation of floating microspheres of ritonavir, International Journal of Research in Pharmacy and Chemistry, 2013, 3(4),
834-Tiwari A.K, and Rana.V; “Formulation of orodispersible tablets of ondansetron HCl: investigations using glycine-chitosan mixture as Yakugaku Zasshi. 2009 May; Swamy P.V, Divate.S.P, Shirsand.S.B and Rajendra.P; Preparation and Evaluation of Orodispersible Tablets of Pheniramine Maleate by Effervescent Method”, Indian J
Apr; 71(2): 151–154.
Sharma S and Gupta GD; “Formulation and -dissolving tablet of promethazine Asian J Pharm, 2008; 2:70-2.
Repka M.A, Majumdar.S, and Madhusudan ; “Formulation and evaluation of rapidly disintegrating fenoverine tablets: effect of Drug Dev Ind Pharm, 2007 Nov; Najafi RB, Mostafavi A, Tavakoli N, Taymouri S, Shahraki MM, Preparation and in vitro in vivo evaluation of acyclovir floating tablets, Research in
ces, 2017, 12(2), 128-136.
Husseiny RA, Lila ASA, Abdallah MH, Elghamry HA, worked on floating and evaluation of sustained release International Journal of Trend in Research and Development, 2017, 4(3), 356-359