VOLUME NO. 2 (2012), ISSUE NO. 9 (SEPTEMBER) ISSN2231-5756
A Monthly Double-Blind Peer Reviewed (Refereed/Juried) Open Access International e-Journal - Included in the International Serial Directories
Indexed & Listed at:
Ulrich's Periodicals Directory ©, ProQuest, U.S.A., EBSCO Publishing, U.S.A., Cabell’s Directories of Publishing Opportunities, U.S.A. as well as in Open J-Gage, India [link of the same is duly available at Inflibnet of University Grants Commission (U.G.C.)]
VOLUME NO. 2 (2012), ISSUE NO. 9 (SEPTEMBER) ISSN2231-5756
CONTENTS
CONTENTS
CONTENTS
CONTENTS
Sr.No.
TITLE & NAME OF THE AUTHOR (S)
Page No.
1. HIGH PERFORMANCE ORGANIZATION AND ORGANIZATIONAL EFFECTIVENESS IN BAPPEDA (DEVELOPMENT AND PLANNING BOARD), ACEH- INDONESIA
FIFI YUSMITA & DR. VIMALASANJEEVKUMAR
1
2. SOCIAL ENTREPRENEURS IN BANGLADESH DEWAN MAHBOOB HOSSAIN & MOINUL HOSSAIN
7 3. IMPACT OF WORKING CAPITAL MANAGEMENT ON FIRM’S PERFORMANCE: EVIDENCES FROM LISTED COMPANIES OF INDIA
DR. AVANISH KUMAR SHUKLA
13 4. ENGLISH TEACHERS’ EMOTIONAL INTELLIGENCE AND ITS IMPACT ON THEIR ORGANIZATIONAL CITIZENSHIP BEHAVIOUR IN SRI LANKAN
SCHOOLS
U.W.M.R. SAMPATH KAPPAGODA
18
5. A QUALITATIVE INQUIRY OF LEADERSHIP PRACTICES AND ITS BEHAVIORAL AND PSYCHOLOGICAL OUTCOMES MADIHAREHMANFAROOQUI
23 6. LINKING ORGANIZATIONAL CULTURE, STRUCTURE, AND ORGANIZATIONAL EFFECTIVENESS
FAKHRADDIN MAROOFI, AFSHINGHASEMI & SAMIRA DHGHANI
29 7. SWOT ANALYSIS: AN INSTRUMENT FOR STRATEGIC PLANNING – A CASE STUDY
GOMATESH M. RAVANAVAR & DR. POORNIMA M. CHARANTIMATH
35 8. THE ROLE OF HRM PRACTICES IN ORGANIZED RETAILING A STUDY OF SELECT RETAILERS IN BANGALORE CITY
LAKSHMI NARAYANA.K, DR. P. PARAMASHIVAIAH & DR. SREENIVAS. D. L
41 9. WATER CRISIS AT COAL CAPITAL OF INDIA: A PRAGMATIC STUDY OF ROOT CAUSES, IMPACT AND SOLUTION OF WATER CRISIS IN REGIONS
OF WORKING COAL MINES OF BHARAT COKING COAL LIMITED DHANBAD ABHINAV KUMAR SHRIVASTAVA & DR. N. C. PAHARIYA
46
10. PORTFOLIO MANAGEMENT OF INDIAN MUTUAL FUNDS: A STUDY ON DIVERSIFIED EQUITY FUNDS PERFORMANCE E. UMA REDDY & C. MADHUSUDANA REDDY
50 11. A STUDY OF DIFFERENCES IN PERCEPTION OF EMPLOYEES ABOUT THE HRD CLIMATE PREVAILS IN THE ENGINEERING INSTITUTE ON THE
BASIS OF AGE GROUP
MUKESH KUMAR PARASHAR & DR. MURLIDHAR PANGA
54
12. INSTITUTIONAL FINANCING OF AGRICULTURE IN INDIA WITH SPECIAL REFERENCE TO COMMERCIAL BANKS: PROBLEMS FACED BY FARMERS – AN EMPIRICAL STUDY
DR. KEWAL KUMAR & ATUL GAMBHIR
58
13. MULTIPLE FACETS OF ORGAN TRANSPLANTATION IN A TERTIARY CARE HOSPITAL MANAGEMENT, INDIA DR. PRAKASH.K.N, DR. CYNTHIA MENEZES, DR. ANNAPURNA RAMESH & S. HARISH BABU
61 14. FDI, TRADE, AND ECONOMIC GROWTH IN SINGAPORE--EVIDENCE FROM TIME-SERIES CAUSALITY ANALYSES
DR. G. JAYACHANDRAN
66 15. AN EVALUATION OF MICRO CREDIT IMPACT ON RURAL POOR WOMEN – A CASE STUDY IN BELLARY DISTRICT, KARNATAKA
K. S. PRAKASHA RAO
77 16. APPRECIATION AND APPREHENSIONS OF INDIAN CORPORATE SECTOR ABOUT CORPORATE SOCIAL RESPONSIBILITY
DR. B. M. HARSHAVARDHAN, DR. A. PRASAD & A V LAL
84 17. SOCIAL MEDIA MARKETING: THE NEXT FRONTIER (AN EXPLORATORY STUDY ON SOCIAL MEDIA MARKETING PROSPECTIVE WITH
REFERENCE TO PUNE CITY) GUNJN SINGH
92
18. ROLE OF INFORMATION TECHNOLOGY IN AGRICULTURE AND AGRO-BASED INDUSTRIES DR. B. RAMACHNADRA REDDY, E. LAVANYA & P. HUSSAIN BASHA
97 19. ADVENTURE TOURISM POTENTIAL: A STUDY OF KASHMIR
FARHAT BANO BEG & DR. ASHOK AIMA
99 20. INVENTORY MODEL IN A FUZZY ENVIRONMENT WITH ITS ASSOCIATED COSTS IN EXPONENTIAL MEMBERSHIP FUNCTIONS
K. PUNNIAKRISHNAN & K. KADAMBAVANAM
102 21. EMPLOYEES PERSPECTIVE VIEW TOWARDS PERFORMANCE APPRAISAL AND TRAINING PROGRAMMES PRACTICED IN SUGAR INDUSTRIES
IN ERODE DISTRICT
M. SELVI SRIDEVI & DR. L. MANIVANNAN
107
22. INTEREST IN MANAGEMENT EDUCATION: THE CURRENT TREND AND ITS IMPLICATIONS VIJENDRA KUMAR S. K. & ANCY MATHEW
116 23. IMPACT OF CORPORATE GOVERNANCE PRACTICES ON THE FIRM PERFORMANCE: AN EMPIRICAL EVIDENCE OF THE SMALL AND MEDIUM
ENTERPRISES IN INDIA
PARTHA SARATHI PATTNAYAK & DR. PRIYA RANJAN DASH
119
24. A REVIEW OF HUMAN ERROR IN MAINTENANCE AND SAFETY ROSHAN KURUVILA
124 25. SEARCH-EXPERIENCE FRAMEWORK: A CASE OF MOVIE INDUSTRY
T. SAI VIJAY & TANUSHREE GOSWAMI
127 26. GENDER EQUALITY AND INCLUSIVE GROWTH: IN CASE OF PUNJAB
DR. SANGEETA NAGAICH & PREETI SHARMA
132 27. ESTIMATION OF POPULATION MEAN USING RANKED SET SAMPLING
DR. SUNIL KUMAR, DR. SANDEEP BHOUGAL & RAHUL KUMAR SHARMA & DR. KULDIP RAJ
139 28. A GOAL PROGRAMMING FORMULATION IN NUTRIENT MANAGEMENT OF FERTILIZERS USED FOR RUBBER PLANTATION IN TRIPURA
NABENDU SEN & MANISH NANDI
142 29. A STUDY ON THE FACTORS INFLUENCING INDIVIDUAL INVESTOR BEHAVIOR IN IT SECTOR
SINDU KOPPA & SHALINI .P
145 30. RELIGION, LAW & THE ROLE OF STATE
NITUJA KUMARI & MOHD YASIN WANI
150
VOLUME NO. 2 (2012), ISSUE NO. 9 (SEPTEMBER) ISSN2231-5756
INTERNATIONAL JOURNAL OF RESEARCH IN COMMERCE, IT & MANAGEMENT
CHIEF PATRON
CHIEF PATRON
CHIEF PATRON
CHIEF PATRON
PROF. K. K. AGGARWAL
Chancellor, Lingaya’s University, Delhi
Founder Vice-Chancellor, Guru Gobind Singh Indraprastha University, Delhi
Ex. Pro Vice-Chancellor, Guru Jambheshwar University, Hisar
FOUNDER
FOUNDER
FOUNDER
FOUNDER PATRON
PATRON
PATRON
PATRON
LATE SH. RAM BHAJAN AGGARWAL
Former State Minister for Home & Tourism, Government of Haryana
Former Vice-President, Dadri Education Society, Charkhi Dadri
Former President, Chinar Syntex Ltd. (Textile Mills), Bhiwani
CO
CO
CO
CO----ORDINATOR
ORDINATOR
ORDINATOR
ORDINATOR
AMITA
Faculty, Government M. S., Mohali
ADVISORS
ADVISORS
ADVISORS
ADVISORS
DR. PRIYA RANJAN TRIVEDI
Chancellor, The Global Open University, Nagaland
PROF. M. S. SENAM RAJU
Director A. C. D., School of Management Studies, I.G.N.O.U., New Delhi
PROF. M. N. SHARMA
Chairman, M.B.A., Haryana College of Technology & Management, Kaithal
PROF. S. L. MAHANDRU
Principal (Retd.), Maharaja Agrasen College, Jagadhri
EDITOR
EDITOR
EDITOR
EDITOR
PROF. R. K. SHARMA
Professor, Bharti Vidyapeeth University Institute of Management & Research, New Delhi
CO
CO
CO
CO----EDITOR
EDITOR
EDITOR
EDITOR
DR. BHAVET
Faculty, M. M. Institute of Management, Maharishi Markandeshwar University, Mullana, Ambala, Haryana
EDITORIAL ADVISORY BOARD
EDITORIAL ADVISORY BOARD
EDITORIAL ADVISORY BOARD
EDITORIAL ADVISORY BOARD
DR. RAJESH MODI
Faculty, Yanbu Industrial College, Kingdom of Saudi Arabia
PROF. SANJIV MITTAL
University School of Management Studies, Guru Gobind Singh I. P. University, Delhi
PROF. ANIL K. SAINI
Chairperson (CRC), Guru Gobind Singh I. P. University, Delhi
DR. SAMBHAVNA
Faculty, I.I.T.M., Delhi
DR. MOHENDER KUMAR GUPTA
VOLUME NO. 2 (2012), ISSUE NO. 9 (SEPTEMBER) ISSN2231-5756
DR. SHIVAKUMAR DEENE
Asst. Professor, Dept. of Commerce, School of Business Studies, Central University of Karnataka, Gulbarga
MOHITA
Faculty, Yamuna Institute of Engineering & Technology, Village Gadholi, P. O. Gadhola, Yamunanagar
ASSOCIATE EDITORS
ASSOCIATE EDITORS
ASSOCIATE EDITORS
ASSOCIATE EDITORS
PROF. NAWAB ALI KHAN
Department of Commerce, Aligarh Muslim University, Aligarh, U.P.
PROF. ABHAY BANSAL
Head, Department of Information Technology, Amity School of Engineering & Technology, Amity University, Noida
PROF. A. SURYANARAYANA
Department of Business Management, Osmania University, Hyderabad
DR. SAMBHAV GARG
Faculty, M. M. Institute of Management, Maharishi Markandeshwar University, Mullana, Ambala, Haryana
PROF. V. SELVAM
SSL, VIT University, Vellore
DR. PARDEEP AHLAWAT
Associate Professor, Institute of Management Studies & Research, Maharshi Dayanand University, Rohtak
DR. S. TABASSUM SULTANA
Associate Professor, Department of Business Management, Matrusri Institute of P.G. Studies, Hyderabad
SURJEET SINGH
Asst. Professor, Department of Computer Science, G. M. N. (P.G.) College, Ambala Cantt.
TECHNICAL ADVISOR
TECHNICAL ADVISOR
TECHNICAL ADVISOR
TECHNICAL ADVISOR
AMITA
Faculty, Government H. S., Mohali
MOHITA
Faculty, Yamuna Institute of Engineering & Technology, Village Gadholi, P. O. Gadhola, Yamunanagar
FINANCIAL ADVISORS
FINANCIAL ADVISORS
FINANCIAL ADVISORS
FINANCIAL ADVISORS
DICKIN GOYAL
Advocate & Tax Adviser, Panchkula
NEENA
Investment Consultant, Chambaghat, Solan, Himachal Pradesh
LEGAL ADVISORS
LEGAL ADVISORS
LEGAL ADVISORS
LEGAL ADVISORS
JITENDER S. CHAHAL
Advocate, Punjab & Haryana High Court, Chandigarh U.T.
CHANDER BHUSHAN SHARMA
Advocate & Consultant, District Courts, Yamunanagar at Jagadhri
SUPERINTENDENT
SUPERINTENDENT
SUPERINTENDENT
SUPERINTENDENT
SURENDER KUMAR POONIA
VOLUME NO. 2 (2012), ISSUE NO. 9 (SEPTEMBER) ISSN2231-5756
INTERNATIONAL JOURNAL OF RESEARCH IN COMMERCE, IT & MANAGEMENT
CALL FOR MANUSCRIPTS
CALL FOR MANUSCRIPTS
CALL FOR MANUSCRIPTS
CALL FOR MANUSCRIPTS
Weinvite unpublished novel, original, empirical and high quality research work pertaining to recent developments & practices in the area of Computer, Business, Finance, Marketing, Human Resource Management, General Management, Banking, Insurance, Corporate Governance and emerging paradigms in allied subjects like Accounting Education; Accounting Information Systems; Accounting Theory & Practice; Auditing; Behavioral Accounting; Behavioral Economics; Corporate Finance; Cost Accounting; Econometrics; Economic Development; Economic History; Financial Institutions & Markets; Financial Services; Fiscal Policy; Government & Non Profit Accounting; Industrial Organization; International Economics & Trade; International Finance; Macro Economics; Micro Economics; Monetary Policy; Portfolio & Security Analysis; Public Policy Economics; Real Estate; Regional Economics; Tax Accounting; Advertising & Promotion Management; Business Education; Management Information Systems (MIS); Business Law, Public Responsibility & Ethics; Communication; Direct Marketing; E-Commerce; Global Business; Health Care Administration; Labor Relations & Human Resource Management; Marketing Research; Marketing Theory & Applications; Non-Profit Organizations; Office Administration/Management; Operations Research/Statistics; Organizational Behavior & Theory; Organizational Development; Production/Operations; Public Administration; Purchasing/Materials Management; Retailing; Sales/Selling; Services; Small Business Entrepreneurship; Strategic Management Policy; Technology/Innovation; Tourism, Hospitality & Leisure; Transportation/Physical Distribution; Algorithms; Artificial Intelligence; Compilers & Translation; Computer Aided Design (CAD); Computer Aided Manufacturing; Computer Graphics; Computer Organization & Architecture; Database Structures & Systems; Digital Logic; Discrete Structures; Internet; Management Information Systems; Modeling & Simulation; Multimedia; Neural Systems/Neural Networks; Numerical Analysis/Scientific Computing; Object Oriented Programming; Operating Systems; Programming Languages; Robotics; Symbolic & Formal Logic and Web Design. The above mentioned tracks are only indicative, and not exhaustive.
Anybody can submit the soft copy of his/her manuscript anytime in M.S. Word format after preparing the same as per our submission guidelines duly available on our website under the heading guidelines for submission, at the email address: [email protected].
GUIDELINES FOR SUBM
GUIDELINES FOR SUBM
GUIDELINES FOR SUBM
GUIDELINES FOR SUBMISSION OF MANUSCRIPT
ISSION OF MANUSCRIPT
ISSION OF MANUSCRIPT
ISSION OF MANUSCRIPT
1. COVERING LETTER FOR SUBMISSION:
DATED: _____________ THE EDITOR
IJRCM
Subject: SUBMISSION OF MANUSCRIPT IN THE AREA OF .
(e.g. Finance/Marketing/HRM/General Management/Economics/Psychology/Law/Computer/IT/Engineering/Mathematics/other, please specify)
DEAR SIR/MADAM
Please find my submission of manuscript entitled ‘___________________________________________’ for possible publication in your journals.
I hereby affirm that the contents of this manuscript are original. Furthermore, it has neither been published elsewhere in any language fully or partly, nor is it under review for publication elsewhere.
I affirm that all the author (s) have seen and agreed to the submitted version of the manuscript and their inclusion of name (s) as co-author (s).
Also, if my/our manuscript is accepted, I/We agree to comply with the formalities as given on the website of the journal & you are free to publish our contribution in any of your journals.
NAME OF CORRESPONDING AUTHOR:
Designation:
Affiliation with full address, contact numbers & Pin Code: Residential address with Pin Code:
Mobile Number (s): Landline Number (s): E-mail Address: Alternate E-mail Address:
NOTES:
a) The whole manuscript is required to be in ONE MS WORD FILE only (pdf. version is liable to be rejected without any consideration), which will start from the covering letter, inside the manuscript.
b) The sender is required to mention the following in the SUBJECT COLUMN of the mail:
New Manuscript for Review in the area of (Finance/Marketing/HRM/General Management/Economics/Psychology/Law/Computer/IT/
Engineering/Mathematics/other, please specify)
c) There is no need to give any text in the body of mail, except the cases where the author wishes to give any specific message w.r.t. to the manuscript. d) The total size of the file containing the manuscript is required to be below 500 KB.
e) Abstract alone will not be considered for review, and the author is required to submit the complete manuscript in the first instance.
f) The journal gives acknowledgement w.r.t. the receipt of every email and in case of non-receipt of acknowledgment from the journal, w.r.t. the submission of manuscript, within two days of submission, the corresponding author is required to demand for the same by sending separate mail to the journal.
2. MANUSCRIPT TITLE: The title of the paper should be in a 12 point Calibri Font. It should be bold typed, centered and fully capitalised.
3. AUTHOR NAME (S) & AFFILIATIONS: The author (s) full name, designation, affiliation (s), address, mobile/landline numbers, and email/alternate email address should be in italic & 11-point Calibri Font. It must be centered underneath the title.
4. ABSTRACT: Abstract should be in fully italicized text, not exceeding 250 words. The abstract must be informative and explain the background, aims, methods,
VOLUME NO. 2 (2012), ISSUE NO. 9 (SEPTEMBER) ISSN2231-5756
5. KEYWORDS: Abstract must be followed by a list of keywords, subject to the maximum of five. These should be arranged in alphabetic order separated by commas and full stops at the end.
6. MANUSCRIPT: Manuscript must be in BRITISH ENGLISH prepared on a standard A4 size PORTRAIT SETTING PAPER. It must be prepared on a single space and
single column with 1” margin set for top, bottom, left and right. It should be typed in 8 point Calibri Font with page numbers at the bottom and centre of every page. It should be free from grammatical, spelling and punctuation errors and must be thoroughly edited.
7. HEADINGS: All the headings should be in a 10 point Calibri Font. These must be bold-faced, aligned left and fully capitalised. Leave a blank line before each
heading.
8. SUB-HEADINGS: All the sub-headings should be in a 8 point Calibri Font. These must be bold-faced, aligned left and fully capitalised.
9. MAIN TEXT: The main text should follow the following sequence:
INTRODUCTION
REVIEW OF LITERATURE
NEED/IMPORTANCE OF THE STUDY
STATEMENT OF THE PROBLEM
OBJECTIVES
HYPOTHESES
RESEARCH METHODOLOGY
RESULTS & DISCUSSION
FINDINGS
RECOMMENDATIONS/SUGGESTIONS
CONCLUSIONS
SCOPE FOR FURTHER RESEARCH
ACKNOWLEDGMENTS
REFERENCES
APPENDIX/ANNEXURE
It should be in a 8 point Calibri Font, single spaced and justified. The manuscript should preferably not exceed 5000 WORDS.
10. FIGURES & TABLES: These should be simple, crystal clear, centered, separately numbered & self explained, and titles must be above the table/figure. Sources of data should be mentioned below the table/figure. It should be ensured that the tables/figures are referred to from the main text.
11. EQUATIONS: These should be consecutively numbered in parentheses, horizontally centered with equation number placed at the right.
12. REFERENCES: The list of all references should be alphabetically arranged. The author (s) should mention only the actually utilised references in the preparation
of manuscript and they are supposed to follow Harvard Style of Referencing. The author (s) are supposed to follow the references as per the following:
•
All works cited in the text (including sources for tables and figures) should be listed alphabetically.•
Use (ed.) for one editor, and (ed.s) for multiple editors.•
When listing two or more works by one author, use --- (20xx), such as after Kohl (1997), use --- (2001), etc, in chronologically ascending order.•
Indicate (opening and closing) page numbers for articles in journals and for chapters in books.•
The title of books and journals should be in italics. Double quotation marks are used for titles of journal articles, book chapters, dissertations, reports, working papers, unpublished material, etc.•
For titles in a language other than English, provide an English translation in parentheses.•
The location of endnotes within the text should be indicated by superscript numbers.PLEASE USE THE FOLLOWING FOR STYLE AND PUNCTUATION IN REFERENCES: BOOKS
•
Bowersox, Donald J., Closs, David J., (1996), "Logistical Management." Tata McGraw, Hill, New Delhi.•
Hunker, H.L. and A.J. Wright (1963), "Factors of Industrial Location in Ohio" Ohio State University, Nigeria.CONTRIBUTIONS TO BOOKS
•
Sharma T., Kwatra, G. (2008) Effectiveness of Social Advertising: A Study of Selected Campaigns, Corporate Social Responsibility, Edited by David Crowther & Nicholas Capaldi, Ashgate Research Companion to Corporate Social Responsibility, Chapter 15, pp 287-303.JOURNAL AND OTHER ARTICLES
•
Schemenner, R.W., Huber, J.C. and Cook, R.L. (1987), "Geographic Differences and the Location of New Manufacturing Facilities," Journal of Urban Economics, Vol. 21, No. 1, pp. 83-104.CONFERENCE PAPERS
•
Garg, Sambhav (2011): "Business Ethics" Paper presented at the Annual International Conference for the All India Management Association, New Delhi, India, 19–22 June.UNPUBLISHED DISSERTATIONS AND THESES
•
Kumar S. (2011): "Customer Value: A Comparative Study of Rural and Urban Customers," Thesis, Kurukshetra University, Kurukshetra.ONLINE RESOURCES
•
Always indicate the date that the source was accessed, as online resources are frequently updated or removed.WEBSITES
VOLUME NO. 2 (2012), ISSUE NO. 9 (SEPTEMBER) ISSN2231-5756
INTERNATIONAL JOURNAL OF RESEARCH IN COMMERCE, IT & MANAGEMENT
EMPLOYEES PERSPECTIVE VIEW TOWARDS PERFORMANCE APPRAISAL AND TRAINING PROGRAMMES
PRACTICED IN SUGAR INDUSTRIES IN ERODE DISTRICT
M. SELVI SRIDEVI
LECTURER
J.K.K. MUNIRAJAH COLLEGE OF TECHNOLOGY
T.N. PALAYAM
DR. L. MANIVANNAN
ASSOCIATE PROFESSOR
ERODE ARTS COLLEGE
ERODE
ABSTRACT
Performance appraisal is one of the most broadly researched human resource management practices. This paper research on employees’ perspective view towards performance appraisal and training programmes practised in sugar industries in Erode District. This paper examined the interdependence of Independent factors and the respondents’ level of satisfaction on Performance Appraisal and Training Programmes aspect of technical measurement issues and problems, and was followed by an attack of research related to the contact of Cognitive processes on performance appraisals system. The sample was selected on the basis of stratified random sampling method. The study used self-administered structured questionnaire as the research instrument. The data obtained were analyzed using descriptive and inferential statistics. The focus of the performance appraisals and training programmes are turning towards career development relying on the dialogues and discussions with the superiors. Hence, the present study concentrated in aspects/ measure the interdependence of the independent factors of the respondents’ level of satisfaction with the Performance Appraisal and Training Programmes practises, the results were subjected to multiple regression analysis. If satisfaction accounts for the merits of the respondents’ performance appraisal, dissatisfaction accounts for the problems in using it. Hence, the routine problems faced by the respondents in using performance appraisal system and training programmes were studied under Henry Garrett ranking method.
KEYWORDS
Career Development, Henry Garrett Ranking Method, Performance Appraisal and Training Programmes, Multiple Regression Analysis, Performance Appraisal System (PAS).
1.
INTRODUCTION
erformance appraisal means evaluating an employee’s current and/or past performance relative to his or her performance standards. The present study was undertaken in the selected Sugar companies in Erode District, Tamilnadu state viz. Sakthi Sugars Ltd., Sakthi Nagar, Bhavani and Bannari Amman Sugars Ltd., Allathukombai, Sathyamangalam. These sugar companies are biggest employer of the people and act as a model employer in respect of salary and other facilities to the employees. If these companies have to cope up with the competitive environment and make rapid step, they have to develop their human resources effectively besides taking care of other resources. Needless to mention that, the growth and viability of the organization depend upon the quality of its human resources. In this context, the policies and practices of performance appraisal and training programmes play a vital role. Further, implementation of these policies and practices depend upon attitude and support of the employees. Hence, the present study concentrated in HRD aspect to measure the interdependence of the independent factors viz., Age, Designation/grade, Department, Educational Qualification, Marital Status, Family Size, Type of Family, Scale of Pay, Experience , Workers Performance, Labour Welfare Measures of the respondents’ level of satisfaction with the Performance Appraisal and Training Programmes practices and the routine problems faced by the respondents in using performance appraisal and training programmes were studied. For this purpose, seven major Performance Appraisal System problems were chosen by the researcher. They were No recognition for supervisor, Biased in communication, Difficult to comparison, Assessment becomes vague, Attributes/traits were vague, Potentialities were ignored and Raters errors and also the routine problems faced by the respondents in training programme were studied. For this purpose, five major problems were chosen by the researcher, viz., Lack of impressive teaching ,Advanced topics cannot be taught by the trainer, Poor communication, Training environment is artificially created and Excessive Stress.
2.
REVIEW OF LITERATURE
Randell, D.L. (1973)1 in his paper titled ““Performance appraisal: purposes, practices and conflicts”, discusses the collection of information from and about
people at work. It attempts to structure the field, define key problems, expose sources of conflict and point the way to resolving major difficulties.
Bedeian (1976)2 in his paper titled “Rater Characteristics Affecting the Validity of Performance Appraisals” states that the task of developing effective performance appraisal systems is one of the most preferred contemporary problems of personnel administration. An abundance of literature is available detailing the problems and difficulties inherent in subordinate appraisals. Numerous studies have made suggestions for rating format and content changes. Some have even suggested the elimination of appraisal. More recently, an identifiable body of knowledge which seriously casts doubt on the use of supervisor’s judgment in evaluating employee performance has begun to emerge. The purpose of this paper is to explore this emerging body of knowledge and to examine its ramifications for performance appraisal
Davis and Mount (1984)3 in their study evaluated the effectiveness of performance appraisal training in an organizational setting. Four hundred and two middle
level managers were randomly assigned to one of the three conditions: no training, computer assisted instruction only (CAI), or CAI training plus a behavior modeling workshop (CAIW). Training effectiveness was assessed on two categories of dependent variables, managerial learning and managerial job performance. As predicted trained managers were found to be more knowledgeable of performance appraisal than untrained managers. Also as predicted, managers in the CAIW group conducted appraisal discussions which were perceived by employees as more satisfying than employees of managers in the no training group. Only partial support was obtained for the hypothesis that trained managers would be more effective in completing performance appraisal forms.
Clinton O. Longenecker and Laurence S. Fink (1999)4 in their article entitled “Creating Effective Performance Appraisals”, indicate that performance appraisals
can be a good way for organizations to boost employees' motivation and hone their competitive edge. But creating useful performance appraisals -- and making
1
Randel, D.L. “Performance appraisal: purposes, practices and conflicts”, Occupational Psychology, Vol. 47, 1973, pp.221-224.
2 Arthur G. Bedeian, “Rater Characteristics Affecting the Validity of Performance Appraisals”, Journal of Management, Vol.2, 1976 pp. 37-45
3
Brian L. Davis, Michael K. Mount, “Effectiveness of Performance Appraisal Training Using Computer Assisted Instruction and Behavior Modeling”,
Personnel Psychology, Vol. 37, No. 3, 1984, pp. 439-452.
4 Clinton O. Longenecker and Laurence S. Fink, “Creating Effective Performance Appraisals”, Industrial Management, September 1 1999.
VOLUME NO. 2 (2012), ISSUE NO. 9 (SEPTEMBER) ISSN2231-5756 sure they are used effectively throughout an organization -- isn't easy. The 10 lessons here can help a company move closer to appraisals that help staff perform their best.
3.
NEED FOR THE STUDY
Performance Appraisal is a systematic objective way of judging the relative worth or ability of an employee in performing a job Performance appraisal provides information about the performance ranks based on which decisions regarding salary fixation, confirmation, promotion, transfer and demotion are taken. It provides feedback information about the level of achievement and behavior of subordinates. This information helps to review the performance of the subordinate, rectify performance deficiencies and set new standards of work, if necessary. Further, it helps to counsel the subordinates and to diagnose deficiency in employee regarding skill, knowledge, determine training and development needs and to prescribe the means for employee growth and provide information for correcting placement.
Performance appraisal offers a competitive advantage to a firm by improving performance, helping make correct decisions, ensuring legal compliance, minimizing job dissatisfaction and employee turnover and ensuring consistency between organizational strategy and behaviour.
4.
STATEMENT OF THE PROBLEM
Performance appraisal is a systematic way of judging the relative worth of an employee in performing his/her tasks. It helps to identify the employees’
(Strength), who are performing the given task well and also those who are not able to achieve. The reasons for such (poor) performance over the period are
recorded and necessary steps taken to equip the employees where they are weak and unable to cope with the organization’s task. Since, its formal introduction in 1920, Performance Appraisal has undergone tremendous changes in terms of its concept and philosophy.
Basically in all introductions, the appraisal on performance has been practised to assess the knowledge, skill and involvement of an employee towards the jobs assigned to him/her, which enables the employer to decide the structure of their salary and promotion. The Performance Appraisal is done to identify the employees’ weakness and train them to acquire technical knowledge and skills.
In order to ascertain the problems in performance appraisal and training programmes practised in sugar industries of Erode District, the research has mainly focused on the performance appraisal system and its functioning in sugar industries. Further, it has collected the opinion of the employees regarding performance appraisal.
On certain occasions, the employees are exhibiting their full talents. At this juncture, it is very difficult to measure accurately or appraise the potential of each and every employee working in the study area (i.e. Sugar industries). Based on the above issues, the following questions were probed.
1. How far the Performance Appraisal is measured in the selected sugar industries?
2. What are the problems faced by the respondents in using traditional method or modern method of appraising the potential of employees working in sugar
industries in Erode District?
5.
OBJECTIVES OF THE STUDY
The following are only a part of the main objectives of the study.
• To find out the relationship between various factors that influence that Performance Appraisal and Training Programme practises in sugar industries in Erode District.
• To find out the main factors that affects the Performance Appraisal and Training Programmes
• To study the routine problems faced by the respondents in using Performance Appraisal System and Training Programmes.
• To appraise employees performance and provide the feedback to employees.
6.
STUDY AREA
For the purpose of this study, “Sakthi Sugars Ltd., Sakthi Nagar, Appakudal, Bhavani” and “Bannari Amman Sugars Ltd., Allathukombai, Sathyamangalam” in Erode District, Tamil Nadu have been chosen purposively, due to their reputation. The time period considered for the study is limited to 3 years from 2009-2012.
7.
RESEARCH METHODOLOGY
The present study is designed as a descriptive approach. It has been carried out on the basis of secondary as well as primary data.
PRIMARY DATA
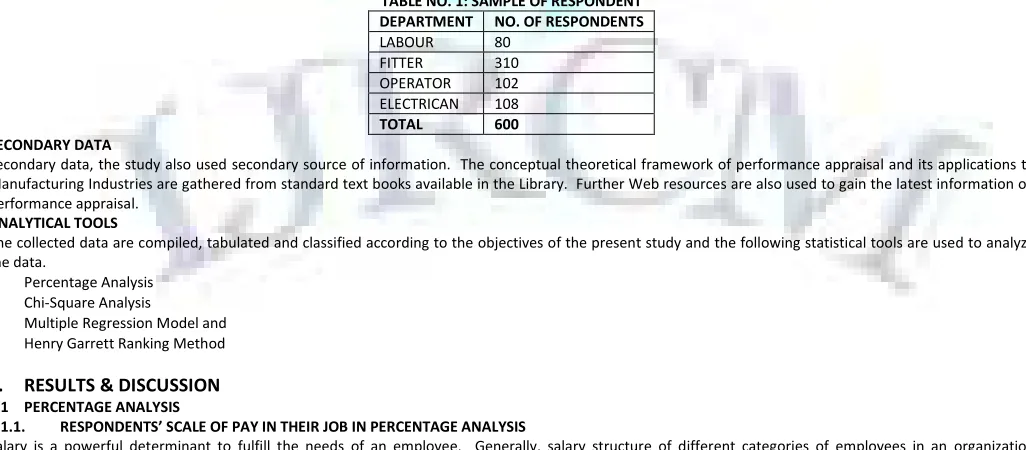
Primary data were collected with the help of a well structured questionnaire from 600 sample respondents. For this purpose, stratified random sampling method was employed by selecting respondents from four major departments. The distribution of sample respondents according to their respective departments is furnished in the following table.
TABLE NO. 1: SAMPLE OF RESPONDENT DEPARTMENT NO. OF RESPONDENTS
LABOUR 80
FITTER 310
OPERATOR 102
ELECTRICAN 108
TOTAL 600 SECONDARY DATA
Secondary data, the study also used secondary source of information. The conceptual theoretical framework of performance appraisal and its applications to Manufacturing Industries are gathered from standard text books available in the Library. Further Web resources are also used to gain the latest information on performance appraisal.
ANALYTICAL TOOLS
The collected data are compiled, tabulated and classified according to the objectives of the present study and the following statistical tools are used to analyze the data.
• Percentage Analysis
• Chi-Square Analysis
• Multiple Regression Model and
• Henry Garrett Ranking Method
8.
RESULTS & DISCUSSION
8.1 PERCENTAGE ANALYSIS
8.1.1. RESPONDENTS’ SCALE OF PAY IN THEIR JOB IN PERCENTAGE ANALYSIS
VOLUME NO. 2 (2012), ISSUE NO. 9 (SEPTEMBER) ISSN2231-5756
INTERNATIONAL JOURNAL OF RESEARCH IN COMMERCE, IT & MANAGEMENT
categories namely, i) Below Rs.4000 ii) Rs. 4001 – 6000 iii)6001 – 8000 and iv) Above Rs.8000. If the employees get more salary, their performance and their satisfaction level is more. This study aims in deriving the employees’ scale of pay and their level of satisfaction towards their job and it is displayed in the following table 10.1.1.TABLE NO. 2: RESPONDENTS’ SCALE OF PAY AND THEIR LEVEL OF SATISFACTION ABOUT THEIR JOB S.
No.
Scale of pay Bannari Amman Sugars Sakthi Sugars
No. of Respondents Percentage (%) No. of Respondents Percentage (%)
1. Below Rs.4000 27 9.0 21 7.0
2. Rs.4001-6000 42 14.0 32 10.7
3. Rs.6001-8000 75 25.0 38 12.7
4. Above Rs.8000 156 52.0 209 69.7
Total 300 100.0 300 100.0
The above table reveals that out of 600 respondents, 300 respondents are working in Bannari Amman Sugars Ltd., and 300 respondents are working in Sakthi sugars Ltd. In Bannari Amman Sugars Ltd, out of 300 samples 27(9.0%) respondents earn less than Rs.4000, 42(14%) respondents earn between Rs.4001 – 6000, 75 (25%) respondents earn between Rs.6001 – 8000 and 156 (52%) respondents earn more than Rs.8000.In Sakthi Sugars Ltd., out of 300 samples 21 (7.0%) respondents earn less than Rs.4000, 32 (10.7%) respondents earn between Rs.4001 – 6000, 38 (12.7%) respondents earn between Rs. 6001 – 8000 and 209(69.7%) respondents earn more than Rs.8000.
8.2 CHI-SQUARE TESTS HYPOTHESIS- I
Null hypothesis H0 : There is no significant relationship between age and level of satisfaction with existing performance appraisal system.
Alternative hypothesis H1: There is significant relationship between age and level of satisfaction with existing performance appraisal system.
TABLE NO.3: AGE AND LEVEL OF SATISFACTION WITH EXISTING PERFORMANCE APPRAISAL SYSTEM S.
No.
Age No. of Respondents % Ave rage Range S.D Min Max
1. Below 35 yrs. 74 12.3 51.8 48 60 4.4
2. 26-35 yrs. 163 27.2 52.7 46 60 3.8
3. 36-45 yrs. 254 42.3 52.0 48 60 4.5
4. Above 45 yrs. 109 18.2 53.6 48 60 4.0
Total 600 100.0
TABLE NO. 4: AGE AND LEVEL OF SATISFACTION WITH EXISTING PERFORMANCE APPRAISAL SYSTEM (TWO – WAY TABLE) S.
No.
Age Level of satisfaction with existing Performance Appraisal System Total
Low Medium High
1. Below 25 yrs. 29
(39.2) 31 (41.9) 14 (18.9) 74
2. 26-35 yrs. 38
(23.3) 86 (52.8) 39 (23.9) 163
3. 36-45 yrs. 108
(42.5) 94 (37.0) 52 (20.5) 254
4. Above 45 yrs. 24
(22.0) 63 (57.8) 22 (20.2) 109
Total 199 274 127 600
TABLE NO.5: AGE AND LEVEL OF SATISFACTION WITH EXISTING PERFORMANCE APPRAISAL SYSTEM (CHI – SQUARE TEST) Factor Calculated χχχχ2 Value Table Value D.F Remarks
Age 26.946 12.592 6 Significant at 5% level
Result: Since the χ2value is greater than table value, the null hypothesis is rejected. Hence, there is a significant relationship between age and level of satisfaction with existing performance appraisal system practised in the selected sugar industries.
HYPOTHESIS- II
Null hypothesis H0: There is no significant relationship between designation and level of satisfaction with existing performance appraisal system.
Alternative hypothesis H1: There is significant relationship between designation and level of satisfaction with existing performance appraisal system.
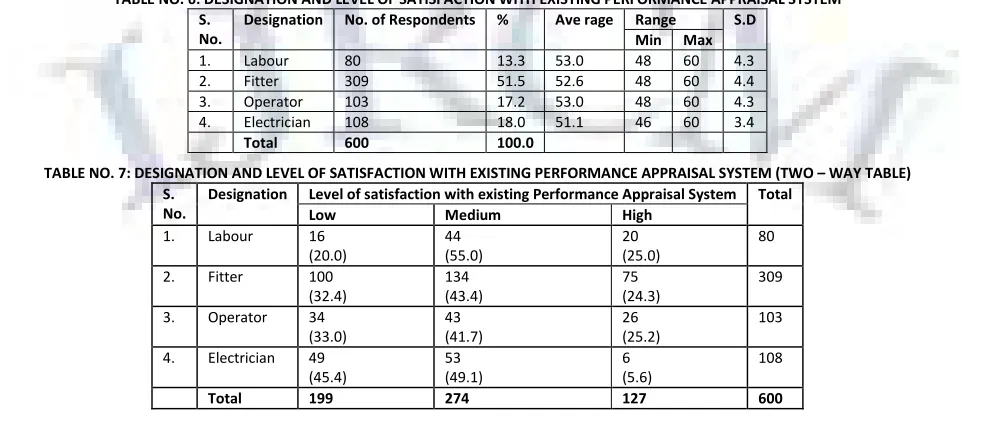
TABLE NO. 6: DESIGNATION AND LEVEL OF SATISFACTION WITH EXISTING PERFORMANCE APPRAISAL SYSTEM S.
No.
Designation No. of Respondents % Ave rage Range S.D Min Max
1. Labour 80 13.3 53.0 48 60 4.3
2. Fitter 309 51.5 52.6 48 60 4.4
3. Operator 103 17.2 53.0 48 60 4.3
4. Electrician 108 18.0 51.1 46 60 3.4
Total 600 100.0
TABLE NO. 7: DESIGNATION AND LEVEL OF SATISFACTION WITH EXISTING PERFORMANCE APPRAISAL SYSTEM (TWO – WAY TABLE) S.
No.
Designation Level of satisfaction with existing Performance Appraisal System Total
Low Medium High
1. Labour 16
(20.0) 44 (55.0) 20 (25.0) 80
2. Fitter 100
(32.4) 134 (43.4) 75 (24.3) 309
3. Operator 34
(33.0) 43 (41.7) 26 (25.2) 103
4. Electrician 49
(45.4) 53 (49.1) 6 (5.6) 108
VOLUME NO. 2 (2012), ISSUE NO. 9 (SEPTEMBER) ISSN2231-5756
TABLE NO. 8: DESIGNATION AND LEVEL OF SATISFACTION WITH EXISTING PERFORMANCE APPRAISAL SYSTEM (CHI – SQUARE TEST) Factor Calculated χχχχ2 Value Table Value D.F Remarks
Designation 26.804 12.592 6 Significant at 5% level
Result: Since the χ2value is greater than table value, the null hypothesis is rejected. There is a close relationship between designation of the respondents and their level of satisfaction towards performance appraisal system practised in the selected sugar industries.
HYPOTHESIS- III
Null hypothesis H0 : There is no significant relationship between department and level of satisfaction with existing performance appraisal system.
Alternative hypothesis H1: There is significant relationship between department and level of satisfaction with existing performance appraisal system.
TABLE NO. 9: DEPARTMENT AND LEVEL OF SATISFACTION WITH EXISTING PERFORMANCE APPRAISAL SYSTEM S.
No.
Department No. of Respondents % Ave rage Range S.D Min Max
1. Electrical 153 25.5 51.4 48 57 3.1
2. Engineering 255 42.5 53.3 46 60 4.9
3. Administration 100 16.7 50.6 48 60 3.0
4. Distillery 92 15.3 53.9 48 60 4.0
Total 600 100.0
TABLE NO. 10: DEPARTMENT AND LEVEL OF SATISFACTION WITH EXISTING PERFORMANCE APPRAISAL SYSTEM (TWO – WAY TABLE) S.
No.
Department Level of satisfaction with existing Performance Appraisal System Total
Low Medium High
1. Electrical 53
(34.6) 82 (53.6) 18 (11.8) 153
2. Engineering 78
(30.6) 97 (38.0) 80 (31.4) 255
3. Administration 51
(51.0) 41 (41.0) 8 (8.0) 100
4. Distillery 17
(18.5) 54 (58.7) 21 (22.8) 92
Total 199 274 127 600
TABLE NO. 11: DEPARTMENT AND LEVEL OF SATISFACTION WITH EXISTING PERFORMANCE APPRAISAL SYSTEM (CHI – SQUARE TEST) Factor Calculated χχχχ2 Value Table Value D.F Remarks
Department 52.684 12.592 6 Significant at 5% level
Result: Since the χ2value is greater than table value, the null hypothesis is rejected. Hence, there is a close relationship between Department of the respondents and their level of satisfaction towards performance appraisal system practised in the selected sugar industries.
HYPOTHESIS- IV
Null hypothesis H0 : There is no significant relationship between educational qualification and level of satisfaction with existing performance appraisal system.
Alternative hypothesis H1: There is significant relationship between educational qualification and level of satisfaction with existing performance appraisal system.
TABLE NO.12: EDUCATIONAL QUALIFICATION AND LEVEL OF SATISFACTION WITH EXISTING PERFORMANCE APPRAISAL SYSTEM S.
No.
Educational Qualification No. of Respondents % Ave rage Range S.D Min Max
1. Upto school level 230 38.3 54.4 46 60 4.6
2. Diploma 186 31.0 50.4 48 58 3.2
3. Graduate 100 16.7 51.1 48 60 3.8
4. Post Graduates 84 14.0 53.2 48 60 2.5
Total 600 100.0
TABLE NO. 13: EDUCATIONAL QUALIFICATION AND LEVEL OF SATISFACTION WITH EXISTING PERFORMANCE APPRAISAL SYSTEM (TWO – WAY TABLE) S.
No.
Educational Qualification Level of satisfaction with existing Performance Appraisal System Total
Low Medium High
1. Upto school level 25
(10.9) 123 (53.5) 82 (35.7) 230
2. Diploma 112
(60.2) 57 (30.6) 17 (9.1) 186
3. Graduate 54
(54.0) 29 (29.0) 17 (17.0) 100
4. Post Graduate 8
(9.5) 65 (77.4) 11 (13.1) 84
Total 199 274 127 600
TABLE NO. 14: EDUCATIONAL QUALIFICATION AND LEVEL OF SATISFACTION WITH EXISTING PERFORMANCE APPRAISAL SYSTEM (CHI – SQUARE TEST) Factor Calculated χχχχ2 Value Table Value D.F Remarks
Educational Qualification 178.513 12.592 6 Significant at 5% level
Result: Since the χ2value is greater than table value, the null hypothesis is rejected. Hence, there is a close relationship between Educational Qualification of
the respondents and their level of satisfaction towards performance appraisal system.
HYPOTHESIS- V
Null hypothesis H0 : There is no significant relationship between type of family and level of satisfaction with existing performance appraisal system.
VOLUME NO. 2 (2012), ISSUE NO. 9 (SEPTEMBER) ISSN2231-5756
INTERNATIONAL JOURNAL OF RESEARCH IN COMMERCE, IT & MANAGEMENT
TABLE NO. 15: TYPE OF FAMILY AND LEVEL OF SATISFACTION WITH EXISTING PERFORMANCE APPRAISAL SYSTEM S.
No.
Marital status No. of Respondents % Ave rage Range S.D Min Max
1. Married 415 69.2 52.5 46 60 4.3
2. Unmarried 185 30.8 52.2 46 60 4.1
Total 600 100.0
TABLE NO. 16: MARITAL STATUS AND LEVEL OF SATISFACTION WITH EXISTING PERFORMANCE APPRAISAL SYSTEM (TWO – WAY TABLE) S.
No.
Marital status Level of satisfaction with existing Performance Appraisal System Total
Low Medium High
1. Married 136
(32.8) 187 (45.1) 92 (22.2) 415
2. Unmarried 63
(34.1) 87 (47.0) 35 (18.9) 185
Total 199 274 127 600
TABLE NO. 17: MARITAL STATUS AND LEVEL OF SATISFACTION WITH EXISTING PERFORMANCE APPRAISAL SYSTEM (CHI – SQUARE TEST) Factor Calculated χχχχ2 Value Table Value D.F Remarks
Marital status 0.810 5.991 2 Not Significant
Result: Since the χ2value is less than table value, the null hypothesis is accepted. Hence, there is a no significant relationship between marital status and level of satisfaction with existing performance appraisal system practised in the selected sugar industries.
HYPOTHESIS- VI
Null hypothesis H0 : There is no significant relationship between family size and level of satisfaction with existing performance appraisal system.
Alternative hypothesis H1: There is significant relationship between family size and level of satisfaction with existing performance appraisal system.
TABLE NO. 18: FAMILY SIZE AND LEVEL OF SATISFACTION WITH EXISTING PERFORMANCE APPRAISAL SYSTEM S.
No.
Family size No. of Respondents % Ave rage Range S.D Min Max
1. Upto 3 members 117 19.5 51.5 48 60 4.4
2. 3-5 members 346 57.7 52.5 46 60 4.6
3. Above 5 members 137 22.8 53.2 48 60 2.7
Total 600 100.0
TABLE NO. 19: FAMILY SIZE AND LEVEL OF SATISFACTION WITH EXISTING PERFORMANCE APPRAISAL SYSTEM (TWO – WAY TABLE) S.
No.
Family size Level of satisfaction with existing Performance Appraisal System Total
Low Medium High
1. Upto 3 members 53
(45.3) 43 (36.8) 21 (17.9) 117
2. 3-5 members 139
(40.2) 121 (35.0) 86 (24.9) 346
3. Above 5 members 7
(5.1) 110 (8.3) 20 (14.6) 137
Total 199 274 127 600
TABLE NO. 20: FAMILY SIZE AND LEVEL OF SATISFACTION WITH EXISTING PERFORMANCE APPRAISAL SYSTEM (CHI – SQUARE TEST) Factor Calculated χχχχ2 Value Table Value D.F Remarks
Family size 95.091 9.488 4 Significant at 5% level
Result: Since the χ2value is greater than table value, the null hypothesis is rejected. Hence, there is a close relationship between Family Size of the respondents
and their level of satisfaction towards performance appraisal practices.
HYPOTHESIS-VII
Null hypothesis H0 : There is no significant relationship between type of family and level of satisfaction with existing performance appraisal system.
Alternative hypothesis H1: There is significant relationship between type of family and level of satisfaction with existing performance appraisal system.
TABLE NO. 21: TYPE OF FAMILY AND LEVEL OF SATISFACTION WITH EXISTING PERFORMANCE APPRAISAL SYSTEM S.
No.
Type of family No. of Respondents % Ave rage Range S.D Min Max
1. Joint family 295 49.2 52.5 46 60 3.3
2. Nuclear family 305 50.8 52.4 48 60 5.0
Total 600 100.0
TABLE NO. 22: TYPE OF FAMILY AND LEVEL OF SATISFACTION WITH EXISTING PERFORMANCE APPRAISAL SYSTEM (TWO – WAY TABLE) S.
No.
Type of family Level of satisfaction with existing Performance Appraisal System Total
Low Medium High
1. Joint family 61
(20.7) 191 (64.7) 43 (14.6) 295
2. Nuclear family 138
(45.2) 83 (27.2) 84 (27.5) 305
Total 199 274 127 600
TABLE NO.23: TYPE OF FAMILY AND LEVEL OF SATISFACTION WITH EXISTING PERFORMANCE APPRAISAL SYSTEM (CHI – SQUARE TEST) Factor Calculated χχχχ2 Value Table Value D.F Remarks
VOLUME NO. 2 (2012), ISSUE NO. 9 (SEPTEMBER) ISSN2231-5756
Result: Since the χ2value is greater than table value, the null hypothesis is rejected. Hince, there is a close relationship between type of family of the respondents and their level of satisfaction with performance appraisal practices.
HYPOTHESIS- VIII
Null hypothesis H0 : There is no significant relationship between experience and level of satisfaction with existing performance appraisal system.
Alternative hypothesis H1: There is significant relationship between experience and level of satisfaction with existing performance appraisal system.
TABLE NO. 24: EXPERIENCE AND LEVEL OF SATISFACTION WITH EXISTING PERFORMANCE APPRAISAL SYSTEM S.
No.
Number of years of service No. of Respondents % Ave rage Range S.D Min Max
1. Upto 10 years 81 13.5 53.2 46 60 4.5
2. 10-20years 300 50.0 50.8 46 60 3.4
3. Above 20 years 219 36.5 54.4 48 60 4.3
Total 600 100.0
TABLE NO. 25: EXPERIENCE AND LEVEL OF SATISFACTION WITH EXISTING PERFORMANCE APPRAISAL SYSTEM (TWO – WAY TABLE) S.
No.
Number of years of service Level of satisfaction with existing Performance Appraisal System Total
Low Medium High
1. Upto 10 years 22
(27.2) 32 (39.5) 27 (33.3) 81
2. 10-20years 136
(45.3) 130 (43.3) 34 (11.3) 300
3. Above 20 years 41
(18.7) 112 (51.1) 66 (30.1) 219
Total 199 274 127 600
TABLE NO. 26: EXPERIENCE AND LEVEL OF SATISFACTION WITH EXISTING PERFORMANCE APPRAISAL SYSTEM (CHI – SQUARE TEST) Factor Calculated χχχχ2 Value Table Value D.F Remarks
Number of years of service 58.212 9.488 4 Significant at 5% level
Result: Since the χ2value is greater than table value, the null hypothesis is rejected. Hence, there is a close relationship between the number of years of service of the respondents and their level of satisfaction with performance appraisal system practised in selected sugar industries.
HYPOTHESIS- IX
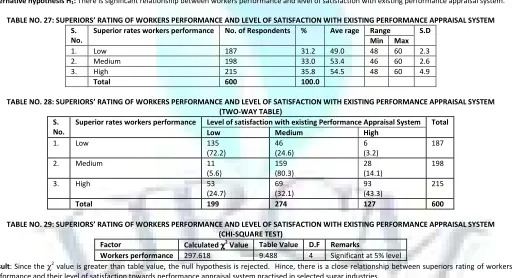
Null hypothesis H0: There is no significant relationship between workers performance and level of satisfaction with existing performance appraisal system.
Alternative hypothesis H1: There is significant relationship between workers performance and level of satisfaction with existing performance appraisal system.
TABLE NO. 27: SUPERIORS’ RATING OF WORKERS PERFORMANCE AND LEVEL OF SATISFACTION WITH EXISTING PERFORMANCE APPRAISAL SYSTEM S.
No.
Superior rates workers performance No. of Respondents % Ave rage Range S.D Min Max
1. Low 187 31.2 49.0 48 60 2.3
2. Medium 198 33.0 53.4 46 60 2.6
3. High 215 35.8 54.5 48 60 4.9
Total 600 100.0
TABLE NO. 28: SUPERIORS’ RATING OF WORKERS PERFORMANCE AND LEVEL OF SATISFACTION WITH EXISTING PERFORMANCE APPRAISAL SYSTEM (TWO-WAY TABLE)
S. No.
Superior rates workers performance Level of satisfaction with existing Performance Appraisal System Total
Low Medium High
1. Low 135
(72.2) 46 (24.6) 6 (3.2) 187
2. Medium 11
(5.6) 159 (80.3) 28 (14.1) 198
3. High 53
(24.7) 69 (32.1) 93 (43.3) 215
Total 199 274 127 600
TABLE NO. 29: SUPERIORS’ RATING OF WORKERS PERFORMANCE AND LEVEL OF SATISFACTION WITH EXISTING PERFORMANCE APPRAISAL SYSTEM (CHI-SQUARE TEST)
Factor Calculated χχχχ2 Value Table Value D.F Remarks
Workers performance 297.618 9.488 4 Significant at 5% level
Result: Since the χ2value is greater than table value, the null hypothesis is rejected. Hince, there is a close relationship between superiors rating of workers performance and their level of satisfaction towards performance appraisal system practised in selected sugar industries.
HYPOTHESIS - X
Null hypothesis H0: There is no significant relationship between labour welfare measures and level of satisfaction with existing performance appraisal system.
Alternative hypothesis H1: There is significant relationship between labour welfare measures and level of satisfaction with existing performance appraisal system.
TABLE NO.30: LABOUR WELFARE MEASURES PRACTISED AND LEVEL OF SATISFACTION WITH EXISTING PERFORMANCE APPRAISAL SYSTEM S. No. Labour welfare measures Practised No. of Respondents % Ave rage Range S.D
Min Max
1. Low 119 19.8 51.9 46 58 3.2
2. Medium 304 50.7 51.3 48 60 3.4
3. High 177 29.5 54.7 48 60 5.2
VOLUME NO. 2 (2012), ISSUE NO. 9 (SEPTEMBER) ISSN2231-5756
INTERNATIONAL JOURNAL OF RESEARCH IN COMMERCE, IT & MANAGEMENT
TABLE NO. 31: LABOUR WELFARE MEASURES PRACTISED AND LEVEL OF SATISFACTION WITH EXISTING PERFORMANCE APPRAISAL SYSTEM (TWO-WAY TABLE)S. No.
Labour welfare measures practised Level of satisfaction with existing Performance Appraisal System Total
Low Medium High
1. Low 39
(32.8)
70 (58.8)
10 (8.4)
119
2. Medium 123
(40.5)
149 (49.0)
32 (10.5)
304
3. High 37
(20.9)
55 (31.1)
85 (48.0)
177
Total 199 274 127 600
TABLE NO. 32: LABOUR WELFARE MEASURES PRACTISED AND LEVEL OF SATISFACTION WITH EXISTING PERFORMANCE APPRAISAL SYSTEM (CHI-SQUARE TEST)
Factor Calculated χχχχ2 Value Table Value D.F Remarks
Labour welfare measures 112.148 9.488 4 Significant at 5% level
Result: Since the χ2value is greater than table value, the null hypothesis is rejected. Hince, there is a close relationship between labour welfare measures practised in the organization and their level of satisfaction towards performance appraisal system practised in selected sugar industries.
8.3 MULTIPLE REGRESSION ANALYSIS:
The regression is a statistical relationship between two or more variables. When there are two or more independent variables, the analysis that describes such relationship is multiple regression. This analysis is adopted where there is one dependent variable that is presumed to be in relation with the function of two or more independent variables. In multiple regression, a linear composite of explanatory variable is formed, in such a way that it has maximum correlation with an active criterion variable. The main objective of using this technique is to predict the variability of the dependent variable, based on its co-variance with all the independent variables. It is useful to predict the level of dependent phenomenon through Multiple Regression Analysis Models, if the levels of independent variables are given. The linear multiple regression problems is to estimate coefficients of β1,β2,…., βj and β0 such that the expression,
Y = β0 + β1 X1 +β2 X2 +………+ βj XK
provides a good estimate of an individual Y score based on the X scores.
In this analysis, the relationship between the respondents’ level of satisfaction with the Performance Appraisal and Training Programme practices were studied by selecting eleven independent factors. It was found that out of eleven variables, only eight were closely associated with the level of satisfaction with the Performance Appraisal and Training Programme practices among the selected sample respondents. The eleven independent variables used in multiple regression analysis are shown below. They are,
Where, Y = Level of satisfaction in performance appraisal system
X1 = Respondents’ Age
X2 = Respondents’ Designation or grade
X3 = Respondents’ Department
X4 = Respondents’ Educational Qualification
X5 = Respondents’ Marital Status
X6 = Respondents’ Family Size
X7 = Respondents’ Type of Family
X8 = Respondents’ Scale of Pay
X9 = Respondents’ Experience
X10 = Respondents’ Workers Performance
X11 = Respondents’ idea about Labour Welfare Measures and
β0 +β1+β2 +….+ βj are the parameters to be estimated.
HYPOTHESIS- XI
H0= There is no significantrelationship between independent and dependent variables
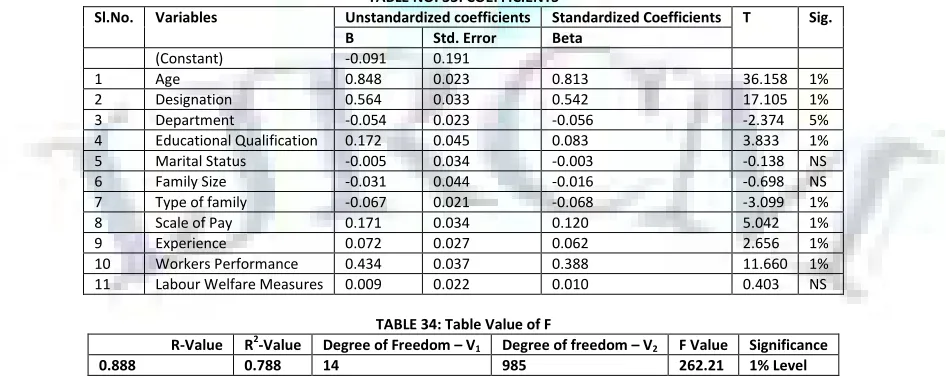
The respondents’ level of satisfaction with the Performance Appraisal and Training Programmes and independent factors were studied by selecting eleven independent factors used, the results were subjected to multiple regression analysis are shown below.
TABLE NO. 33: COEFFICIENTS
Sl.No. Variables Unstandardized coefficients Standardized Coefficients T Sig. B Std. Error Beta
(Constant) -0.091 0.191
1 Age 0.848 0.023 0.813 36.158 1%
2 Designation 0.564 0.033 0.542 17.105 1%
3 Department -0.054 0.023 -0.056 -2.374 5%
4 Educational Qualification 0.172 0.045 0.083 3.833 1%
5 Marital Status -0.005 0.034 -0.003 -0.138 NS
6 Family Size -0.031 0.044 -0.016 -0.698 NS
7 Type of family -0.067 0.021 -0.068 -3.099 1%
8 Scale of Pay 0.171 0.034 0.120 5.042 1%
9 Experience 0.072 0.027 0.062 2.656 1%
10 Workers Performance 0.434 0.037 0.388 11.660 1%
11 Labour Welfare Measures 0.009 0.022 0.010 0.403 NS
TABLE 34: Table Value of F
R-Value R2-Value Degree of Freedom – V1 Degree of freedom – V2 F Value Significance 0.888 0.788 14 985 262.21 1% Level
The larger the F ratio there will be more variance in the dependent variable that is associated with the independent variable. The F ratio = 262.21. The multiple linear regression co-efficient (dependent variables) is found to be statistically a good fit since r2 value is 0.788(Table 11.1.2). It shows that the independent variables contribute 79% of variations in the level of satisfaction of the employees, and this is statistically significant at 1% level and 5% level respectively. The F ratio= 262.21. Since reject the null hypothesis is rejected. Hence, there is close relationship between independent and dependent variables.
VOLUME NO. 2 (2012), ISSUE NO. 9 (SEPTEMBER) ISSN2231-5756 (0.001), Department has the beta coefficient -0.056 which is statistically significant at 5%(0.005), Educational Qualification of the respondent has beta coefficient0.083 which is significant at 1%.(0.001), Marital status of respondent has the beta coefficient -0.003 which is not significant at 1% (0.001), Family size of the respondent has beta coefficient -0.016 which is not significant at 5% (0.005), Type of family has the beta coefficient -0.068 which is significant at 1%(0.001), Scale of Pay has the beta coefficient -0.120 which is significant at 1%(0.001), Experience has the beta coefficient 0.062 which is significant at 1%(0.001), Experience has the beta coefficient 0.0388 which is significant at 1%(0.001), Workers Performance has the beta coefficient 0.388 which is significant at 1%(0.001), Labour Welfare Measures has the beta coefficient 0.010 which is not significant at 1%(0.001).
9.
PROBLEMS FACED BY THE RESPONDENTS IN THE PERFORMANCE APPRAISAL SYSTEM
An appraisal interview, when conducted properly, yields benefits for individual employees, management and the organization as a whole. If satisfaction accounts for the merits of the respondents’ performance appraisal, dissatisfaction accounts for the problems in using it. Hence, the routine problems faced by the respondents in using performance appraisal system were studied. For this purpose, seven major problems were chosen by the researcher. They were No recognition for supervisor, Biased in communication, Difficult to comparison, Assessment becomes vague, Attributes/traits were vague, Potentialities were ignored and Raters errors.
The respondents were asked to pinpoint from the most burning issue to the less concerning problems. Henry Garrett ranking method was employed and the results were furnished in the following table.
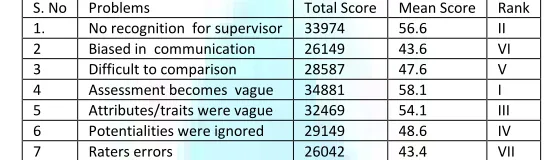
TABLE NO. 35: PROBLEMS FACED BY THE RESPONDENTS IN THE PERFORMANCE APPRAISAL SYSTEM
S. No Problems Total Score Mean Score Rank
1. No recognition for supervisor 33974 56.6 II
2 Biased in communication 26149 43.6 VI
3 Difficult to comparison 28587 47.6 V
4 Assessment becomes vague 34881 58.1 I
5 Attributes/traits were vague 32469 54.1 III
6 Potentialities were ignored 29149 48.6 IV
7 Raters errors 26042 43.4 VII
The above table highlights that out of the seven problems listed; the prime problem pinpointed by the respondents was “Assessment becomes vague”, which was ranked first with a Garrett score of 34881 points. It is followed by “No recognition for supervisor”, placed in the second rank with the Garrett score of 33974 points. The problems such as “Attributes/traits were vague”, “Potentialities were ignored” and “Difficult to comparison” were ranked in the third, fourth and fifth places with the Garret scores of 32469, 29149 and 28587 points respectively. The other issues namely, the Biased in communication was ranked in the sixth position with the Garrett score of 26149 points. Lastly, Raters errors were ranked in the seventh place with a Garrett score of 26042 points.
10.
PROBLEMS FACED BY THE RESPONDENTS IN THE TRAINING PROGRAMS
There are many impediments which can make a training programme ineffective. Hence, the routine problems faced by the respondents in training programme were studied. For this purpose, six major problems were chosen by the researcher, viz., Lack of impressive teaching ,Advanced topics cannot be taught by the trainer, Poor communication, Training environment is artificially created and Excessive Stress. The respondents were asked to reveal their opinion from the most burning issue to the less concerning problems. Henry Garrett ranking method was employed and the results were furnished in the following table.
TABLE NO. 36: PROBLEMS FACED BY THE RESPONDENTS IN THE TRAINING PROGRAMS
S. No Problems Total Score Mean Score Rank
1. Lack of impressive teaching 33822 56.4 II
2 Advanced topics cannot be taught 34523 57.5 I
3 Poor communication 27207 45.3 V
4 Training environment is artificially created 30396 50.7 III
5 Excessive Stress 29260 48.8 IV
The above table highlights that out of the six problems listed, the prime problem pinpointed by the respondents with 1st rank was Advanced topics cannot teach
by the trainer which obtained a Garrett score of 34523 points. It is followed by lack of impressive teaching placed in the second rank with the Garrett score of 33822points. The problems such as Training environment is artificially created, Excessive Stress and Poor communication were ranked in the third, fourth and fifth places with the Garrett scores of 30396, 29260 and 27207 points respectively.
11.
FINDINGS
From the results of the multiple regression analysis it is concluded that out of eleven variables, only eight variables are showing much influence against the level of satisfaction perceived by the respondents on the Performance Appraisal and Training Programmes practiced in sugar industries. They are respondents’ Age, Designation, Department, Educational Qualification, Type of Family, Scale of Pay, Experience and Workers Performance.
From Henry Garrett ranking method Problem faced by the respondents in the Performance Appraisal System was analyzed and it revealed that “Assessment becomes vague” which was ranked first with a help of Garrett Ranking Method. Problem faced by the respondents in the Training Programs was analyzed and it revealed that the prime problem pinpointed by the respondents and it revealed that “Advanced topics cannot be taught” by the training which was ranked first with a help of Garrett Ranking Method.
12.
SUGGESTIONS
1. Age-wise analysis reveals that only the respondents belonging to above 45 years have satisfied in the existing Performance Appraisal System. Hence, it is
suggested that the management should change that Appraisal System has practiced in the Government Organization and Public sector Organizations to retain in the young and middle aged respondents.
2. The employees having Operator and Labour Designation have perceived maximum level of satisfaction than the Fitter and Electricians. Hence, it is should
be suggested that uniformity should be practiced for all Designations.
3. Employees working in Distiller Department have perceived maximum level of satisfaction than the employees working in the other departments. Hence, it
is suggested that both the sugar industries top management should practiced uniformity should be practiced in all departments including Electrical, Engineering and Administration.
4. The employees’ education and their satisfaction on Performance Appraisal System have studied and it is found that the respondents having the school level
educations should high level of satisfaction. Hence, the management should take new care towards Diploma holders, Graduates and Post-Graduates.
13.
CONCLUSION
VOLUME NO. 2 (2012), ISSUE NO. 9 (SEPTEMBER) ISSN2231-5756
INTERNATIONAL JOURNAL OF RESEARCH IN COMMERCE, IT & MANAGEMENT
and found good. The development of employees’ workforce is continuous and essential process and it is realized by the top management and workforce of Sugar Mills. Performance Appraisal and Training programmes helps to promote the employee in a right scale of pay. The employees have close association with the Performance Appraisal and Training Programmes Practiced in Sugar Industries. The management should come forward to change the Appraisal System as practiced in the Government Organization and Public Sector Organizations to retain in the young and middle aged respondents. The employees should realize that the organization conducts Performance Appraisal and Training Programmes to enhance the knowledge and skills of the employees and to achieve its goals. Effective monitoring and measuring also includes providing timely feedback and reviews to employees for their work and performance according to the pre-determined goals and standards and solving the problems faced. Timely recognition of the accomplishments also motivates the employees and help to improve the performance. Performance appraisal offers competitive advantage to the select sugar industries by improving the employees performance, helps them to make correct decisions, ensuring legal compliance, minimizing job dissatisfaction and employee turnover and ensuring consistency between organizational strategy and behavior. Training Programmes practiced in sugar mills contributing to its capacity to grow. Accident, scrap and damage to machinery and equipment can be avoided or minimized.. Furthermore, future need of employees will be taken care by Performance Appraisal and Training Programmes practiced in sugar industries. There are several initiatives for career planning and career development, but it is not just organizations alone, even the employees themselves have a roal in shaping their careers.14.
REFERENCES
1. C.R.Kothari, “Research Methodology – Methods & Techniques”, Second Edition, Wishwa Prakashan, New Delhi, 2003, pg.161, 268.
2. Cynthia Lee “Increasing Performance Appraisal Effectiveness: Matching Task Types, Appraisal Process, and Rater Training”, The Academy of Management
Review, Vol.10, No.2, 1985, pp.322-331.
3. David E. Smith, “Training Programs for. Performance Appraisal: A Review”, Academy of Management Review, Vol. 11, No. 1, 1986, pp.22-40
4. Douglas Cederblom, “The performance appraisal interview: A review, implications and suggestions”. The Academy of Management Review, Vol. 7 (2), 1982,
219-227.
5. Gary Dessler. Human Resource Management, tenth edition, Prentice-Hall of India private Limited, NewDelhi, 2008, pg.320.
6. Robert L. Taylor and William D. Wilsted, “Capturing Judgment Policies: A Field Study of Performance Appraisal”, The Academy of Management Journal, Vol.
VOLUME NO. 2 (2012), ISSUE NO. 9 (SEPTEMBER) ISSN2231-5756
REQUEST FOR FEEDBACK
Dear Readers
At the very outset, International Journal of Research in Commerce, IT and Management (IJRCM)
acknowledges & appreciates your efforts in showing interest in our present issue under your kind perusal.
I would like to request you to supply your critical comments and suggestions about the material published
in this issue as well as on the journal as a whole, on our E-mail i.e.
for further
improvements in the interest of research.
If you have any queries please feel free to contact us on our E-mail
.
I am sure that your feedback and deliberations would make future issues better – a result of our joint
effort.
Looking forward an appropriate consideration.
With sincere regards
Thanking you profoundly
Academically yours
Sd/-
VOLUME NO. 2 (2012), ISSUE NO. 9 (SEPTEMBER) ISSN2231-5756