associate with vascular inflammation and
coronary atherosclerosis in lupus
Philip M. Carlucci, … , Nehal N. Mehta, Mariana J. Kaplan
JCI Insight.
2018;
3(8)
:e99276.
https://doi.org/10.1172/jci.insight.99276
.
BACKGROUND.
Systemic lupus erythematosus (SLE) is associated with enhanced risk of
atherosclerotic cardiovascular disease not explained by Framingham risk score (FRS).
Immune dysregulation associated to a distinct subset of lupus proinflammatory neutrophils
(low density granulocytes; LDGs) may play key roles in conferring enhanced CV risk. This
study assessed if lupus LDGs are associated with in vivo vascular dysfunction and
inflammation and coronary plaque.
METHODS.
SLE subjects and healthy controls underwent multimodal phenotyping of
vascular disease by quantifying vascular inflammation (
18F-fluorodeoxyglucose–PET/CT
[
18F-FDG–PET/CT]), arterial dysfunction (EndoPAT and cardio-ankle vascular index), and
coronary plaque burden (coronary CT angiography). LDGs were quantified by flow
cytometry. Cholesterol efflux capacity was measured in high-density lipoprotein–exposed
(HDL-exposed) radioactively labeled cell lines. Whole blood RNA sequencing was
performed to assess associations between transcriptomic profiles and vascular phenotype.
RESULTS.
Vascular inflammation, arterial stiffness, and noncalcified plaque burden (NCB)
were increased in SLE compared with controls even after adjustment for traditional risk
factors
.
In SLE, NCB directly associated with LDGs and associated negatively with
cholesterol efflux capacity in fully adjusted models. A neutrophil gene signature reflective of
the most upregulated genes in lupus LDGs associated with vascular inflammation and
NCB.
[…]
Clinical Medicine
Cardiology
Find the latest version:
Authorship note: PMC and MMP contributed equally as co–first authors.
Conflict of interest: The authors have declared that no conflict of interest exists.
Submitted: December 14, 2017 Accepted: March 9, 2018 Published: April 19, 2018 Reference information:
JCI Insight. 2018;3(8):e99276. https:// doi.org/10.1172/jci.insight.99276.
Neutrophil subsets and their gene
signature associate with vascular
inflammation and coronary
atherosclerosis in lupus
Philip M. Carlucci,1 Monica M. Purmalek,1 Amit K. Dey,2 Yenealem Temesgen-Oyelakin,1
Simantini Sakhardande,1 Aditya A. Joshi,2 Joseph B. Lerman,2 Alice Fike,1 Michael Davis,1
Jonathan H. Chung,2 Martin P. Playford,2 Mohammad Naqi,1 Pragnesh Mistry,1
Gustavo Gutierrez-Cruz,1 Stefania Dell’Orso,1 Faiza Naz,1 Taufiq Salahuddin,2 Balaji Natarajan,2
Zerai Manna,1 Wanxia L. Tsai,1 Sarthak Gupta,1 Peter Grayson,1 Heather Teague,2 Marcus Y. Chen,2
Hong-Wei Sun,1 Sarfaraz Hasni,1 Nehal N. Mehta,2 and Mariana J. Kaplan1
1National Institute of Arthritis and Musculoskeletal and Skin Diseases (NIAMS) and 2National Heart, Lung and Blood
Institute (NHLBI), NIH, Bethesda, Maryland, USA.
Introduction
Systemic lupus erythematosus (SLE) is an autoimmune syndrome primarily affecting women of childbearing age and is characterized by heterogeneous systemic manifestations and profound dysregulation of the innate and adaptive immune systems (1). Survival rates in SLE have significantly improved over time, yet deaths due to cardiovascular disease (CVD) in lupus have not (2). CVD accounts for approximately one-third of deaths
BACKGROUND. Systemic lupus erythematosus (SLE) is associated with enhanced risk of atherosclerotic cardiovascular disease not explained by Framingham risk score (FRS). Immune dysregulation associated to a distinct subset of lupus proinflammatory neutrophils (low density granulocytes; LDGs) may play key roles in conferring enhanced CV risk. This study assessed if lupus LDGs are associated with in vivo vascular dysfunction and inflammation and coronary plaque. METHODS. SLE subjects and healthy controls underwent multimodal phenotyping of vascular disease by quantifying vascular inflammation (18F-fluorodeoxyglucose–PET/CT [18F-FDG–PET/
CT]), arterial dysfunction (EndoPAT and cardio-ankle vascular index), and coronary plaque burden (coronary CT angiography). LDGs were quantified by flow cytometry. Cholesterol efflux capacity was measured in high-density lipoprotein–exposed (HDL-exposed) radioactively labeled cell lines. Whole blood RNA sequencing was performed to assess associations between transcriptomic profiles and vascular phenotype.
RESULTS. Vascular inflammation, arterial stiffness, and noncalcified plaque burden (NCB) were increased in SLE compared with controls even after adjustment for traditional risk factors. In SLE, NCB directly associated with LDGs and associated negatively with cholesterol efflux capacity in fully adjusted models.A neutrophil gene signature reflective of the most upregulated genes in lupus LDGs associated with vascular inflammation and NCB.
CONCLUSION. Individuals with SLE demonstrate vascular inflammation, arterial dysfunction, and NCB, which may explain the higher reported risk for acute coronary syndromes. The association of LDGs and neutrophil genes with vascular disease supports the hypothesis that distinct neutrophil subsets contribute to vascular damage and unstable coronary plaque in SLE. Results also support previous observations that neutrophils may disrupt HDL function and thereby promote atherogenesis.
TRIAL REGISTRATION. Clinicaltrials.gov NCT00001372
in SLE and, in some cohorts, is the leading cause of mortality in lupus (3, 4). Young women with SLE have a 50-fold increase in the risk of myocardial infarction compared with age-matched healthy women (5), and the CVD risk in SLE is not explained by the Framingham risk score (FRS) (6).
We and others have proposed that immune dysregulation and, specifically, aberrant innate immune responses characteristic of SLE may play a key role in conferring enhanced CV risk, driving vascular damage, and accelerating atherosclerosis (7, 8). A distinct subset of proinflammatory neutrophils called low-density granulocytes (LDGs) are found in increased numbers in SLE and promote endothelial cell damage in vitro (8). The cytotoxic effects of LDGs on the endothelium appear to be mediated, at least in part, through their enhanced capacity to form neutrophil extracellular traps (NETs) (9, 10). NETs may play important roles in driving endothelial cell damage, thrombosis, and aberrant immunity and inflammation in the arterial wall (11). Importantly, lupus LDG NETs have been found to be particularly vasculotoxic and proinflammatory (9). As such, we have proposed that LDGs may play crucial roles in early vascular inflammation and subsequent plaque formation and destabilization.
NETs can also oxidize high-density lipoprotein (HDL), causing it to acquire proatherogenic properties and impaired cholesterol efflux capacity (12, 13). While HDL-mediated atheroprotection is likely pleiotro-pic in nature, this ability of HDL to accept cholesterol from lipid-laden macrophages through cholesterol efflux appears to play a crucial antiatherogenic role (14). As such, LDGs, NETs, and the resultant impair-ment of cholesterol efflux capacity may play an important role in lupus-associated CVD.
Assessment of CVD in SLE has relied on coronary calcium quantification and carotid plaque mea-surements. However, inflammatory events occur early during atherosclerotic plaque development, and these assessments only capture CVD in its later stages. There is therefore a need for improvements in the early identification of SLE subjects at risk for CV events. Recent imaging advances have demonstrated that 18F-fluorodeoxyglucose–PET/CT (18F-FDG–PET/CT) can directly assess aortic vascular inflamma-tion, an early event in vascular disease development (15). FDG is taken up by inflammatory cells in the vessel wall, and this uptake can be quantified as a target/background ratio (TBR). Short-term changes in arterial inflammation measured with 18F-FDG–PET/CT have been associated with long-term ath-erosclerosis progression, suggesting that therapies that reduce vascular inflammation may attenuate the progression of vascular disease (16).
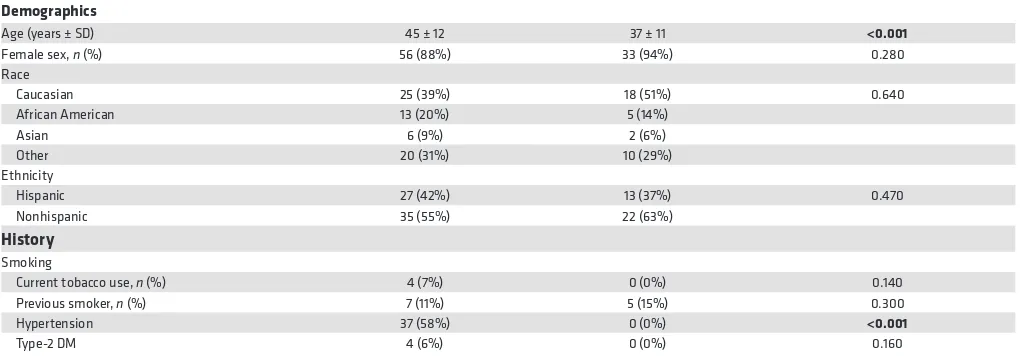
Arterial stiffness describes the reduced capability of an artery to expand and contract in response to pressure changes (17) and, as measured by carotid-femoral pulse wave velocity, is an independent predic-tor of CV morbidity and mortality in various diseases (18, 19). Arterial stiffness can also be quantified by calculating a cardio-ankle vascular index (CAVI), which is an indicator of the degree of atherosclerosis and resulting arterial stiffness in large and medium arteries independent of arterial blood pressure. CAVI Table 1. Demographic and clinical characteristics
Demographics
Age (years ± SD) 45 ± 12 37 ± 11 <0.001
Female sex, n (%) 56 (88%) 33 (94%) 0.280
Race
Caucasian 25 (39%) 18 (51%) 0.640
African American 13 (20%) 5 (14%)
Asian 6 (9%) 2 (6%)
Other 20 (31%) 10 (29%)
Ethnicity
Hispanic 27 (42%) 13 (37%) 0.470
Nonhispanic 35 (55%) 22 (63%)
History
Smoking
Current tobacco use, n (%) 4 (7%) 0 (0%) 0.140
Previous smoker, n (%) 7 (11%) 5 (15%) 0.300
Hypertension 37 (58%) 0 (0%) <0.001
Type-2 DM 4 (6%) 0 (0%) 0.160
has been identified as an important predictor of prognostic outcomes in patients with CVD and has been shown to significantly correlate with coronary atherosclerosis in various patient populations (20, 21). Noninvasive assessment of endothelial function can also be measured by other techniques, including the EndoPAT device, which quantifies endothelial function in the fingertip in association with risk of future adverse CV outcomes (22).
Noncalcified plaque burden (NCB) confers enhanced risk for plaque vulnerability and rupture and acute coronary syndromes (ACS) (23–25). Total burden, NCB, and dense-calcified coronary plaque burden can be assessed by coronary CT angiography (CCTA), which provides high-quality, detailed anatomical assessment comparable with invasive coronary angiography. Increased NCB has been associated with heightened prevalence of high-risk plaque in individuals with some inflammatory con-ditions (15, 26). Importantly, recent evidence indicates that NCB can be reversed or ameliorated by immunosuppressive drugs in psoriasis (26).
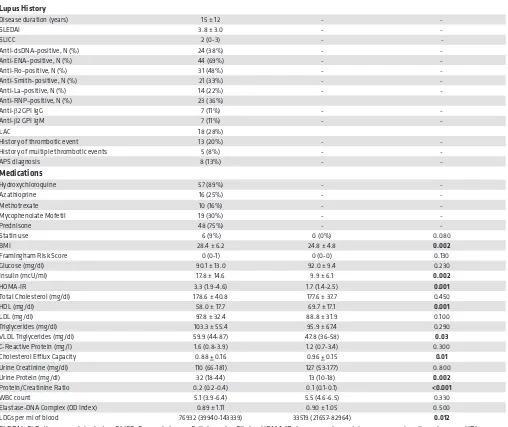
Table 2. Demographic and clinical characteristics
Lupus History
Disease duration (years) 15 ± 12 -
-SLEDAI 3.8 ± 3.0 -
-SLICC 2 (0-3) -
-Anti-dsDNA–positive, N (%) 24 (38%) -
-Anti-ENA–positive, N (%) 44 (69%) -
-Anti-Ro–positive, N (%) 31 (48%) -
-Anti-Smith–positive, N (%) 21 (33%) -
-Anti-La–positive, N (%) 14 (22%) -
-Anti-RNP–positive, N (%) 23 (36%)
Anti-β2 GPI IgG 7 (11%) -
-Anti-β2 GPI IgM 7 (11%) -
-LAC 18 (28%)
History of thrombotic event 13 (20%) -
-History of multiple thrombotic events 5 (8%) -
-APS diagnosis 8 (13%) -
-Medications
Hydroxychloroquine 57 (89%) -
-Azathioprine 16 (25%) -
-Methotrexate 10 (16%) -
-Mycophenolate Mofetil 19 (30%) -
-Prednisone 48 (75%) -
-Statin use 6 (9%) 0 (0%) 0.080
BMI 28.4 ± 6.2 24.8 ± 4.8 0.002
Framingham Risk Score 0 (0-1) 0 (0-0) 0.130
Glucose (mg/dl) 90.1 ± 13.0 92.0 ± 9.4 0.230
Insulin (mcU/ml) 17.8 ± 14.6 9.9 ± 6.1 0.002
HOMA-IR 3.3 (1.9-4.6) 1.7 (1.4-2.5) 0.001
Total Cholesterol (mg/dl) 178.6 ± 40.8 177.6 ± 37.7 0.450
HDL (mg/dl) 58.0 ± 17.7 69.7 ± 17.1 0.001
LDL (mg/dl) 97.8 ± 32.4 88.8 ± 31.9 0.100
Triglycerides (mg/dl) 103.3 ± 55.4 95.9 ± 67.4 0.290
VLDL Triglycerides (mg/dl) 59.9 (44-87) 47.8 (36-58) 0.03
C-Reactive Protein (mg/l) 1.6 (0.8-3.9) 1.2 (0.7-3.4) 0.300
Cholesterol Efflux Capacity 0.88 + 0.16 0.96 + 0.15 0.01
Urine Creatinine (mg/dl) 110 (66-181) 127 (53-177) 0.800
Urine Protein (mg/dl) 32 (18-44) 13 (10-18) 0.002
Protein/Creatinine Ratio 0.2 (0.2-0.4) 0.1 (0.1-0.1) <0.001
WBC count 5.1 (3.9-6.4) 5.5 (4.6-6.5) 0.330
Elastase-DNA Complex (OD Index) 0.89 ± 1.11 0.90 ± 1.05 0.500
LDGs per ml of blood 76932 (39940-143339) 33519 (21657-82964) 0.012
This study aimed to comprehensively characterize subclinical vascular disease in SLE using a multi-modal approach of vascular imaging and assessments of vascular function. We also sought to establish the contributions of both traditional risk factors and the presence of LDGs and neutrophil signatures to these in vivo vascular phenotypes.
Results
Demographic and clinical characteristics of subjects. Lupus (n = 64) and healthy controls (n = 35) did not differ
in sex, race, ethnicity, or FRS. Mean ± SD disease duration was 15 ± 12 years, and the SLE disease activity index (SLEDAI) (27) was 3.8 ± 3.0, indicating overall mild lupus disease activity. There were significant differences between SLE subjects and controls in prevalence of systemic hypertension and BMI, while mean age of SLE patients was higher when compared with controls (Tables 1 and 2). While total cholester-ol did not differ, SLE subjects had lower levels of HDL, increased very low–density lipoprotein (VLDL) tri-glycerides, increased insulin resistance (by homeostatic model assessment-insulin resistance; HOMA-IR), Table 3. Multimodal assessment of vascular inflammation, vascular function, and coronary plaque burden in SLE and healthy controls
Mean ± SD Mean ± SD
Aortic arch target/background ratio 1.83 ± 0.21 1.71 ± 0.23 0.007
Entire Aortic Target/Background Ratio 1.68 ± 0.16 1.59 ± 0.14 0.008
Right CAVI 7.4 (6.5–7.9) 6.3 (5.9–7.4) 0.001
Left CAVI 7.3 (6.4–7.8) 6.4 (6.0–7.2) 0.001
Avg. CAVI 7.3 (6.5–8.0) 6.3 (5.9–7.4) 0.001
EndoPAT log (RHI) 0.57 ± 0.31 0.67 ± 0.28 0.052
CCTA total burden (×100) mm2 0.89 ± 0.32 0.77 ± 0.19 0.009 CCTA noncalcified burden (×100) mm2 0.86 ± 0.33 0.76 ± 0.19 0.022 CCTA dense calcified burden (×100) mm2 0.011 (0.005–0.023) 0.011 (0.004–0.019) 0.313 CAVI, cardio-ankle-vascular index; RHI, reactive hyperemia index; CCTA, coronary CT angiography. Values represent mean ± SD or median (IQR range). Student’s t test was used for parametric data and Mann-Whitney U test was performed for nonparametric data. Statistically significant values are in bold.
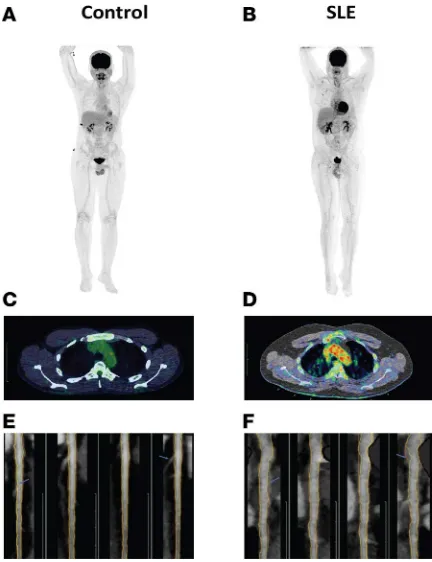
Figure 1. SLE subjects have increased vascular inflammation and coronary plaque compared with controls. (A and B) Representative 18F-FDG-PET/CT imaging of
the aorta in a healthy control (A) compared with SLE (B). (C and D) Representative
18F-FDG-PET/CT scan transverse section at the level of aortic arch from a fused
and a higher urine protein/creatinine ratio (Tables 1 and 2). SLE subjects and controls did not differ in oth-er parametoth-ers, including statin use, physical activity, or high-sensitivity C-reactive protein (hsCRP) levels. Most lupus subjects were taking antimalarials and/or prednisone at the time of the visit (Tables 1 and 2).
SLE subjects display enhanced vascular inflammation, vascular dysfunction, and coronary plaque. SLE patients
displayed significantly increased aortic inflammation by 18F-FDG–PET/CT (aortic TBR: 1.68 ± 0.16 vs. 1.59 ± 0.14, P = 0.007) (Table 3 and Figure 1, A–D). In SLE, arterial stiffness assessed by CAVI was also significantly increased, while endothelial function measured by EndoPAT was decreased (Table 3). CCTA analysis indicated that SLE subjects had increased total coronary plaque burden and that the contribution from NCB to the total burden was greater than the contribution from dense-calcified burden (Table 3 and Figure 1, E and F). Differences in arterial stiffness, vascular inflammation, total plaque burden, and NCB between control and SLE subjects persisted in multivariate regression analysis adjusting for FRS, indicating that higher mean age in the lupus group did not explain these vascular abnormalities and that variables other than traditional risk factors primarily accounted for the enhanced in vivo vascular disease in SLE (Table 4). Furthermore, NCB associated with average TBR (β = 0.23, P = 0.02) even after adjusting for FRS.
Lupus disease activity, as measured by SLEDAI, correlated with aortic arch TBR in unadjusted (β = 0.28, P = 0.04) and adjusted models accounting for either FRS, FRS + BMI, or FRS + BMI + HOMA-IR (P = 0.04, P = 0.01, P = 0.01, respectively). This association was not observed for total TBR, TBR in other regions of the aorta, vascular function, or coronary plaque. Lupus disease duration and lupus damage accrual (assessed by Systemic Lupus Collaborating Clinics/American College of Rheumatology Damage Index [SLICC] were associated with arterial stiffness [β = 0.28, P = 0.03 and β = 0.34, P = 0.01, respec-tively]; ref. 28), and these associations persisted after multivariate analysis adjusting for FRS, BMI, and HOMA-IR, while the CCTA Agatston calcium coronary score significantly correlated with SLICC (β = 0.515, P = 0.002). No other associations were detected between vascular parameters and SLICC, SLEDAI, or disease duration. Aortic arch TBR was also associated with levels of VLDL triglycerides (β = 0.319, P = 0.019). The presence of specific lupus autoantibodies (anti–double-stranded DNA [anti-dsDNA], anti-Ro, anti-La, anti-Sm, anti-RNP, anticardiolipin) did not correlate with any vascular parameters, with the excep-tion of EndoPAT reactive hyperemia index (RHI), which negatively correlated with anti-dsDNA presence in unadjusted (β = –0.28, P = 0.037) and adjusted models (r = –0.29, P = 0.031). In addition, a total of 27 Table 4. Association of SLE and vascular disease after adjusting for Framingham risk score
Model CAVI
n = 62 Log (RHI) n = 58 n = 54TBR n = 36NCB Dense calcified burden n = 36 Total burden n = 36
Unadjusted 0.28 (0.006) –0.170 (0.104) 0.26 (0.016) 0.160 (0.044) 0.17 (0.038) 0.19 (0.018)
Adjusted for FRS 0.25 (0.015) –0.143 (0.174) 0.268 (0.018) 0.173 (0.032) 0.12 (0.128) 0.19 (0.017)
CAVI, Cardio-ankle vascular index; RHI, reactive hyperemia index;TBR, target/background ratio; FRS, Framingham risk score. Results of univariate (unadjusted) or multivariate (adjusted for FRS) linear regression analysis using presence of lupus as predictor variable. Statistically significant values are in bold. Results are shown as β coefficient (P value)
Table 5. Association of LDGs with NCB
Model CCTA noncalcified burden
n = 36 patients totaling 101 arteries
Unadjusted 0.31 (0.002)
Model 1 0.30 (0.003)
Model 2 0.25 (0.001)
Model 3 0.26 (0.002)
Model 1 — adjusted for Framingham Risk Model 2 — adjusted for Framingham Risk + BMI
Model 3 — adjusted for Framingham Risk + BMI + HOMA-IR
cytokines were quantified in plasma, and statistically significant increases in IP-10 (P = 0.012) and eotax-in (P = 0.02) were detected eotax-in SLE when compared with controls. However, no significant associations between specific cytokines and any of the vascular parameters were identified (Supplemental Table 1; sup-plemental material available online with this article; https://doi.org/10.1172/jci.insight.99276DS1). Cur-rent treatment with corticosteroids showed a significant negative association with FRS (β = –0.29, P = 0.02) and age (β = –0.34, P = 0.006) that persisted after multivariate analysis. A positive correlation between corticosteroid use with urinary protein/creatinine ratio (β = 0.334, P = 0.01) and with absolute blood neu-trophil count (β = 0.358, P = 0.04) was observed, but not with LDGs, TBR, vascular function, or coronary plaque. No consistent significant association was found between the use of immunosuppressive drugs or statins and vascular inflammation, function, or coronary plaque. Overall, these results indicate that SLE subjects have enhanced vascular inflammation, vascular dysfunction, and NCB that is not explained by traditional risk factors, medications, or disease activity.
Determinants of coronary plaque burden in SLE. As previously reported by our group and others, SLE
subjects had increased levels of LDGs when compared with healthy controls (Tables 1 and 2 and Sup-plemental Table 2) (8). We previously showed that lupus LDGs, through their enhanced ability to form NETs, induce endothelial cell apoptosis (9) and macrophage inflammatory responses (29) and have the ability to oxidize HDL in regiospecific areas that are associated with impaired cholesterol efflux capacity and atherogenesis (12). We found that LDG levels significantly associated with NCB severity and low-er cholestlow-erol efflux capacity in SLE in an unadjusted linear regression analysis (Tables 5 and 6). These associations remained significant after adjusting for FRS, BMI, and HOMA-IR. Compared with controls, SLE subjects had impaired cholesterol efflux capacity (Tables 1 and 2 and Supplemental Table 3). As we had previously found that LDG NETs can oxidize HDL in regions that impair its cholesterol efflux ability (12), we assessed whether cholesterol efflux capacity associated with NCB. Indeed, decreases in HDL efflux associated with increased NCB in SLE, and this association persisted after adjusting for FRS, BMI, and HOMA-IR (Table 7). The individual associations of LDGs and cholesterol efflux capacity with NCB Table 6. Association of LDGs with cholesterol efflux capacity
Model Cholesterol efflux capacity n = 59
Unadjusted –0.29 (0.024)
Model 1 –0.32 (0.014)
Model 2 –0.30 (0.021)
Model 3 –0.32 (0.014)
Model 1 — adjusted for Framingham Risk Model 2 — adjusted for Framingham Risk + BMI
Model 3 —± adjusted for Framingham Risk + BMI + HOMA-IR
LDGs, low density granulocytes; HDL, high-density lipoprotein; HOMA-IR, homeostatic model assessment–insulin resistance. Univariate (unadjusted) or multivariate (models 1–3) linear regression analysis of LDGs with HDL efflux. Results represent β coefficient (P value).
Table 7. Association of cholesterol efflux capacity with NCB
Model CCTA noncalcified burden
n = 36 patients totaling 101 arteries
Unadjusted –0.30 (0.002)
Model 1 –0.32 (0.001)
Model 2 –0.23 (0.003)
Model 3 –0.23 (0.003)
Model 1 — adjusted for Framingham Risk Model 2 — adjusted for Framingham Risk + BMI
Model 3 — adjusted for Framingham Risk + BMI + HOMA-IR
also persisted after adjusting for cholesterol efflux capacity and/or LDGs, respectively (P < 0.05). These associations were distinct to LDGs, as total white blood cell counts and normal dense neutrophils did not associate with NCB or impaired cholesterol efflux capacity. These results indicate that LDG numbers and cholesterol efflux capacity play an important role in explaining NCB in SLE, as other traditional, non-traditional, or SLE-related risk factors failed to do so. A history of thrombotic events or the presence of antiphospholipid syndrome showed a nonsignificant trend for association with NCB (β = 0.19, P = 0.058 and β = 0.18, P = 0.067, respectively).
A neutrophil gene signature associates with vascular disease in SLE. To further elucidate the differences
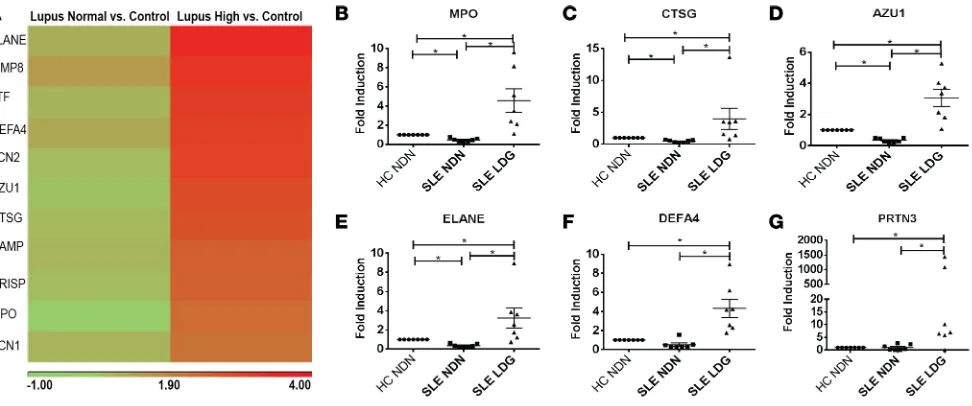
between SLE patients with subclinical vascular disease from those without significant vascular involve-ment, 2 independent RNA sequencing (RNA-Seq) analyses were performed. The discovery analysis includ-ed a group of healthy controls (n = 8), SLE with high TBR (n = 9), and SLE with low TBR (n = 8). A 1-way ANOVA analysis revealed genes that were differentially expressed between these groups. Overall, 105 and 62 genes were upregulated and 59 and 14 genes were downregulated in SLE with high TBR or low TBR, respectively, when compared with controls. In the SLE with high TBR group, 26 genes were upregulated and 72 genes downregulated when compared with SLE with normal TBR (Supplemental Tables 4–6). Path-way analysis showed that, in both comparisons of SLE high- and SLE low-TBR with controls, the 3 top upregulated pathways included IFN signaling, activation of IRF by cytosolic pattern recognition receptors, and role of pattern recognition receptors in recognition of bacteria and viruses, indicating dysregulation of the IFN pathway in SLE patients compared with controls irrespective of vascular inflammation (Supple-mental Figures 3 and 4). The differences between SLE patients with high TBR versus low TBR included the Figure 2. Elevated neutrophil signatures in SLE correlate with TBR and NCB. (A)Heatmap comparing neutrophil-related genes previously shown to be among the most upregulated in LDGs when compared with normal dense neutrophils in SLE subjects with either low or high NCB compared with controls. (B–G)qPCR comparing the expression of neutrophil genes found to be upregulated in the total blood RNA sequencing analysis now comparing expression between normal-density neutrophils (NDN) from age-, sex-, and race-matched healthy controls (HC) (n = 7) and autologous SLE NDNs (n = 7) to LDGs in SLE (n = 7). Data represent mean ± SEM. Wilcoxon matched-pairs signed rank test was performed; *P < 0.05.
Table 8. Association of neutrophil score with vascular inflammation (TBR)
Model Vascular Inflammation (TBR)
n = 34
Unadjusted 0.27 (0.122)
Model 1 0.71 (0.036)
Model 1 — adjusted for age + sex + BMI + 20-day steroid dose + immunosuppressants + statins
TBR, target/background ratio. Univariate (unadjusted) or multivariate (model 1) linear regression analysis of the neutrophil score with TBR Results are β
downregulation of genes involved in B cell development, T cell and B cell signaling, and Th cell differentia-tion pathways (Supplemental Figure 5). A confirmadifferentia-tion analysis using a similar approach included a group of healthy controls (n = 8), SLE with high NCB (n = 9), and SLE with low NCB (n = 9). A 1-way ANOVA analysis revealed genes that were differentially expressed between these 3 groups. Overall, 173 and 69 genes were upregulated and 450 and 94 genes were downregulated, respectively, when SLE with high NCB and SLE with low NCB were compared with controls. Further, 14 genes were upregulated and 45 genes were downregulated when comparing SLE with high NCB and SLE with low NCB (Supplemental Tables 7–9). Pathway analysis using these differentially regulated genes between patients with high NCB and controls showed that the top 3 upregulated pathways were NK cell signaling, IFN signaling, and crosstalk between DCs and NK cells (Supplemental Figure 6). The upregulated IFN signaling pathway was also the top dif-ferentially regulated pathway when comparing SLE patients with low TBR and controls, again suggesting that the dysregulation of this pathway is not restricted only to the high-plaque group (Supplemental Figure 7). When comparing the SLE patients with high NCB and SLE patients with low NCB, the top 2 pathways statistically different among groups included NK cell signaling and crosstalk between DCs and NK cells (Supplemental Figure 8). Of note, no significant association between monocyte-related pathways and mea-surements of vascular disease was identified in this cohort.
When compared with controls, several of the most upregulated genes in the high-TBR and high-NCB SLE groups were neutrophil-associated genes and, in particular, genes previously found to be upregu-lated in LDGs when compared with normal-density neutrophils (10) (Supplemental Tables 4–9). Given the associations of LDGs with coronary atherosclerosis in this SLE cohort, we analyzed the neutrophil signature based on levels of gene expression of these transcripts (10) and compared differences in these neutrophil-related genes among groups. We found that an increased neutrophil signature was present in SLE subjects with high TBR and/or high NCB when compared with controls, but not in patients that had normal TBR and no increases in NCB (Figure 2A). To better understand how this gene signature relates to vascular disease, a composite score incorporating several upregulated neutrophil genes in high-TBR patients was generated. Lupus patients with high high-TBR or high NCB had a significantly higher neutrophil score compared with controls (P = 0.046 and P = 0.036, respectively). A linear regression of TBR with the neutrophil score was performed. Although not initially significant, this association attained significance after adjusting for confounding variables (Table 8). A linear regression of NCB with the neutrophil score showed a significant association in SLE subjects (NCB: β = 0.44, P < 0.001) that persisted after adjusting for FRS, BMI, and statin use (Table 9). As the neutrophil-related gene signature corresponded with genes previously found to be significantly upregulated in LDGs compared with nor-mal dense neutrophils (10), these results suggest that a significant portion of cells generating this blood signature represent LDGs (Figure 2A). To validate this finding, LDGs and normal-density neutrophils were purified from SLE subjects, and their transcripts of neutrophil-related genes were compared by real-time PCR. Confirming previous reports, LDGs expressed significantly higher levels of the genes found to be upregulated in the peripheral blood signature than normal-density neutrophils (Figure 2, B–G). Of note, the neutrophil score did not correlate with lupus medications, including steroids, or with disease duration, SLICC, or SLEDAI (not shown), but it did associate with protein/creatinine ratio (β = 0.366, Table 9. Association of neutrophil score with NCB
Model CCTA Noncalcified Burden
n = 28 patients totaling 82 arteries
Unadjusted 0.44 (<0.001)
Model 1 0.43 (<0.001)
Model 2 0.24 (0.005)
Model 3 0.25 (0.004)
Model 1 — adjusted for Framingham risk Model 2 — adjusted for Framingham Risk + BMI
Model 3 — adjusted for Framingham Risk + BMI + HOMA-IR
P = 0.047). These results indicate that LDGs and LDG-related signatures in lupus blood significantly
associate with in vivo vascular disease in SLE.
Discussion
The role of neutrophils in the development and progression of atherosclerosis has only recently begun to be significantly appreciated and studied (30). In other patient populations, recent clinical studies have reported direct correlations between neutrophil blood counts and CVD, CV mortality, and all-cause mortality (2, 31, 32). Neutrophil intracellular products have deleterious effects on the vasculature, and neutrophil alarmins and cathelicidins act as significant recruiters and perpetuators of innate and adaptive immune responses in the arterial wall (33). Furthermore, NET formation has recently been identified to play important roles in atherothrombosis and vascular damage (34, 35).
SLE represents a reliable human model to study the role of neutrophils in vascular dysfunction and atherosclerosis because these complications are present in a significant proportion of subjects affected by the disease and develop at an accelerated pace (36, 37). Furthermore, SLE patients display increased levels of a subset of neutrophils, which displays a distinct ability to form NETs, kill endothelial cells, and exhibit proin-flammatory functions including type I IFN responses’ amplification, lipoprotein modification, and inflam-masome activation (8–10, 12).
The main findings of this study include the identification that circulating LDG numbers and an LDG-driven gene signature, but not the FRS, significantly and independently associate with vascular inflammation and dysfunction and coronary NCB. This is particularly relevant because NCB predicts pro-spective CV events and is associated with high-risk plaque features in patients with and without inflamma-tory conditions (38–40). It is important to emphasize that FRS associated with calcified plaque burden did not associate with NCB, supporting that immune dysregulation and, specifically, neutrophil responses may be key drivers of vulnerable plaque, thus enhancing the risk of major cardiac adverse events. Future longi-tudinal studies will assess whether the presence of high NCB and LDGs in SLE predicts the development of high-risk plaque features and worse vascular outcomes.
Another important finding of this study is the association of impaired cholesterol efflux capacity with LDG numbers and NCB. In other patient populations, a link between impaired cholesterol efflux capacity and NCB was reported (40). We previously showed that lupus LDGs, through NET formation, can oxidize HDL in regions associated with induction of proinflammatory features and loss of HDL’s atheroprotective capacity (12). Our findings suggest that LDG-driven modified HDL present in SLE may promote foam cell formation and the development of inflamed, high-risk plaque.
Pathway analysis of blood RNA-Seq showed downregulation of genes involved in lymphocyte signal-ing and development in those SLE subjects with increased arterial inflammation. This is possibly explained by lymphopenia, as those subjects with higher TBR had lower lymphocyte counts (not shown), a hallmark of more active SLE (41). It is also possible that changes in subsets of lymphocytes with immunoregulatory roles account for changes in vascular inflammation, and future longitudinal studies will assess this. The pathway analysis of SLE with high NCB versus low NCB show differential expression of genes involved in NK cell signaling. This finding merits further exploration given that these and other related innate immune cells have been implicated in atherosclerosis development (42). The IFN pathway includes genes that were upregulated in patients with and without vascular involvement when compared with controls. This sup-ports previous findings that SLE patients display enhanced type I IFN production (43). Future longitudinal assessments should evaluate whether the IFN signature predicts plaque progression, given previous studies that indicated a role for these cytokines in vascular damage in human and murine lupus (7, 44–46).
Regarding study limitations, this was a cross-sectional evaluation, and longitudinal assessment of this cohort is ongoing to examine if any of these variables predicts CVD progression and CV events. While con-trols and SLE subjects were not completely matched by age, SLE patients continued to display significant abnormalities in multimodal phenotyping of vascular disease after age adjustment. The SLE cohort captured overall low disease activity; thus, future studies should address the phenotype of subjects with more severe disease. This may also explain, at least in part, why — compared with other lupus cohort studies — the levels of NET complexes in circulation were not significantly higher in SLE than in controls, and this could reflect nonimpaired NET clearance, which is a feature more characteristic of more severe SLE with active nephritis (47, 48). Nevertheless, the fact that vascular abnormalities and neutrophil associations are significant even in this well-controlled cohort support a prominent role for this neutrophil subset in driving premature CVD in lupus. As LDGs have recently been reported in other autoimmune conditions, it will be important to assess whether they also predict vascular damage and progression to atherosclerosis in other patient cohorts (49). Future studies should also confirm whether the neutrophil gene signature association with vascular disease is fully dependent on LDGs or whether other neutrophil subsets are also involved. There are several cell types in the artery that may take up FDG, including endothelial cells, smooth muscle cells, and immune cells, so it remains to be determined which cells were responsible for enhanced uptake. FDG uptake results need to be further supported in future studies by histologic correlation to improve specificity, although prior stud-ies have performed similar evaluations (50). Of note, the number of individuals with previous thrombotic events or with associated antiphospholipid syndrome was small; therefore, this study was probably under-powered to detect whether a significant association exists between these variables and vascular inflammation or plaque. Finally, while no associations between medications and vascular abnormalities were detected, longitudinal assessments on how immunosuppressive drugs and other medications modulate vascular dis-ease in SLE are needed.
Drugs that modulate NET formation, neutrophil function, and/or cholesterol efflux capacity are cur-rently being investigated in preclinical and/or clinical studies in inflammatory conditions (35, 47, 51–55). Our study further supports the potential role of aberrant neutrophils in the pathogenesis of CVD in individ-uals with autoimmunity and suggests that targeting these pathways could have important roles in prevent-ing and mitigatprevent-ing atherogenesis.
Methods
Patient recruitment
Healthy adults without any prior clinical CVD and adult patients that fulfilled revised criteria for SLE (56) were recruited from the NIH Healthy volunteer cohort and the NIAMS Lupus clinic or NIAMS Communi-ty Health Center, respectively. SLE subjects with estimated GFR < 60 ml/min/1.73 m2 BSA did not under-go CCTA. Pregnant or lactating women or individuals with active infections were excluded from partici-pation. Controls were excluded if they had any concomitant medical problems or were taking medications that would confound study results. After enrollment, controls were excluded if found to have HDL <40, BMI >35, diagnosed hypertension, and/or dyslipidemia. All individuals underwent physical examination and fasting blood and urine samples prior to vascular testing. Clinical and demographic characteristics, SLEDAI (27), SLICC Damage Index (28), and FRS (57) were calculated at each visit. Laboratory param-eters including fasting blood glucose and lipid panel, white blood count with differential, and systemic inflammatory markers were quantified in the clinical laboratory at the NIH: HOMA-IR was calculated as (glucose [nmol/ml] + insulin [μIU/ml])/22.5 (58).
Procedures
over the superior vena cava to obtain a single average background blood activity. The SUVmean from each of the superior vena cava slices were then averaged to produce 1 venous value. To account for background blood activity, SUVmax values from each aortic slice were divided by the average venous SUVmean valueto yield TBR, a measure of vascular inflammation as previously described (15). Overall, 54 SLE subjects and 28 controls underwent this test (Supplemental Figures 1 and 2).
Vascular function tests
Subjects were asked to refrain from smoking and drinking caffeinated beverages for 24 hours and to fast for at least 6 hours prior to the tests. They were also asked to hold all medications including vasodilators, antihypertensives, and statins on the morning of the test. During testing, subjects were placed in a tempera-ture-controlled quiet room in the supine position.
CAVI. CAVI was measured in both arms and ankles using VaSera-1500 (Fukuda Denshi Co.). After
placing BP cuffs around arms and ankles and attaching electrocardiogram (EKG) electrodes to the upper arms, a microphone was placed on the sternal angle to record heart sounds. Measurements were automati-cally calculated using the VaSera VS-1000 software. The principle underlying CAVI has been discussed pre-viously (59). Overall, 63 SLE subjects and 30 controls underwent this test (Supplemental Figures 1 and 2).
Peripheral arterial tonometry (PAT). Microvascular endothelial function was evaluated using PAT with an
EndoPAT 2000 device (Itamar Medical Ltd.) as previously described (58). Finger probes were placed on symmetric fingers bilaterally, and a BP cuff was placed on 1 arm, with the other arm serving as the control arm. PAT was continuously measured for 20 minutes, and — in between, for 5 minutes — BP cuff was inflated to supra systolic pressure in the test arm. After occlusion dilatation, RH was captured by EndoPAT as an increase in the PAT signal amplitude and compared with the control arm. A postocclusion/preocclu-sion ratio was calculated by EndoPAT software, providing a RHI. Augmentation index (AI) was calculated from PAT pulses at the baseline period. The result is further normalized to heart rate of 75 bpm (AI@75). Overall, 58 SLE subjects and 30 controls underwent this test (Supplemental Figures 1 and 2).
CCTA. CCTA was performed using a 320-detector row scanner (Aquilion ONE ViSION). Coronary
plaque was separately assessed in each of the main coronary arteries (left anterior descending, left circum-flex, and right coronary artery) using QAngio CT (Medis). Total burden, calcified burden (CB), and NCB indices were calculated by dividing total vessel plaque volume by total vessel length. Imaging procedures included topogram/localizer images, coronary calcium score (i.e., noncontrast images of the heart), con-trast timing images, and concon-trast enhanced images. Overall, 36 SLE subjects and 18 controls underwent this study (Supplemental Figures 1 and 2).
Quantification of circulating LDGs
Human PBMCs were isolated by Ficoll-Paque density gradient (GE Healthcare). Red blood cells were lysed with hypertonic solution, and PBMCs were resuspended in 2% FBS/PBS. After blocking 15 min-utes with Human TruStain Fc Receptor Blocking Solution (BioLegend), cells were resuspended in FACS buffer and incubated with mouse anti–human CD10 (clone H10A, catalog 312209), –CD15 (clone HI98, catalog 301906), and –CD14 (clone HCD14, catalog 325610) antibodies (BioLegend) or isotype control for 15 minutes in the dark. Cells were fixed with 2% PFA. Data was collected using a BD FACSCanto RUO and analyzed using FlowJo Software Version 10. Cutoff values for positive staining were determined using compensation controls for each fluorophore. LDGs were classified as CD10+CD15+CD14lo as previously described (8). As previously shown, SLE patients had significantly higher levels of LDGs than controls (8).
RNA isolation and RNA-Seq
was also used for the principal components analysis (PCA) and 1-way ANOVA. For analyses, patients were grouped as increased coronary NCB and/or high TBR (1.5 SDs above the mean of healthy controls) or nor-mal NCB and/or nornor-mal TBR (within 1.5 SDs of the mean of healthy controls). Pathway analysis and gene annotation were completed using Ingenuity Pathway Analysis (Qiagen). RNA-Seq results have been deposit-ed in the Gene Expression Omnibus (GEO) database under the accession number GSE110685 (https://www. ncbi.nlm.nih.gov/geo/).
A Z score, referred to as the neutrophil score, was created using the RPKM values for the most upregu-lated neutrophil genes in patients with high TBR (AZU1, MPO, CTSG, PRTN3, ELANE, DEFA3). The mean healthy control RPKM value was calculated and subtracted from each control and patient RPKM value for each respective gene. These values were then divided by the healthy control SD of each gene, and a sum of these numbers created the score for each patient and control that underwent RNA-Seq analysis.
LDG signature validation
Validation of the neutrophil LDG signature was performed on mRNA extracted from isolated LDGs from SLE patients, autologous normal-density neutrophils from SLE, and normal-density neutrophils from healthy control individuals. LDGs and normal-density neutrophils were isolated as previous-ly described (8, 10). Cells were suspended in TRI Reagent (MilliporeSigma), and RNA was extract-ed using Direct-zol RNA Miniprep Kit (Zymo Research) according to the manufacturers’ instructions. RNA was reverse transcribed using iScript Reverse Transcription Supermix (Bio-Rad). Quantitative PCR (qPCR) was performed using SsoAdvanced Universal SYBR Green Supermix (Bio-Rad). Gene expression was normalized to the GAPDH house keeping gene, and fold induction was calculated using the healthy control NDN mean expression. Primer sequences were as follows; GAPDH, 5′ -
TTGC-CATCAATGACCCCTTCA - 3′ (forward), 5′ - CGCCCCACTTGATTTTGGA - 3′ (reverse); MPO, 5′
- TGCTGCCCTTTGACAACCTG - 3′ (forward), 5′ - TGCTCCCGAAGTAAGAGGGT - 3′ (reverse);
ELANE, 5′ - CTCGCGTGTCTTTTCCTCG - 3′ (forward), 5′ - GCCGACATGACGAAGTTGG - 3′
(reverse); PRTN3, 5′ - AACTACGACGCGGAGAACAAA - 3′ (forward), 5′ -
CGAGGGACGAAAGT-GCAAATG - 3′ (reverse); CTSG, 5′ - ACATGGCGTATCTTCAGATCCA - 3′ (forward), 5′ -
GCGC-CCAGGGTGACATTTAT - 3′ (reverse); AZU1, 5′ - ATGCCCGCTTCGTGATGAC - 3′ (forward), 5’
– CTGATGGAAAACGTCTGGCG - 3′ (reverse); DEFA4, 5′ - CCTTTGCATGGGATAAAAGCTCT
- 3′ (forward), 5’ – ACACCACCAATGAGGCAGTTC - 3′ (reverse).
Cytokine quantification
The levels of 27 cytokines in serum were measured using the Bio-Plex pro human 27-plex immunoassay (Bio-Rad) according to the manufacturer’s instructions. The Bio-Plex pro human cytokine standard group I was used as standards for the assays.
NET complex ELISA
Human neutrophil elastase-DNA complexes were measured in plasma as previously described (47). In brief, 96-well ELISA plates were coated overnight at 4°C with rabbit anti–human HNE (catalog 481001, Calbiochem). Plates were blocked in 1% BSA and incubated overnight with plasma in blocking buffer. After washing, plates were incubated for 1 hour at room temperature with anti-dsDNA mAB (clone BV16-13, catalog MAB030, MilliporeSigma). Plates were washed and incubated for 1 hour with anti–mouse IgG-HRP conjugate (catalog 1721012, Bio-Rad) followed by a wash and the addition of TMB substrate (MilliporeSigma) and stop reagent (MilliporeSigma). Absorbance was measured at 450 nm, and values were calculated as an OD Index.
HDL cholesterol efflux capacity
in media containing 2.8% apoB-depleted pooled control plasma – μCi of 3H-cholesterol in pooled control plasma-free media). The pooled plasma was obtained from 5 healthy volunteers. All assays were performed in duplicate. Overall, 62 SLE subjects and 34 controls had cholesterol efflux capacity assessed (Supplemen-tal Figures 1 and 2).
Statistics
Descriptive statistics are presented as mean and SD or median and interquartile range for continuous variables and frequencies for categorical variables. Normality of distribution for continuous variables was assessed by both the Shapiro-Wilk normality test and by measures of skewness and kurtosis, deeming the dataset appropriate for parametric analysis. A 2-tailed Student’s t test was used for parametric data analysis, and a Mann-Whitney U test was used for nonparametric data analysis on samples from lupus and controls. Correlations were determined using Spearman’s correlation analysis and are reported as Spearman’s ρ. Standardized univariate regression analysis was performed, and β-coefficients and P values were reported. Multivariate linear regression analysis was performed with presence of lupus as the predictor variable and vascular function tests (TBR, CAVI, RHI, and coronary plaque) as dependent variables, adjusting for car-diovascular and cardiometabolic risk factors. Log conversion of certain variables were done to render their distribution normal. Sample size was based on previous publications of studies on SLE cohorts that study vascular disease (7, 46). Statistical analysis was performed using STATA 12.0 software (STATA Corp.). P ≤ 0.05 was considered statistically significant.
Study approval
Protocol was approved by the NIAMS/NIDDK IRB and conducted in accordance to Declaration of Hel-sinki. All subjects enrolled signed informed consent prior to participation in the study.
Author contributions
PMC, and MMP designed and performed experiments, data analysis and contributed to writing the manuscript; AKD contributed data analysis and contributed to writing manuscript; YTO contributed patient recruitment and assessment; SS and MN performed vascular function studies; AAJ, JBL, JHC, TS, BN, and HT performed data analysis of imaging studies; AF MD, SG, and SH contributed patient evaluation and characterization; MPP contributed cholesterol efflux experiments and analysis; PM con-tributed LDG mRNA experiments; GGC, SDO, and FN assisted with RNA sequencing experiments; ZM contributed patient database management; WLT contributed cytokine experiments; PG and HWS contributed statistical analysis; MYC contributed CCTA experiments; NNM contributed study design and analysis and contributed to writing manuscript; MJK contributed conceptual study design, data analysis, and writing manuscript.
Acknowledgments
We thank the NIAMS Flow Cytometry Core, Office of Science and Technology for technical support. This study utilized the high-performance computational capabilities of the Helix Systems at the NIH (http:// helix.nih.gov). This study was supported by the Intramural Research program at NIAMS/NIH (ZIA AR041199) and by the Lupus Research Institute.
Address correspondence to: Mariana J. Kaplan, Systemic Autoimmunity Branch, Intramural Research Program, National Institute of Arthritis and Musculoskeletal and Skin Diseases, National Institutes of Health, 10 Center Drive, 12N248C, Bethesda, Maryland 20892, USA. Phone: 301.496.0517; Email: mariana.kaplan@nih.gov.
1. Tsokos GC. Systemic lupus erythematosus. N Engl J Med. 2011;365(22):2110–2121.
2. Lewandowski LB, Kaplan MJ. Update on cardiovascular disease in lupus. Curr Opin Rheumatol. 2016;28(5):468–476. 3. Thomas G, et al. Mortality associated with systemic lupus erythematosus in France assessed by multiple-cause-of-death
analy-sis. Arthritis Rheumatol. 2014;66 (9):2503–2511.
5. Manzi S, et al. Prevalence and risk factors of carotid plaque in women with systemic lupus erythematosus. Arthritis Rheum. 1999;42 (1):51–60.
6. Esdaile JM, et al. Traditional Framingham risk factors fail to fully account for accelerated atherosclerosis in systemic lupus ery-thematosus. Arthritis Rheum. 2001;44 (10):2331–2337.
7. Denny MF, et al. Interferon-alpha promotes abnormal vasculogenesis in lupus: a potential pathway for premature atherosclerosis. Blood. 2007;110 (8):2907–2915.
8. Denny MF, et al. A distinct subset of proinflammatory neutrophils isolated from patients with systemic lupus erythematosus induces vascular damage and synthesizes type I IFNs. J Immunol. 2010;184 (6):3284–3297.
9. Carmona-Rivera C, Zhao W, Yalavarthi S, Kaplan MJ. Neutrophil extracellular traps induce endothelial dysfunction in systemic lupus erythematosus through the activation of matrix metalloproteinase-2. Ann Rheum Dis. 2015;74 (7):1417–1424.
10. Villanueva E, et al. Netting neutrophils induce endothelial damage, infiltrate tissues, and expose immunostimulatory molecules in systemic lupus erythematosus. J Immunol. 2011;187 (1):538–552.
11. Grayson PC, Kaplan MJ. At the Bench: Neutrophil extracellular traps (NETs) highlight novel aspects of innate immune system involvement in autoimmune diseases. J Leukoc Biol. 2016;99(2):253–264.
12. Smith CK, et al. Neutrophil extracellular trap-derived enzymes oxidize high-density lipoprotein: an additional proatherogenic mechanism in systemic lupus erythematosus. Arthritis Rheumatol. 2014;66 (9):2532–2544.
13. Smith CK, et al. Lupus high-density lipoprotein induces proinflammatory responses in macrophages by binding lectin-like oxi-dised low-density lipoprotein receptor 1 and failing to promote activating transcription factor 3 activity. Ann Rheum Dis. 2017;76 (3):602–611.
14. Khera AV, et al. Cholesterol efflux capacity, high-density lipoprotein function, and atherosclerosis. N Engl J Med. 2011;364 (2):127–135.
15. Naik HB, et al. Severity of Psoriasis Associates With Aortic Vascular Inflammation Detected by FDG PET/CT and Neutrophil Activation in a Prospective Observational Study. Arterioscler Thromb Vasc Biol. 2015;35 (12):2667–2676.
16. Hetterich H, et al. Natural history of atherosclerotic disease progression as assessed by (18)F-FDG PET/CT. Int J Cardiovasc Imaging. 2016;32 (1):49–59.
17. Gavish B, Izzo JL, Jr. Arterial Stiffness: Going a Step Beyond. Am J Hypertens. 2016;29(11):1223–1233. 18. Mansour AS, et al. Aortic stiffness and cardiovascular risk in type 2 diabetes. J Hypertens. 2013;31 (8):1584–1592.
19. Sarafidis PA, et al. Ambulatory Pulse Wave Velocity Is a Stronger Predictor of Cardiovascular Events and All-Cause Mortality Than Office and Ambulatory Blood Pressure in Hemodialysis Patients. Hypertension. 2017;70 (1):148–157.
20. Matsumoto S, et al. The relationship between cardio-ankle vascular index and subclinical atherosclerosis evaluated by cardiac computed tomographic angiography. Clin Cardiol. 2017;40 (8):549–553.
21. Miyoshi T, Ito H. Assessment of Arterial Stiffness Using the Cardio-Ankle Vascular Index. Pulse (Basel). 2016;4(1):11–23. 22. Rubinshtein R, et al. Assessment of endothelial function by non-invasive peripheral arterial tonometry predicts late
cardiovascu-lar adverse events. Eur Heart J. 2010;31 (9):1142–1148.
23. Wong KK, Thavornpattanapong P, Cheung SC, Sun Z, Tu J. Effect of calcification on the mechanical stability of plaque based on a three-dimensional carotid bifurcation model. BMC Cardiovasc Disord. 2012;12:7.
24. van Velzen JE, et al. Comparison of the relation between the calcium score and plaque characteristics in patients with acute cor-onary syndrome versus patients with stable corcor-onary artery disease, assessed by computed tomography angiography and virtual histology intravascular ultrasound. Am J Cardiol. 2011;108 (5):658–664.
25. Pundziute G, et al. Evaluation of plaque characteristics in acute coronary syndromes: non-invasive assessment with multi-slice computed tomography and invasive evaluation with intravascular ultrasound radiofrequency data analysis. Eur Heart J. 2008;29 (19):2373–2381.
26. Lerman JB, et al. Coronary Plaque Characterization in Psoriasis Reveals High-Risk Features That Improve After Treatment in a Prospective Observational Study. Circulation. 2017;136(3):263–276.
27. Bombardier C, Gladman DD, Urowitz MB, Caron D, Chang CH. Derivation of the SLEDAI. A disease activity index for lupus patients. The Committee on Prognosis Studies in SLE. Arthritis Rheum. 1992;35(6):630–640.
28. Gladman DD, et al. The reliability of the Systemic Lupus International Collaborating Clinics/American College of Rheumatol-ogy Damage Index in patients with systemic lupus erythematosus. Arthritis Rheum. 1997;40 (5):809–813.
29. Kahlenberg JM, Carmona-Rivera C, Smith CK, Kaplan MJ. Neutrophil extracellular trap-associated protein activation of the NLRP3 inflammasome is enhanced in lupus macrophages. J Immunol. 2013;190 (3):1217–1226.
30. Döring Y, Drechsler M, Soehnlein O, Weber C. Neutrophils in atherosclerosis: from mice to man. Arterioscler Thromb Vasc Biol. 2015;35 (2):288–295.
31. Verdoia M, et al. Impact of diabetes on neutrophil-to-lymphocyte ratio and its relationship to coronary artery disease. Diabetes Metab. 2015;41 (4):304–311.
32. Benites-Zapata VA, Hernandez AV, Nagarajan V, Cauthen CA, Starling RC, Tang WH. Usefulness of neutrophil-to-lymphocyte ratio in risk stratification of patients with advanced heart failure. Am J Cardiol. 2015;115 (1):57–61.
33. Kahlenberg JM, Kaplan MJ. Little peptide, big effects: the role of LL-37 in inflammation and autoimmune disease. J Immunol. 2013;191 (10):4895–4901.
34. Warnatsch A, Ioannou M, Wang Q, Papayannopoulos V. Inflammation. Neutrophil extracellular traps license macrophages for cytokine production in atherosclerosis. Science. 2015;349(6245):316–320.
35. Knight JS, et al. Peptidylarginine deiminase inhibition reduces vascular damage and modulates innate immune responses in murine models of atherosclerosis. Circ Res. 2014;114 (6):947–956.
36. Roman MJ, et al. Rate and determinants of progression of atherosclerosis in systemic lupus erythematosus. Arthritis Rheum. 2007;56 (10):3412–3419.
37. Roman MJ, et al. Prevalence and correlates of accelerated atherosclerosis in systemic lupus erythematosus. N Engl J Med. 2003;349 (25):2399–2406.
39. Nance JW Jr, et al. Coronary atherosclerosis in African American and white patients with acute chest pain: characterization with coronary CT angiography. Radiology. 2011;260 (2):373–380.
40. Salahuddin T, et al. Cholesterol efflux capacity in humans with psoriasis is inversely related to non-calcified burden of coronary atherosclerosis. Eur Heart J. 2015;36 (39):2662–2665.
41. Kao AH, Manzi S, Ramsey-Goldman R. Review of ACR hematologic criteria in systemic lupus erythematosus. Lupus. 2004;13 (11):865–868.
42. Engelbertsen D, Lichtman AH. Innate lymphoid cells in atherosclerosis. Eur J Pharmacol. 2017;816:32–36.
43. Baechler EC, et al. Interferon-inducible gene expression signature in peripheral blood cells of patients with severe lupus. Proc Natl Acad Sci USA. 2003;100 (5):2610–2615.
44. Thacker SG, et al. Type I interferons modulate vascular function, repair, thrombosis, and plaque progression in murine models of lupus and atherosclerosis. Arthritis Rheum. 2012;64 (9):2975–2985.
45. Thacker SG, Berthier CC, Mattinzoli D, Rastaldi MP, Kretzler M, Kaplan MJ. The detrimental effects of IFN-α on vasculo-genesis in lupus are mediated by repression of IL-1 pathways: potential role in atherovasculo-genesis and renal vascular rarefaction. J Immunol. 2010;185 (7):4457–4469.
46. Somers EC, et al. Type I interferons are associated with subclinical markers of cardiovascular disease in a cohort of systemic lupus erythematosus patients. PLoS One. 2012;7 (5):e37000.
47. Lood C, et al. Neutrophil extracellular traps enriched in oxidized mitochondrial DNA are interferogenic and contribute to lupus-like disease. Nat Med. 2016;22 (2):146–153.
48. Hakkim A, et al. Impairment of neutrophil extracellular trap degradation is associated with lupus nephritis. Proc Natl Acad Sci USA. 2010;107 (21):9813–9818.
49. Grayson PC, et al. Neutrophil-Related Gene Expression and Low-Density Granulocytes Associated With Disease Activity and Response to Treatment in Antineutrophil Cytoplasmic Antibody-Associated Vasculitis. Arthritis Rheumatol. 2015;67(7):1922–1932. 50. Rudd JH, et al. (18)Fluorodeoxyglucose positron emission tomography imaging of atherosclerotic plaque inflammation is
high-ly reproducible: implications for atherosclerosis therapy trials. J Am Coll Cardiol. 2007;50 (9):892–896.
51. Knight JS, et al. Peptidylarginine deiminase inhibition is immunomodulatory and vasculoprotective in murine lupus. J Clin Invest. 2013;123 (7):2981–2993.
52. Alfaidi M, et al. Neutrophil elastase promotes interleukin-1β secretion from human coronary endothelium. J Biol Chem. 2015;290 (40):24067–24078.
53. Lincoff AM, et al. Evacetrapib and Cardiovascular Outcomes in High-Risk Vascular Disease. N Engl J Med. 2017;376(20):1933–1942. 54. Khera AV, et al. Cholesterol Efflux Capacity, High-Density Lipoprotein Particle Number, and Incident Cardiovascular Events:
An Analysis From the JUPITER Trial (Justification for the Use of Statins in Prevention: An Intervention Trial Evaluating Rosuvastatin). Circulation. 2017;135 (25):2494–2504.
55. Hernáez Á, et al. Mediterranean Diet Improves High-Density Lipoprotein Function in High-Cardiovascular-Risk Individuals: A Randomized Controlled Trial. Circulation. 2017;135(7):633–643.
56. Hochberg MC. Updating the American College of Rheumatology revised criteria for the classification of systemic lupus erythe-matosus. Arthritis Rheum. 1997;40 (9):1725.
57. Pinsky JL, et al. Framingham Disability Study: relationship of disability to cardiovascular risk factors among persons free of diagnosed cardiovascular disease. Am J Epidemiol. 1985;122 (4):644–656.
58. Marder W, et al. The peroxisome proliferator activated receptor-γ pioglitazone improves vascular function and decreases disease activity in patients with rheumatoid arthritis. J Am Heart Assoc. 2013;2 (6):e000441.
59. Ichihara A, et al. Cardio-ankle vascular index and ankle pulse wave velocity as a marker of arterial fibrosis in kidney failure treated by hemodialysis. Am J Kidney Dis. 2008;52 (5):947–955.