A b s t r a c t.The aim of the research conducted was the creation of a model of the phenomenon of the external friction of vegetable materials using a feed-forward artificial neural network (ANN). The network was taught using a modified error back-propagation algorithm. The best modelling accuracy was obtained for a three-layer neural network having 11 neurons in the first hidden layer, 13 neurons in the second hidden layer and 1 neuron in the output layer. The accuracy of the ANN obtained was compared to the result of a theoretical-experimental model (TEM). A multi-aspect analysis of the accuracy of the models investigated was conducted. It was concluded that the model of the phenomenon of external friction which made use of the artificial neural network gave a higher accuracy of the predicted value of the friction force than did the theoretical-experimental model. The higher accuracy given by the ANN can be proved both by lower mean error values (aveBw) and smaller variation ranges (aveBw ± standard deviation Bw). In the case of the TEM, the aveBw values change from -6.9% to -5.0% and in the case of ANN from -0.8% to 1.8%. The variation ranges for all data sets are smaller for the neural network model than for the theoretical-experimental model.
K e y w o r d s: external friction, granular vegetable materials, feed-forward artificial neural network
INTRODUCTION
External friction, defined as a set of phenomena existing in the contact region of two bodies moving with respect to each other, invariably accompanies all processes connected with yielding granular vegetable materials. Thus, the pro-blem of the correct description of this phenomenon is very important both from the point of view of engineering prac-tice and the design of new machines and installations as well as the optimisation of many technological processes.
The difficulties in predicting friction processes result from the complexity of the properties of vegetable materials
(to a large extent determined by the water content), espe-cially considering the anisotropy of the materials. Despite the fact that many authors have already created their models, each of these theoretical-empirical models (TEM) constitu-tes only an approximation of the real conditions. The ques-tion may therefore be asked as to whether, by using modern modelling methods, it would be possible to create a model that would even more accurately describe the real process. One such method is the use of artificial neural networks (ANN). Neural networks are still more often used for sol-ving various problems, including those connected with agriculture and the processing of agricultural produce [1,8,9,12-14,16].
The application of ANN allows one to avoid the mistake of the improper choice of model and makes it possible to process noisy signals. ANN also possesses the ability to generalise the knowledge gained [10,18].
Considering the above, the aim of the present research was to create a model of the external friction of granular vegetable materials using the artificial neural network and comparing it (as regards the accuracy obtained) with the above mentioned, theoretical-empirical model.
MATERIALS AND METHODS
There are many theories of external friction which describe this phenomenon in a more or less precise way [2,4-7,11,17].
Up to now the largest number of factors determining the friction process applied in the description of this pheno-menon can be found in the theoretical-empirical model wor-ked out by Fr¹czek [3]. As a result of the estimation he obtained the following formula:
Model development of the external friction of granular vegetable materials
on the basis of artificial neural networks
S. Francik* and J. Fr¹czek
Department of Machine Design, University of Agriculture, Balicka 104, 30-149 Cracow, Poland
Received November 10, 2000; accepted January 15, 2001
© 2001 Institute of Agrophysics, Polish Academy of Sciences
*Corresponding author’s e-mail: francik@tier.ar.krakow.pl
A A
Agggrrroooppphhyhyysssiiicccsss
w
w
(
)
T= x1-4 4372. ×x2-0 247. ×x30 1342. ×x45 56. x7+(
s x5)
-0 3677. ×x70 7904. +(
x5×x6)
-0 2317.where:T- external friction force (N),x1=n1/n2- the ratio of
the density of micro-roughness verticesndefined as an ave-rage number of vertices per unit surface (m-2),x2=R1/R2
-the ratio of surface roughnessR(m),x3=E1/E2- the ratio of
elastic moduliE(Pa),x4=w- water content (kg kg-1db),x5
=p- real contact area (m2),x6=a - surface micro-hardness
for granular material (Pa),x7- pressure force (N),s- friction
path (m) (indexes 1 and 2 represent granular vegetable material and construction material, respectively).
The coefficient of determination obtained was relati-vely high (R2= 0.875 at the significance level of 0.003) and for this reason the theoretical-experimental model mentio-ned (TEM) was adopted as a basis for working out the artificial neural network.
The results of the measurements conducted on a tribometric station and other testing machines were used in modelling. These measurements concerned various granular materials: Dañkowskie Z³ote rye, Almari wheat, the Perkoz
field pea, Szelejewska vetch, Mirela lupine, Nakielska white mustard, the Fidelia pea, and the Jubilatka bean [15].
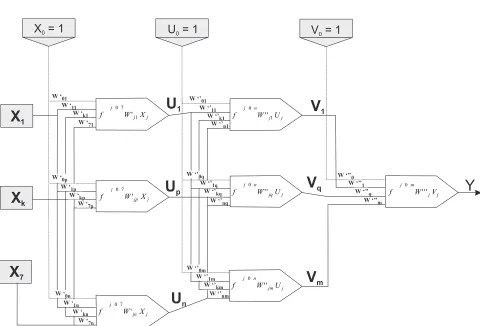
Multi-layer feed-forward ANNs are capable of execu-ting the input-output operations of any level of complexity. Therefore, a network of the above-mentioned type was selected in order to develop an empirical model describing the phenomenon investigated.
A modified error back-propagation method was used for teaching the network (a method called momentum and an adaptive learning rate have been applied). The number of inputs and outputs was determined by the task the ANN was executing. A three-layer network was used, having 7 inputs and 1 output (Fig. 1). All factors deter-mining the friction process, taken into consideration by the theoretical-experimental model (X1, ..., Xj, ...,X7), were used as input variables for the ANN. All data has been normalised so that its values are in the range (0,1) using the following formula:
x x x
x x j i j i R j R j R j R , , , , , = -min max min j j j X W f 1 7 0
' j j
n j U W f 1 0 '' j jq n j U W f '' 0 j j m j V W
f '''
0 j jm n j U W f '' 0
V = 1
0U = 1
0W ‘01 W ‘’
01
W ‘11 W ‘’
11
W ‘k1
W ‘’k1
W ‘71 W ‘’n1
W ‘7p W ‘’nq
W ‘7n
W ‘’nm
W ‘’’m
W ‘kp W ‘’kq
W ‘kn
W ‘’km
W ‘’’q
W ‘1p W ‘’1q
W ‘1n
W ‘’1m
W ‘’’1
W ‘0p W ‘’0q
W ‘0n
W ‘’0m
W ‘’’0
j jp j X W f ' 7 0 j jn j X W f ' 7 0
Y
X
1X
kX
7V
mV
qV
1U
1U
pU
nX = 1
0where:xj,i- a re-scaled value of the variable;xRj i, - real value
of the input variable;xRj,min- lower limit of the value of the
input variable;xRj,max- upper limit of the value of the input
variable.
The data obtained from experimental work (values of the input variables and the output variable - the friction force) was divided into the teaching set (ucz_1), two testing sets (test_1, test_2) and two verifying sets (weryf_1, weryf_2) at random. In order to obtain the ANN describing the phenomenon modelled as precisely as possible, the pro-cess of network teaching was run repeatedly for various net-work architectures. The best netnet-work was chosen based on the value of the adopted measure of the network working error (mBw) for the data from the testing data sets. This measure was calculated from the formula:
mBw = |aveBw| + sdBw
where: mBw - a measure of the network working error (%), Bw - relative error (%), aveBw - arithmetic mean of Bw (%), sdBw - standard deviation of Bw (%).
Subsequently, the accuracy given by the theoretical-experimental model (TEM) and the accuracy given by the empirical model - the artificial neural network was compared. Arithmetical means (aveBw) and standard deviations (sdBw) were calculated for the Bw values in individual data sets.
RESULTS AND DISCUSSION
In the effect of the analyses conducted, the ANN giving the highest accuracy of predicted friction force (minimum value of the error meter mBw) was chosen. The lowest mBw values for both testing data sets were obtained for the network having 11 neurons in the first layer, 13 neurons in the second layer and 1 neuron in the third layer (the output layer). Transfer functions in individual layers were the same. For the first and second layer it was a sigmoid transfer function and for the third (output) layer it was a linear transfer function. This network gave the value of the mBw measurement of 23.9% (for the data set test_1) and 22.9% (for the data set test_2). Also for the data sets verifying the correctness of the ANN choice this network had the lowest values of the mBw measurement: 24.4% for the data set weryf_1 and 22.4% for the data set weryf_2.
All the results of the comparison of the accuracy of TEM and the model based on ANN have been collectively presented in Fig. 2.
Both lower values of the mean error and smaller ranges of its variation (aveBw± sdBw) are evidence of a higher accuracy given by the ANN. The variation ranges for all data sets are narrower for the neural networks than for the theoretical-experimental model. Quotients of the widths of the ranges for ANN and TEM vary from 63% (for the data set test_2) to 73% (for the data set test_1). A comparison of
the aveBw values confirms that the artificial neural network is much more accurate than the theoretical-experimental model. For the TEM, the aveBw values vary from -6.9 to -5.0% and for the ANN from -0.8% to 1.8% (Table 1).
Analysis of the results of the calculations obtained has shown that fidelity of the fitting is different for individual investigated vegetable granular materials. For example, for the Perkoz field pea with a water content of 0.17 kg kg-1db and the steel plate havingRa= 1.25mm theoretical values are underestimated with relation to the real values. (Fig. 3a), for Dañkowskie Z³ote rye, a relatively good fit of the theoretical curve to the results of measurements was obtained (Fig. 3b), and for the Jubilatka bean, the theoretical values are overestimated (Fig. 3c).
Having carried out a similar analysis for various inves-tigated construction materials, one can state that depending on the roughness of the construction material surface, we obtain a different value of the difference between the real and theoretical values of the friction force. For example, for
data set
Bw
(%)
-45 -40 -35 -30 -25 -20 -15 -10 -5 0 5 10 15 20 25 30
ucz_1 test_1 test_2 weryf_1 weryf_2
theoretical-experimental model artificial neural network
a sum of mean error and standard deviation (aveBw+sdBw) mean error (aveBw)
difference between mean error and standard deviation (aveBw-sdBw)
the Perkoz field pea with a water content of 0.09 kg kg-1db (Fig. 4) maximum overestimation occurred for a steel plate havingRa= 20mm at a load of 110 N.
The reason for the above mentioned regularities can be found in the fact that the models analysed were created for all the vegetable and construction materials investigated. Thus, necessarily, certain generalisations were introduced, increasing error estimation. Additional factors describing the kind of material investigated probably should be taken into consideration. This procedure should eventually result in the increased prediction accuracy of the friction force value for vegetable materials.
Data set
TEM (%) ANN (%)
aveBv sdBv aveBv sdBv
ucz_1 test_1 test_2 weryf_1 weryf_2
-5.7 -6.9 -5.0 -5.6 -5.8
31.7 31.7 33.4 35.1 30.0
0.3 -0.8 1.8 -0.5 1.7
21.5 23.1 21.1 23.9 20.7
TEM - theoretical-experimental model, ANN - artificial neural network, aveBv - mean error, sdBv - standard deviation. T a b l e 1.Values of mean error and standard deviation
Tpom Tssn Tmod
a
0 5 10 15 20 25 30 35 40 45 50
0 20 40 60 80 100 120
Pressure force (N)
Friction
force
(N)
b
0 5 10 15 20 25 30 35 40 45 50
0 20 40 60 80 100 120
c
0 5 10 15 20 25 30 35 40 45 50
0 20 40 60 80 100 120
Fig. 3.External friction force in relation to pressure force. Water content 0.17 kg kg-1db. Surface roughness of steel plateRa= 1.25mm. The Perkoz field pea (a), Dañkowskie Z³ote rye (b), the Jubilatka bean (c). Tpom value of the friction force in the experiment, Tssn -value of the friction force calculated with the ANN model, Tmod - -value of the friction force calculated with TEM.
Tpom Tssn Tmod
a
0 5 10 15 20 25 30 35
0 20 40 60 80 100 120
Friction
force
(N)
b
0 5 10 15 20 25 30 35
0 20 40 60 80 100 120
Pressure force (N)
c
0 5 10 15 20 25 30 35
0 20 40 60 80 100 120
A multi-aspect analysis of the accuracy of the investi-gated models was conducted on the basis of the results obtained. It is the comparison of a purely empirical model (ANN) and a theoretical-experimental model (TEM). As expected, the ANN model reflects real conditions much more accurately.
The same is true for other theories of external friction -as in the example in Fig. 5. It illustrates the change of friction force Tpom obtained during the experiment, Tssn -calculated with ANN and Tc - -calculated based on the Coulomb theory, depending on the pressure force N, for Almari wheat with a water content of 0.09 kg kg-1db. The deviation of the curve Tc from Tpom is much greater than the deviation of the curve Tssn from Tpom, which offers evidence that the ANN model is more accurate.
Nevertheless, it constitutes ‘a black box’, in a sense. It is therefore impossible to conduct a physical analysis of the phenomenon investigated. Thus, this model can find an application mainly in engineering practice, in situations where it is necessary to determine exactly the value of the external friction force of granular vegetable materials. In the case of research concerning the theory of the external fric-tion force of vegetable materials, these methods which allow the interpretation of the results obtained and the formulation of explanatory hypotheses are thus recommended. In this context, ANNs may be applied but as an ancillary tool, use-ful in the mathematical verification of the previously formu-lated model.
CONCLUSIONS
1. The application of elements of the theoretical-expe-rimental model (factors determining the process) permit the development of the model of external friction using a feed-forward three-layer artificial neural network.
2. Based on the analysis conducted, one can state that the best reflection of real conditions can be obtained by ANN having 11 neurons in the first layer and 13 neurons in the second layer.
3. The model of external friction using artificial neural networks ensures a higher accuracy in predicting the friction force value than the theoretical-experimental model.
4. In order to increase the prediction accuracy of the values of the external friction force of granular vegetable materials, it is indispensable to include more factors de-scribing the granular materials under investigation.
REFERENCES
1. Batchelor W.D., Yang X.B., and Tschanz A.T., 1997. Deve-lopment of a neural network for soybean rust epidemics. Trans. ASAE, 40(1), 247-252.
2. Bucklin R.A., Molenda M., Bridges T.C., and Ross I.J., 1996.Slip-stick frictional behaviour of wheat on galvanized steel. Trans. ASAE, 39(2), 649-653.
3. Fr¹czek J., 1999.Friction of granular materials of plant origin (in Polish). Zesz. Nauk. AR, Cracow, 252.
4. Hebda M. and Wachal A., 1980.Tribology (in Polish). WNT, Warszawa.
5. Kaczorowski J. and Œlipek Z., 1996.Modelling of the ex-ternal friction kinetic process in plant materials. Part I. Analysis of the sliding contact of single micro-inequalities of plant and construction materials. Annual Rev. of Agricultural Engineering, 1/1, 79-87.
6. Kaczorowski J. and Œlipek Z., 1996.Modelling of the external friction kinetic process in plant materials. Part II. Determination of the real contact area during kinetic friction of plant materials. Annual Rev. of Agricultural Engineering, 1/1, 87-95.
7. Kaczorowski J., Œlipek Z., and Fr¹czek J., 1996. Modelling of the external friction kinetic process in plant materials. Part III. Mathematical model. Annual Rev. of Agricultural Engi-neering, 1/1, 95-104.
8. Kim S. and Cho S.I., 1997.Neural network modelling and fuzzy control cimulation for the bread-baking process. Trans. ASAE, 40(3), 671-676.
9. Lacroix R., Salehi F., Yang X.Z., and Wade K.M., 1997.
Effects of data pre-processing on the performance of artificial neural networks for dairy yield prediction and cow culling classification. Trans. ASAE, 40(3), 839-846.
10. Langman J., 1999.Application of artificial neural networks in agricultural engineering (in Polish). In¿ynieria Rolnicza, 1, 153-158.
11. Molenda M., Horabik J., Grochowicz M., and Szot B.,
1995.Grains of wheat friction (in Polish). Acta Agrophysica, 4.
12. Parmar R.S., McClendon R.W., Hoogenboom G.,
Blan-kenship P.D., Cole R.J., and Dorner J.W., 1997. Estimation of aflatoxin contamination in pre-harvest peanuts using neural networks. Trans. ASAE, 40(3), 809-813.
0 5 10 15 20 25
0 20 40 60 80 100 120
Pressure force (N)
Friction
force
(N)
Tpom Tssn Tc
13.Ruan R., Almaer S., Zou C., and Chen P.L., 1997.
Spectrum analysis of mixing power curves for neural net-work prediction of dough reological properties. Trans. ASAE, 40(3), 677-681.
14.Shao J., Xin H., and Harmon J.D., 1997.Neural network analysis of postural behaviour of young swine to determine the IR thermal comfort state. Trans. ASAE, 40(3), 755-760. 15.Œlipek Z., Kaczorowski J., and Fr¹czek J., 1999. Theoretical
and Experimental Analysis of Vegetable Materials Friction (in
Polish). PTIR, Kraków.
16. Yang C.C., Prasher S.O., Mehuys G.R., and Patni N.K.,
1997.Application of artificial neural networks for simulation of soil temperature. Trans. ASAE, 40(3), 649-656.
17. Zhang Q., Puri V.M., and Manbeck H.B., 1988.Model for frictional behaviour of wheat on structural materials. Trans. ASAE, 31(3), 898-903.