Environmental Resources Research Vol. 6, No. 2, 2018
GUASNR
Soil properties, labile pools of soil organic carbon and their variations
under broadleaf and coniferous plantation in Hyrcanian forest,
northern Iran
K. Atashnama1*, A. Golchin2, A. Mousavi Koupar2 1
Soil Science Department, Faculty of Agriculture, Zanjan University, Zanjan, Iran 2
Agricultural and Natural Resources Research and Education center of Guilan, AREO, Rasht, Iran
Received: February 2017 ; Accepted: September 2018
Abstract
Afforestation, as a tool to mitigate carbon emission is constrained by available land area in several countries, but Iran has the potential of plantation. In doing so, differences in soil stocks between tree species could give an indication of the effects of future management changes. Hence, a better understanding of tree species traits on soil properties is required to predict how changes in ecosystems occur with tree species composition. This study investigated the effect of selected tree species on soil properties, carbon sequestration potential of tree species across soil profiles (0-200 cm) and evaluated the tree species effects on labile soil organic carbon pools to introduce a unique soil quality indicator. The study site was Shalman Research Station in the Hyrcanian forests, northern Iran. Our results showed significant alterations in soil properties by tree species with the greatest changes in the top soil layer. The greatest cation exchange capacity (CEC) difference (Δ 4.17) was
found between A. glutinosa and J. polycarpos in 0-20 cm. The greatest differences (Δ 2.58)
in mean weight diameter (MWD) of soil layers were found in the top soil layer between A.
glutinosa and T. distichum. All species produced also a higher N and organic carbon concentration in the top soil layer (0-20 cm) in the following order: A. glutinosa > Q. castaneifolia > P. caspica > J. polycarpos > T. distichum > P. taeda. The varied amount of total soil organic carbon stocks was greater under Alder (A. glutinosa) and Oak (Q. castaneifolia) than other tree species with 206.24 and 195.26 (Mg.ha-1), respectively; and P. taeda had the lowest amount (136.94 Mg ha-1) across the soil profile. For all labile pools, A. glutinosa and T. distichum had the highest and the lowest percent of labile organic carbon, respectively. Consequently, the Cmin in the range of 10.11-14.04% and microbial
biomass carbon in the range of 1.05-1.66% shared the highest and lowest proportion of soil organic carbon across 0-200 cm depth, respectively. We concluded that broadleaf trees had great potential for carbon sequestration across soil depth and among them; alder had high effect on soil properties and soil organic matter.
Keywords: Labile soil organic carbon; Carbon stocks; Soil properties; Broadleaf;
Coniferous; Water soluble organic carbon.1
Introduction
Soil organic matter (SOM) represents a large dynamic and complex terrestrial sink of carbon (including 950 Pg carbon just in the top 1 meter) in the form of organic compounds derived from plant, animal or microbial biomass (Lal et al., 2015). Due to the close association with soil properties and soil processes (Chen et al., 2004), maintaining a satisfactory soil organic carbon content is essentially required for improving soil health and effective carbon
sequestration management in various
ecosystems.
Among the ecosystems studied, forests have been highlighted because of their large intrinsic carbon pool with a large proportion (70% of all SOC) of it being contained within their soil (Perez-Cruzado
et al. 2012; Jobbágy and Jackson, 2000; Six
et al., 2002a). According to Kyoto Protocol (KP), carbon sequestration in terrestrial sinks can be used to offset greenhouse gas emission (Jandl et al., 2007). However, the ability to utilize afforestation as a tool to mitigate carbon emission is constrained by available land area in several countries. In countries with a low forest cover, however an increase in the forested area is on the political agenda. The total area of natural and man-made forests is approximately 13.4 and 0.95 million hectares, respectively, which covers only 8.7 percent of the total land area (Sagheb-Talebi et al., 2014). In this respect, Iran has the potential for plantation and afforestation. Plantation is becoming a key component of world forest resources and plays important roles in the context of overall sustainable forest management. Trees have extensive root systems which can grow deep into the mineral soil. The root-derived C inputs are critical sources for the SOC in deeper soil horizons (Kell, 2012). Specifically, root-derived C is more likely to be stabilized in the soil by physical and chemical interactions with soil particles than a shoot-derived C (Rasse et al., 2005). Hence the incorporation of trees, in particular, improves soil properties and can result in greater net C sequestration (Young, 1997).
In forest management systems,
differences in management, spatial
distribution of forest tree species and their diversity are assumed to influence the rate of soil carbon sequestration and accordingly the soil health (Ashton et al., 2012; Lorenz and Lal, 2010). Important in this respect is the choice of tree species which affects soil organic carbon by the amount and quality of OM input through litter fall and root activity. Differences in soil stocks between tree species could give an indication of the effects of future management changes. Besides, a better understanding of tree species effects on soil properties (i.e. aggregate stability, BD, pH, EC, CaCO3 and CEC) is required to predict how changes in ecosystems are altered with tree species composition. This knowledge may help guide tree species choice in case of afforestation with the aim of soil quality improvement. Many studies have shown SOM as a main soil quality indicator (Jinenez et al., 2002). However, it is difficult to detect the reflection of changes in SOM (Ghani, 2003); thus, more attention has been paid to the labile SOM pools (Gregorich et al., 2003; Kolar et al., 2009). Of these, soil microbial biomass C (SMB-C) and water soluble organic carbon (WSOC) are the most active fraction of SOM which have been used as quick and sensitive indicators of SOM changes (Harison et al., 1993, Ghani, 2003). WSOC is the part of dissolved organic carbon obtained by extracting a given mass or volume of soil with an aqueous solution (Piccolo. 1996). According to laboratory procedures and subsequent differences in
extracting carbon compounds, two
functional pools of WSOC are usually studied: cold water extractable organic carbon (CWEOC) and hot water extractable organic carbon (HWEOC) (Hamkalo and Bedernichek, 2014). Meanwhile, SMB has been suggested as a sensitive indicator that more quickly responds to environmental changes in soils (Wang and Wang, 2011). However, because of the time consuming
process of SMB determination and
forest tree species as soil quality indicator, especially in carbon sequestration projects have not been investigated yet.
The objectives of this paper were: (a) to assess the potential of carbon storage between tree species across the soil profile and choice of appropriate tree species for afforestation with the aim of carbon sequestration., (b) to reveal the distribution of SOC and labile organic carbon pools under different tree species and potential of singular tree species to affect soil properties and (C) to evaluate which one of labile organic carbon pool/pools could be used as a sensitive soil quality indicator in the northern forests of Iran. According to conclusions arising from previous studies, we hypothesized that tree species affect organic carbon content across soil profile and broadleaves may enhance soil organic carbon stocks, labile organic carbon pools and therefore soil quality. We also hypothesized that using labile organic carbon pools as the soil quality indicators may describe better soil quality and soil health.
Materials and methods Study area
The study was carried out in Shalman Seed and Seedling of Forest Tree Species Research Station; located in Guilan Province, at the town of Shalman (Langrud), Northwest of Iran, 37o 09'25"-35" N and 50o13'6"16" E at an altitude of
-16.0 m (Figure 1). The Guilan province is located in the southwest of Caspian Sea and has a humid subtropical climate. According to the 20 year of data collected at the Research Station, the average annual rainfall is 1180 mm. The average values of 35.5 mm and 181.0 mm are the lowest and highest amount of rainfall in July and October, respectively. The average annual temperature is 17.5oC and the mean of maximum and minimum air temperature are 26.3oC and 7.5oC in August and January respectively.
The soil moisture and temperature regimes of the study sites are aquic and mesic, respectively, and the soil is classified as aquepts according to the key for soil taxonomy 2010 (Soil Survey Staff, 2010), with medium texture class and inherited origin.
The Shalman Research Station consists of many indigenous and exotic forest tree species, including needle and broadleaf, planted in randomized plots (size range: 0.1-0.5 ha) at the same time (20 years old) on similar soil as explained by Vesterdal et al., (2013) for “planned multispecies common garden experimental design”. In this study six compartments under different tree species were selected for sampling.
These species are Populus caspica,
Quercus castaneifolia, Alnus glutinosa, Taxodium distichum, Pinus taeda and
Juniperus polycarpos.
P. caspica (Persian name: Sefid palat), is one of the native species of Hyrcanian temperate forests of northern Iran which is
grown generally in humid climate,
especially riverbanks where the ground water table is shallow. Therefore, this species has shallow and sensitive rooting system. Oak (Q. castaneifolia) also is one of the native species of Alborz mountain distributed in Hyrcanian forest. Oak is a deciduous broadleaf which covers about 6.5% of the Hyrcanian forest (Panahi et al., 2011). Alder (A. glutinosa) is deciduous broadleaf and most widely introduced elsewhere and is distributed in the northern forests of Iran. Alder‘s water use is high, so it can be found on stream banks and riverbanks. Alder is noted for the symbiotic relationship in its rooting system for nitrogen fixing, therefore it improves soil fertility and is a pioneer species. Bald cypress (T. distichum) is a deciduous conifer and an exotic species which has been introduced from inundated soils of south east Costal plains of the United States. Loblolly pine (P. taeda) is a fast growing needle leaf ever green conifer native to the Southeastern United States.
The loblolly pine has been introduced to and planted in mountains to lowlands of the Guilan Province since 1968 showing good adaption in northern forests of Iran (Pourbabaei and Roostami, 2007). Juniper (J. polycarpus) is one of the most common evergreen conifers and slow growing species. Juniper habitats are worldwide, including North America and Eurasia. Juniper is also well distributed in Iran, especially the northeastern forests in Golestan Province.
Sampling and analysis
Soil samples were collected in summer (July) 2014, when the soil had minimum moisture; and the water table was at the lowest depth (150 cm). According to the completely randomized block design, for every compartment, three soil profiles as three replications were made down to 200 cm. At each profile, soil samples were taken from ten 20 cm intervals: 0-20, 20-40, 40-60, 60-80, 80-100, 100-120, 120-140, 140-160, 160-180 and 180-200 cm (Figure 2). Sampling from intervals beneath the water table were taken immediately after pumping the water.
Figure 3. The total SOC stocks at different depths for tree species type
All soil samples were air-dried at room temperature (25 °C) and milled to pass through a 2 mm sieve followed by removing visible roots, organic residues, large debris and gravel; then samples were used for determination of chemical and physical properties: soil organic carbon (SOC) was measured using the dichromate oxidation method as described by Nelson and Sommers (1982), total nitrogen (TN) was determined according to Bremner and Mulvaney (1982), pH and EC were measured in saturated paste (McLean, 1982) and saturated paste extract (Miller and Curtin, 2008) respectively, cation exchange capacity was measured with standard method described by Rhoades (1982a), bulk density was determined by wax coating of soil clods method (Hao et al., 2008), CaCO3 content was measured by titration method (Nelson, 1982), aggregate stability was measured and expressed as a mean weight diameter (MWD) according to Golchin and Asgari (2008), soil texture was determined as described by Kroetsch and Wang (2008) followed by oxidizing organic matter of soil samples with 6% H2O2 according to Theng et al. (1999). Soil organic carbon storage down to 200 cm depth by volume for different vegetation cover type is given by:
=∑ × ×
10
Where SOCd is the volume of the total soil organic carbon (Mg.ha-1) across depth d (d=200 cm), OCi is the concentration of soil organic carbon (g.kg-1), BDi (g.cm-3) and Di (D=20 cm) are the dry bulk density and thickness layer i, respectively.
Soil microbial biomass C was measured by the chloroform fumigation extraction method (Vance et al., 1987); in brief duplicate 20 g soil subsamples were placed in 50 ml glass jars and moistened by adding distilled water to a soil moisture content of about 60% of water holding capacity. One jar was fumigated with chloroform for 24h at room temperature, then both fumigated and none fumigated soil samples were extracted with 0.5 M K2SO4 after 2 hours shaking. Carbon concentration in the extracts was measured by Shimadzu TOC analyzer. Microbial biomass C by applying the recovery factor of Wu et al (1996) and Wang et al., (2014) is given by:
=
Where MBC is microbial biomass C, EC is the difference in C concentration between fumigated and none fumigated soil samples and kEC is the recovery factor, 0.35.
26.46 26.63 25.82 33.05 28.25 35.81
24.16 20.56 18.26
27.32 21.66 27.42
11.76 13.19 10.12
24.88
8.36
28.56
12.22 13.12
7.57
16.62
10.13
15.10
10.65 13.38
12.41
14.29
10.57
15.97
12.97 15.09
11.63
14.71
9.02
16.46
12.33 13.65
12.53
14.63
9.40
16.39
15.23 14.52
12.30
16.97
12.35
18.00
15.27 15.42
12.79
16.58
12.55
16.88 14.43
15.42
13.51
16.21
13.24
15.65
0
50
100
150
200
250
T. distichum P. caspica P. taeda Q. castaneifolia J. polycarpos A. serrulata
To
ta
l
o
rg
an
ic
c
ar
b
o
n
s
to
ck
s
(
M
g/
h
a)
The carbon mineralization rate was determined by measuring soil respiration during 90 days of laboratory incubation experiment according to Beheshti et al.
(2012); 50 g of room temperature dried soil sample was placed in plastic jars after moistening by adding distilled water to a soil moisture content of about 60% (w/w) of water holding capacity. Three jars without soil sample were considered as blank. Before the incubation, all soil samples in jars were kept for 72 hours in a dark room at a constant temperature (25oC) for restoring the biomass and microbial activity. During the specific time intervals the evolved CO2 was trapped with a vial containing 10 ml 0.5 M NaOH in jars and replaced with the fresh one for the following time interval. For measuring the trapped CO2-C in NaOH, titration of excess NaOH with the 0.5 M HCl was followed by precipitating of carbonate with 15% BaCl2 solution. The cumulative CO2-C evolved from the soil samples during the experiment was expressed as soil carbon mineralization which initially reported as the part of the total soil organic carbon and was used for
comparison of soil organic matter
differences of sampling sites.
Cold and hot water extractable organic C were measured according to the methods of Haynes and Francis (1993) modified by Ghani et al. (2003). For cold water extractable organic C, in brief 3 g from each air dried soil samples were put in centrifuge tubes and shacked with 30 ml distilled water for 30 minutes at 30 rpm as an end over end form at 20oC; the suspensions were centrifuged at 3500 rpm for 20 min and then carbon concentration was detected with Shimadzu TOC analyzer followed by the supernatant solution filtering through 0.45 µm membrane filters. For hot water extractable organic C, similar sets were done but before the filtering of supernatant solution through 0.45 µm membrane filter, samples were put under steam of a hot water bath in 80oC for 18 hours and then carbon concentration was measured with Shimadzu TOC analyzer. For estimating total carbohydrate fraction (CHOHW) in soil samples, 2 ml of supernatants solution from hot water
extractable carbon experiment was mixed with 1 ml 5% phenol solution, then 5 ml of sulphuric acid (98%) was added. After 45 minutes the absorbance of this mixture was read on a spectrophotometer at 490 nm (Yousefi et al., 2008).
Statistical analysis
Prior to analysis, data were tested for assumption of normality and homogeneity of variances by Shapiro–Wilk Test and
Levene’s Test, respectively. The
experiments were of randomized complete block (RCB) designs. Vegetation types and soil depths were independent variables, and dependent variables included soil physico-chemical properties and soil labile organic carbon pools. Data for the same soil interval (ten 20 cm intervals) were subjected to two-way analysis of variance
(ANOVA) using SAS software for
Windows (SAS Institute, 2002), and all comparisons among the independent and dependent variables were conducted by least significant difference tests (LSD). Significance levels were set at p < 0.05 in all statistical analyses. Pearson linear correlations were used to assess the relationships among labile fractions of SOM and soil physico-chemical properties.
Results
Soil physical and chemical properties
Some chemical and physical soil properties under tree species plots in different layers are given in Table 1. ANOVA results indicate significant effects of tree species and depth as main factors and most of their interaction on the selected soil properties (Table 1). There were declining trend of CEC and MWD values down to profiles in all tree species plots. The greatest difference (Δ 4.17) was found between A.
layer (0-20 cm) with A. glutinosa and T. distichum having the maximum and minimum MWD values as 4.11 mm and 1.53 mm, respectively. Likewise, the effect of tree species and depth as main factors on pH, bulk density (BD), electric conductivity
(EC) and CaCO3 was statistically
significant but insignificant for their interactions. Therefore, a significant negative trend of pH changes down to soil profile was seen, which means soil acidity as the main factor increases with soil depth in all tree species plots. Though the highest and lowest pH values for 0–20 cm were seen under Bald cypress and Oak with pH
values 6.72 and 7.37, respectively, however differences among the tree species was insignificant (Table 1). Similar to soil acidity, the bulk density (BD) was increased significantly for all treatments with depth. There were insignificant differences of BD between tree species across soil layers, however the lowest and highest BD values were found under Oak and Juniper (1.35 and 1.53 g.m-3) for 0-20 cm. Despite significant effect of tree species and soil depth as the main factors, there was not special trend for EC and CaCO3 values in the soil profile.
Table 1. Selected chemical and physical properties in different soil layers under tree species (mean ± SEM, n=3)
Depth
(cm) Tree sp
BD (g cm-3)
CEC (cmol+ kg-1)
MWD
(mm) pH EC dS.m
-1 CaCO3
(g kg-1)
0-20
T. distichum 1.45±0.06 A(a) 14.00±0.23 C(a) 1.53±0.08C (a) 6.72±0.04 A(a) 0.90±0.01 A(a) 3.66±0.22 A(a)
P. caspica 1.44±0.03 A(a) 16.04±0.18 B(a) 2.42±0.29B (a) 7.14±0.13 A(a) 1.01±0.01 A(a) 4.35±0.20 A(a)
P. taeda 1.49±0.05A (a) 13.65±0.22 C(a) 1.76±0.11B C(a) 7.02±0.08 A(a) 0.97±0.01 A(a) 3.77±0.26 A(a)
Q. castaneifolia 1.35 ±0.03A(a) 16.38±0.27 B(a) 3.61±0.18A (a) 7.37±0.05 A(a) 1.05±0.07 A(a) 4.88±0.23 A(a)
J. polycarpos 1.53±0.03 A(a) 13.43±0.17 C(ab) 2.18±0.12B (a) 7.00±0.12 A(a) 0.93±0.04 A(a) 4.03±0.12 A(a)
A. glutinosa 1.36±0.04 A(a) 17.60±0.31 A(a) 4.11±0.17A (a) 7.30±0.10 A(a) 1.12±0.07 A(a) 4.96±0.22 A(a) 20-40
T. distichum 1.59±0.04 A(a) 14.26±0.13 C(a) 1.46±0.10C (a) 6.24±0.22 A(a) 0.82±0.03 A(a) 3.40±0.21 A(a)
P. caspica 1.55±0.03 A(a) 15.07±0.16 B(b) 1.93±0.10B (ab) 6.60±0.07 A(a) 0.91±0.03 A(a) 4.28±0.20 A(a)
P. taeda 1.69±0.04 A(a) 13.40±0.25 D(ab) 1.60±0.13B C(a) 6.46±0.07 A(a) 0.89±0.06 A(a) 3.48±0.23 A(a)
Q. castaneifolia 1.55±0.03 A(a) 15.72±0.24 AB(b) 3.06±0.17A (b) 6.93±0.18 A(a) 1.00±0.01 A(a) 4.64±0.24 A(a)
J. polycarpos 1.67±0.03 A(a) 13.60±0.13 CD(a) 1.78±0.16B C(b) 6.68±0.16 A(a) 0.82±0.05 A(a) 3.79±0.21 A(a)
A. glutinosa 1.50±0.02 A(a) 16.04±0.28 A(b) 3.52±0.15A (b) 7.11±0.06 A(a) 1.05±0.05 A(a) 4.65±0.21 A(a) 40-60
T. distichum 1.66±0.04 A(a) 13.12±0.24 CD(b) 1.08±0.15E (b) 6.16±0.21 A(a) 0.77±0.02 A(a) 3.52±0.18 A(a)
P. caspica 1.61±0.05 A(a) 13.85±0.36 BC(c) 1.67±0.12C (bc) 6.40±0.07 A(a) 0.93±0.01 A(a) 4.25±0.15 A(a)
P. taeda 1.70±0.02 A(a) 12.77±0.22 D(bc) 1.25±0.11D E(b) 6.23±0.06 A(a) 0.82±0.02 A(a) 3.32±0.22 A(a)
Q. castaneifolia 1.59±0.03A (a) 14.47±0.31 B(c) 2.67±0.15B (c) 6.80±0.10 A(a) 0.96±0.01 A(a) 4.63±0.20 A(a)
J. polycarpos 1.69±0.03 A(a) 12.99±0.06 D(bc) 1.50±0.04D C(c) 6.55±0.19 A(a) 0.80±0.07 A(a) 3.78±0.13 A(a)
A. glutinosa 1.61±0.03 A(a) 15.51±0.28 A(bc) 3.11±0.15A (c) 6.75±0.08 A(a) 0.96±0.03 A(a) 4.59±0.17 A(a) 60-80
T. distichum 1.65±0.03 A(a) 12.82±0.25 CD(bc) 0.64±0.10D (c) 6.12±0.22 A(a) 0.77±0.01 A(a) 3.59±0.17 A(a)
P. taeda 1.70±0.01 A(a) 12.61±0.25 D(bc) 0.75±0.10C D(c) 6.16±0.05 A(a) 0.80±0.02 A(a) 3.26±0.17 A(a)
Q. castaneifolia 1.66±0.03 A(a) 14.25±0.09 B(c) 2.24±0.16A (d) 6.44±0.10 A(a) 0.97±0.01 A(a) 4.78±0.18 A(a)
J. polycarpos 1.66±0.04 A(a) 12.58±0.28 D(cd) 1.11±0.09B C(d) 6.38±0.07 A(a) 0.85±0.08 A(a) 3.81±0.21 A(a)
A. glutinosa 1.63±0.04 A(a) 14.87±0.31 A(cd) 2.53±0.13A (d) 6.51±0.05 A(a) 0.94±0.03 A(a) 4.91±0.15 A(a) 80-100
T. distichum 1.67±0.03 A(a) 12.65±0.23 B(bc) 0.57±0.07B (c) 6.15±0.12 A(a) 0.80±0.02 A(a) 3.68±0.13 A(a)
P. caspica 1.69±0.05 A(a) 13.01±0.17 B(de) 0.78±0.08B (d) 6.43±0.14 A(a) 1.01±0.01 A(a) 5.11±0.19 A(a)
P. taeda 1.71± 0.03 A(a) 12.63±0.19 B(bc) 0.62±0.11B (cd) 6.20±0.06 A(a) 0.83±0.01 A(a) 3.34±0.14 A(a)
Q. castaneifolia 1.65± 0.02 A(a) 14.22±0.25 A(c) 1.20±0.09A (e) 6.44±0.07 A(a) 1.00±0.03 A(a) 4.96±0.11 A(a)
J. polycarpos 1.74±0.03 A(a) 12.27±0.13 B(d) 0.81±0.08B (e) 6.38±0.08 A(a) 0.89±0.02 A(a) 3.99±0.01 A(a)
A. glutinosa 1.73±0.02 A(a) 14.77±0.35 A(cd) 1.43±0.13A () 6.44±0.07 A(a) 1.00±0.00 A(a) 5.24±0.17 A(a) 100-120
T. distichum 1.67±0.04 A(a) 12.18±0.25 D(cd) 0.48±0.08A (c) 6.15±0.07 A(a) 0.84±0.02 A(a) 4.45±0.24 A(a)
P. caspica 1.71±0.04 A(a) 12.99±0.08 BC(de) 0.53±0.07A (d) 6.50±0.14 A(a) 1.04±0.04 A(a) 5.00±0.11 A(a)
P. taeda 1.73±0.04 A(a) 12.60±0.31 CD(bc) 0.53±0.07A (de) 6.18±0.03 A(a) 0.88±0.02 A(a) 3.86±0.17 A(a)
Q. castaneifolia 1.68±0.03 A(a) 13.49±0.25 AB(d) 0.65±0.05A (f) 6.44±0.09 A(a) 1.05±0.05 A(a) 4.69±0.25 A(a)
J. polycarpos 1.73±0.02 A(a) 12.30±0.16 CD(cd) 0.61±0.04A (ef) 6.36±0.07 A(a) 0.91±0.05 A(a) 4.47±0.25 A(a)
A. glutinosa 1.71±0.00 A(a) 14.10±0.26 A(a) 0.70±0.07A (e) 6.44±0.04 A(a) 1.00±0.06 A(a) 4.97±0.19 A(a) 120-140
T. distichum 1.69±0.05 A(a) 11.51±0.22 B(d) 0.45±0.04A B(c) 6.12±0.04 A(a) 0.90±0.02 A(a) 4.06±0.20 A(a)
P. caspica 1.69±0.05 A(a) 12.55±0.35 A(e) 0.46±0.03A B(d) 6.30±0.09 A(a) 1.03±0.04 A(a) 4.80±0.23 A(a)
P. taeda 1.74±0.04 A(a) 12.01±0.24 AB(cd) 0.41±0.06B (e) 6.19±0.05 A(a) 0.89±0.02 A(a) 3.95±0.07 A(a)
Q. castaneifolia 1.66±0.02 A(a) 12.44±0.27 AB(e) 0.47±0.05A B(f) 6.30±0.06 A(a) 1.06±0.02 A(a) 4.67±0.13 A(a)
J. polycarpos 1.75±0.04 A(a) 11.59±0.23 AB(e) 0.55±0.03A B(f) 6.31±0.08 A(a) 0.91±0.03 A(a) 4.01±0.25 A(a)
A. glutinosa 1.71±0.03 A(a) 12.59±0.28 A(e) 0.58±0.05A (f) 6.42±0.05 A(a) 0.97±0.03 A(a) 4.74±0.22 A(a) 140-160
T. distichum 1.72±0.03 A(a) 11.44±0.18 B(d) 0.44±0.07B (c) 6.05±0.09 A(a) 0.94±0.01 A(a) 3.90±0.36 A(a)
P. caspica 1.70±0.02 A(a) 11.62±0.20 AB(f) 0.45±0.09B (d) 6.16±0.06 A(a) 1.02±0.04 A(a) 4.61±0.28 A(a)
P. taeda 1.72±0.03 A(a) 11.49±0.21 B(d) 0.42±0.06B (e) 6.15±0.02 A(a) 0.96±0.03 A(a) 3.85±0.20 A(a)
Q. castaneifolia 1.70±0.02 A(a) 12.00±0.18 A(e) 0.45±0.05B (f) 6.26±0.04 A(a) 1.05±0.04 A(a) 4.24±0.22 A(a)
J. polycarpos 1.74±0.04 A(a) 11.26±0.09 B(e) 0.45±0.03B (f) 6.19±0.06 A(a) 0.93±0.01 A(a) 3.83±0.26 A(a)
A. glutinosa 1.72±.0.04 A(a) 12.02±0.11 A(ef) 0.54±0.06A (f) 6.16±0.06 A(a) 1.01±0.02 A(a) 4.26±0.21 A(a) 160-180
T. distichum 1.70±0.00 A(a) 11.46±0.21 ABC(d) 0.39±0.03A (c) 6.00±0.00 A(a) 0.97±0.01 A(a) 3.81±0.11 A(a)
P. caspica 1.72±0.02 A(a) 11.49±0.28 ABC(f) 0.38±0.06A (d) 6.10±0.02 A(a) 1.02±0.02 A(a) 4.65±0.23 A(a)
P. taeda 1.73±0.03 A(a) 11.40±0.16 BC(d) 0.38±0.05A (e) 6.12±0.03 A(a) 0.98±0.03 A(a) 3.91±0.15 A(a)
J. polycarpos 1.75±0.05 A(a) 11.12±0.07 C(e) 0.43±0.03A (f) 6.17±0.06 A(a) 0.97±0.05 A(a) 3.76±0.20 A(a)
A. glutinosa 1.75±0.04 A(a) 11.77± 0.20AB(ef) 0.52±0.04A (f) 6.18±0.04 A(a) 1.05±0.05 A(a) 4.43±0.18 A(a) 180-200
T. distichum 1.74±0.04 A(a) 11.54±0.30 A(d) 0.39±0.04A (c) 6.00±0.07 A(a) 0.97±0.01 A(a) 3.85±0.21 A(a)
P. caspica 1.71±0.03 A(a) 11.44±0.25 A(f) 0.38±0.06A (d) 6.10±0.04 A(a) 0.99±0.02 A(a) 4.61±0.26 A(a)
P. taeda 1.73±0.02 A(a) 11.54±0.33 A(d) 0.38±0.04A (e) 6.09±0.05 A(a) 0.98±0.01 A(a) 4.04±0.14 A(a)
Q. castaneifolia 1.69±0.03 A(a) 11.80±0.15 A(e) 0.42±0.03A (f) 6.20±0.07 A(a) 1.07±0.03 A(a) 4.29±0.24 A(a)
J. polycarpos 1.74±0.04 A(a) 11.27±0.24 A(e) 0.43±0.03A (f) 6.19±0.05 A(a) 0.96±0.03 A(a) 3.81±0.30 A(a)
A. glutinosa 1.73±0.03 A(a) 11.59±0.19 A(f) 0.49±0.04A (f) 6.19±0.01 A(a) 0.99±0.07 A(a) 4.49±0.15 A(a) Two-way ANOVA result (mean squares)
Tree Specious
(T) 0.27
**
17.06 ** 4.91** 0.65 ** 0.14 ** 6.74 **
Depth (D) 0.142** 30.79 ** 12.09 ** 1.58 ** 0.04** 0.55 **
T×D 0.003 ns 0.84 ** 0.53 ** 0.03 ns 0.004 ns 0.17 ns
BD, bulk density; CEC, cation exchange capacity; MWD, mean weight diameter and EC, electric conductivity. ns, not significant, ** Significant at P<0.01 and * Significant at P<0.05. Within a column mean values with different capital letters at each soil depth are significantly different between tree species type at P<0.05; within a column mean values with different small letter for each tree species type are significantly different between depths at P<0.05.
Soil organic carbon and nitrogen
Significant differences in SOC among tree species plots were observed at 0-20 cm to 140-160 cm. The greatest change (Δ 5.86) in SOC content between tree species plots was found in A. glutinosa and J. polycarpos plots with 8.83 (g.kg-1) and 2.50 (g.kg-1) respectively in 40-60 cm layer; whereas, a lower difference (Δ 1.00) was found between Q. castaneifolia and J.
polycarpos with the SOC concentration of 4.80 (g.kg-1) and 3.80 (g.kg-1) respectively in 180-200 cm. The greatest SOC content was observed in A. glutinosa with 13.11 (g.kg-1) in the top soil layer. Except 60-80, 160-180 and 180-200 cm, A. glutinosa had the highest content of SOC. In these layers Q. castaneifolia had the greatest organic carbon. All species had a higher organic carbon concentration in the top soil layer (0-20 cm) in the following order: A. glutinosa > Q. castaneifolia > P. caspica >
J. polycarpos > T. distichum > P. taeda
(Table 2).
Similarly, N concentration varied widely among tree species and its distribution at soil profiles. A. glutinosa with 1.45 (g.kg-1) had the greatest N concentration at top soil layer between all tree species and across soil depths. Likewise SOC, for all tree species a higher N concentration was found
in 0-20 cm that followed the same order. The greatest change (Δ 0.65) in N concentration was observed between A.
glutinosa and J. polycarpos plots with 0.89 (g.kg-1) and 0.24 (g.kg-1) respectively in 40-60 cm layer; and similar to SOC, very low differences (Δ 0.19) was observed between
Q. castaneifolia and J. polycarpos with N concentration of 0.65 (g.kg-1) and 0.46 (g.kg-1) respectively in 180-200 cm.
Soil organic C and N distribution for each tree species in the soil profile had the same trend; decreasing with increasing soil depth. In contrast, the differences between C and N concentrations among tree species in the soil profile diminished with increase in soil depth. Consequently, the higher
SOC:TN ratios with considerable
differences between tree species plots were found in the top soil layer (0-20 cm) with the following order: P. taeda > T. distichum
The varied amount of total SOC stocks was greater under Alder (A. glutinosa) and Oak (Q. castaneifolia) than other tree species with 206.24 and 195.26 (Mg.ha-1), respectively; and P. taeda had the lowest amount at 136.94 (Mg ha-1) across the soil profile (Figure 3). The effect of tree species on SOC stocks was measured for each soil interval as well: approximately higher amount of SOC stocks in 0-20 and 20-40 cm than other layers was the common pattern for all tree species. In these layers, the highest amounts with 35.81 and 33.05 (Mg.ha-1) (for 0-20) and; 27.42 and 27.32 (Mg ha-1) (for 20-40 cm) were found under Alder (A. glutinosa) and Oak (Q. castaneifolia) respectively. Although the SOC stocks generally decreased strongly after second layer for J. polycarpos, T. distichum and P. taeda, however SOC stocks with 28.56, 24.88 (Mg ha-1) under Alder (A. glutinosa) and Oak (Q. castaneifolia), respectively were still high (Figure 3).
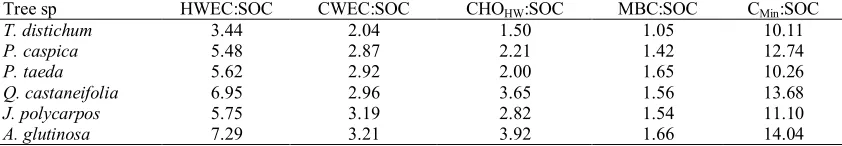
Labile organic carbon pools
The C content of each of the labile organic carbon pools varied between tree species and soil depth (Table 2). A negative trend in all labile organic carbon pools was observed with soil depth. Similar to total SOC, the highest and significant differences (P>0.05) at each labile organic carbon pool were observed in the uppermost layers. After 12 weeks of laboratory incubation, respired organic carbon (Cmin) ranged 2222.75-1250.03 (mg.kg-1) and the highest differences (Δ 972.72), were reported from
A. glutinosa and P. taeda plots at 0-20 cm layer. SMB-C was significantly affected by tree species plots; this significance was less pronounced after 60-80 cm. As a great significant difference, in 0-20 interval, SMB ranged 357.13-136.00 (mg.kg-1) reported from A. glutinosa and T. distichum
plots, respectively. Likewise SMB- C, A.
glutinosa and T. distichum were found as the highest and the lowest (0-20 cm) in
HWEOC, CWEOC and CHOHW with the
range of 440.27-1030.06, 255.24-560.12 and 211.23-655.20 (mg.kg-1). Additionally, influences of tree species types on “labile organic carbon to SOC” ratios were
observed across soil profiles (Table 4). For all labile pools, A. glutinosa and T. distichum had the highest and the lowest
percent of labile organic carbon,
respectively. Consequently, the Cmin in the range of 10.11-14.04% and SMB-C in range of 1.05-1.66% had the highest and lowest proportion of SOM across 0-200 cm depth, respectively.
Discussion
Because of the small scale of the experimental site and the plantation of tree species types adjacently; generally, the soil alteration was insignificant, especially while soils under trees developed from the same parent material, therefore it is assumed that the soils of the studied area
were similar before plantation.
Consequently, observable differences in soil characteristics, originated from tree species impacts on soil medium. This assumption had been the base for other similar studies (Smolander and Kitunen, 2002; Reich et al., 2005; chen et al., 2004).
Depth and soil chemical and physical properties
Soil bulk density is an important
parameter in soil organic carbon
sequestration studies. BD has been
frequently related to SOM (Perie and Ouimet, 2008). The inverse correlation between SOM and BD is normal. In general, the natural BD increases with soil depth due to decrease in SOM and porosity. As expected, our results showed BD values had negative correlation with SOC (Table 3). This can confirm the results of other studies on forest soils (Don et al., 2007; Heuscher et al., 2005; Grüneberg et al., 2014). Besides, BD was generally increased across the soil profiles due to the weight of overburdened soil (Grüneberg et al., 2014).
Many studies showed that aggregate stability as one of the soil physical properties can be used to evaluate soil
quality in agricultural and forest
management systems (i.e., Golchin and Asgari, 2008; Beheshti et al., 2012; An et al., 2010; Parsakhoo et al., 2014 and Ramesh et al., 2015) and SOM with its fractions is the main factor to control aggregate stability which have positive
correlation with aggregation (Diaz et al., 1994; Golchin et al., 1995; Cerdà., 1998). Golchin et al. (1995) reported that macro aggregates are stabilized by carbohydrate within aggregates. Increasing aggregate stability in the top soil layer under forest and shrub vegetation was reported by An et al. (2010). They showed that the higher SOM and carbohydrate content, especially in 0-10 cm affected aggregate stabilization through bridging between clay particles. These findings were similar to our results and confirm them. CEC is linked to SOM content, therefore the high level of CEC in the top soil layers of tree species plots can be explained by the presence of organic matter. Our results are in line with findings of other researchers which showed higher soil organic carbon contents have higher CEC and vice versa (i.e. Yimer et al., 2006; Demssie et al., 2012; Rezaei and Gilkes, 2005). CEC changes can also be caused by natural processes such as occurrence of base cations i.e. Ca2+, therefore besides abatement of SOM, lower soil pH can cause a decline in CEC across soil profiles.
Table 3. Correlation coefficient among basic soil properties and labile soil organic carbon pools
BD HWEOC CWEOC CHOHW CEC pH EC CaCO3 C:N SOC MWD MBC C Min
HWEOC -0.915**
CWEOC -0.805** 0.900**
CHO(HW) -0.865** 0.960** 0.964**
CEC -0.824** 0.904** 0.980** 0.952**
pH -0.900** 0.856** 0.734** 0.797** 0.796**
EC -0.931** 0.958** 0.895** 0.934** 0.914** 0.904**
CaCO3 -0.818** 0.890** 0.929** 0.909** 0.930** 0.771** 0.906**
C:N -0.816** 0.756** 0.654** 0.707** 0.712** 0.839** 0.865** 0.680**
SOC -0.868** 0.893** 0.870** 0.892** 0.890** 0.869** 0.926** 0.857** 0.699**
MWD -0.828** 0.911** 0.976** 0.956** 0.997** 0.800** 0.915** 0.918** 0.718** 0.886**
MBC -0.776** 0.878** 0.956** 0.949** 0.907** 0.647** 0.832** 0.871** 0.528** 0.816** 0.906**
C Min -0.523** 0.653** 0.613** 0.646** 0.560** 0.448** 0.561** 0.543** 0.156* 0.640** 0.562** 0.699**
TN -0.834** 0.828** 0.734** 0.768** 0.755** 0.813** 0.913** 0.733** 0.925** 0.777** 0.759** 0.641** 0.441**
HWEOC, hot water extractable organic carbon; CWEOC, cold water extractable organic carbon; CHOHW, hot water
extractable carbohydrate; CEC, cation exchangeable capacity; EC, electric conductivity; SOC; Soil organic carbon;
MWD, mean weight diameter; MBC, microbial biomass carbon; Cmin, carbon mineralization and TN, total nitrogen.
** Significant at P<0.01 and * Significant at P<0.05
Table 4. Percentage ratios (%) of labile organic carbon to soil organic carbon of soil profiles (0-200 cm) under different tree species
Tree sp HWEC:SOC CWEC:SOC CHOHW:SOC MBC:SOC CMin:SOC
T. distichum 3.44 2.04 1.50 1.05 10.11
P. caspica 5.48 2.87 2.21 1.42 12.74
P. taeda 5.62 2.92 2.00 1.65 10.26
Q. castaneifolia 6.95 2.96 3.65 1.56 13.68
J. polycarpos 5.75 3.19 2.82 1.54 11.10
A. glutinosa 7.29 3.21 3.92 1.66 14.04
Soil properties and tree species traits
According to the results, besides significant differences between tree species as the main factor, the broadleaf and conifer (needle leaf) groups are also different in their effects. This is the important factor identified as responsible for underlying differences in soils beneath tree species.
Most research showed that leaf
decomposition is faster for broadleaved than for coniferous species (Kavvadias et al., 2001); because of the low quality nature and nutrient content of coniferous litter (Alva
rez et al., 2008); For example, differences in soil acidity among soils under tree species attributed to differences in litter calcium concentrations (Reich, 2005). Hence broadleaf trees like those selected in this research with high Ca2+ content induced increases in soil pH. Furthermore, compared with broadleaf, conifer needles contain more components that are difficult to decompose, resulting in less elements
release and consequently poor
incorporation in the mineral top soil (Wang
et al., 2014). This can be explained by low content of soil organic matter in T. distichum, P. taeda and J. polycarpos. Our findings were inconsistent with the study of
Diaz-Pines et al. (2011). In their
experiment, Scots pine stored significantly more organic carbon than Pyrenean oak in the uppermost layer of the mineral soil (0-5 cm), due to the low litter fall C inputs and basal area. Differently, Van Nevel et al., (2014) reported the oak stands produced less, but high quality litter fall than the pine stands, therefore top soils in oak stands had higher pH, CEC and lower C:N than in pine stands.
The C:N ratio is another important indicator of soil quality and fertility in forest ecosystems. Therefore, the effect of the soil C:N ratio is tree species dependent (Cools et al., 2014). Our findings showed that, the broadleaf plantations (P. caspica, Q. castaneifolia and A. glutinosa) had a lower litter C:N ratio than the coniferous plantations (T. distichum, P. taeda and J. polycarpos). The results are in accord with those reported by other researchers which
showed broadleaves litter had lower C:N ratio (i.e., Jandle, 2007; Van Nevel et al., 2014).
Many researchers have shown that aggregate stability is one of the important features of soil quality (Schoenholtzw et al., 2000), besides, organic matter and its fractions are the aggregation supplies which sequestered within aggregates and protected against degradation (Carter and Gregorich, 1996). Therefore, organic matter tends to increase aggregate stability (Kara and Baykara, 2014; Mandiola et al., 2011). We found increasing aggregate stability approximately in the following order: A. glutinosa > Q. castaneifolia > P. caspica >
J. polycarpos > T. distichum > P. taeda,
Variations of labile organic carbon pools beneath tree species
In agreement with many studies (i.e. Jiang and Xue, 2006; Vesterdal et al., 2013; Golchin and Asgari, 2008; Beheshti et al., 2012), our results revealed dependency of SOC to vegetation types. However, the strongest relationships were found between soil labile organic carbon pools and tree species. The percentage ratios of WSOC to SOC as well as their concentrations were in the following order: HWEOC > CWEOC > CHOHW (Table 4). WSOC extraction with hot water kills living cells, then making their component extractable. Also a vast range of non-microbial organic matter extracts (i.e. root exudates, soluble carbohydrates and amino acids) are derived using hot water (Hamkalo et al., 2014 and Ghani et al., 2003). In accord with our results, some earlier studies (i.e., Gregorich
et al., 2003) have shown that extracted hot water organic carbon content was twofold more than cold water extraction (Table 4). Meanwhile, some researchers believed that CHOHW was the important fraction of HWEOC, which originated by SMB and generally related to aggregate stability (Hynes and Beare, 1997; Ball et al., 1996).
Comparison of WSOC pools, MBC and Cmin among tree species showed higher content in broadleaves than coniferous, which was in line with other similar research (i.e. Wang and Wang, 2007; Wang and Wang, 2011). We did not find any literature regarding the effect of different tree species type on the labile SOC (i.e., extractable water soluble carbon and microbial biomass) in forest soils of Iran. For instance, Wang and Wang (2011) in the Huiltong National Research Station of Forest Ecosystem, China reported, beside higher content of 0-10 cm soil layer than 10-20 cm, broadleaf forest had higher concentration of cold and hot water soluble soil organic matter, SMB-C and soil respiration rate. Likewise, Smolander and Kitunen (2002) found higher values of SMB-C and WSOC in Birch forest rather than Spruce and Pine forests. Other similar results were reported by Jiang and Xue (2006). They concluded due to larger organic C storage, SMB and WSOC in soil
beneath broadleaf forest were significantly higher than those under Masson pine and Chinese fir. Liu and Luo, (1990) also reported great MBC content in broadleaf forest soils. Large volume of litter input with a variety of nutrient elements in soils under broadleaf trees provide optimum condition for microbial activity and
consequently improved humification
process. Further, conifers have shallower rooting systems than broadleaves; therefore their organic carbon is accumulated in the soil surface (Jandl et al., 2007). Finally, in these acid soils under conifers, soil fauna are less active, decreasing the amount of humus mixed with mineral soil and subsequently more material on the forest floor being left.
CHOHW) with SMB-C, no single pool could be used as a sensitive soil indicator for tree species types.
Conclusion
This study has clearly demonstrated that tree species type can mediate soil physico-chemical properties and also labile water soluble organic carbon pools in Shalman research station as part of the northern forest (Hyrcanian) of Iran. The broadleaf tree species had positive effects on soil properties and a high content of SOM in labile pools; this result means broadleaves could create a more favorable condition for soil health. Broadleaves had also great
potential for carbon sequestration across soil depth. Due to mycorrhizal fungi symbiotic nitrogen fixers, among broadleaf species, alder had great effect on soil properties and SOM. Finally, the use of labile organic carbon pools as a soil quality indicator were more effective than bulk SOM, however, no single and more sensitive organic carbon pool as a soil quality indicator of forest tree species changes was selected. We suggest that the complex of soil organic carbon pools
including CWEOC, CHOHW and HWEOC
could be used for monitoring of
managements in northern forest ecosystems of Iran.
References
Alvarez, E., Fernandez Marcos, M.L., Torrado, V. and Fernandez Sanjurjo, M.J. 2008. Dynamics of macronutrients during first stage of litter decomposition from forest species in a temperate area (Galicia, NW Spain). Nutrient Cycling in Agroecosystems. 80(3), 243-256. An, S., Mentler, A., Mayer, H. and Blum, W.E.H. 2010. Soil aggregation, aggregate stability,
organic carbon and nitrogen in different soil aggregate fractions under forest and shrub vegetation on the Loess Plateau, China. Catena, 81, 226-233.
Ashton, M.S., Tyrrell, M.L. and Gentry, B. 2012. Managing forest carbon in a changing climate. Springer Science and business Media, New York. pp. 414.
Ball, B.C., Cheshire, M.V., Robertson, E.A.G. and Hunter, E.A. 1996. Carbohydrate composition in relation to structural stability, compatibility and plasticity of two soils in a long term experiment. Soil and Tillage Research, 139(3-4), 143-160.
Beheshti, A., Raiesia, F. and Golchin, A. 2012. Soil properties, C fractions and their dynamics in land use conversion from native forests to croplands in northern Iran. Agricultural Ecosystem Environment, 148, 121–133.
Benbi, D.K., Brar, K., Toor, A.S. and Singh, P. 2015. Total and labile pools of soil organic carbon in cultivated and undisturbed soils in northern India. Geoderma. 237, 149–158. Binkley, D. and Giardina, C. 1998. Why do tree species affect soils? The warp and woof of
tree-soil interactions. Biogeochemistry, 42, 89-106.
Bremner, J.M. and Mulvaney, C.S. 1982. Nitrogen-total. pp: 595–624. In: Page, A. L., Miller, R.H. and Keeney, D.R., (Eds.). Methods of Soil Analyses. Part 2: Chemical and Microbiological Properties. 2nd ed. American Society of Agronomy, Madison, WI.
Carter, M.R. 2002. Soil quality for sustainable land management: Organic matter and aggregation interactions that maintain soil functions. Agronomy Journal. 94, 38–47.
Carter, M.R. and Gregorich, E.G. 1996. Methods to characterize and quantify organic matter storage in soil fractions and aggregates. p. 449-466. In: Carter, M.R. and Stewart (eds), Structure and soil organic matter storage in agricultural soils. Lewis Publishers. CRC Press, Boca Raton, Fl.
Cerdà, A. 1998. Soil aggregate stability under different Mediterranean vegetation types. Catena. 32(2), 73–86.
Chen, CR., Xu, Z.H., Mathers, N.J., 2004. Soil carbon pools in adjacent natural and plantation forests of subtropical Australia. Soil Science Society American Journal. 68, 282–291. Demessie, A., Sing, B.R., Lal, R. and Borresen, T. 2012. Effet of eucaliptus and coniferous
Diaz, E., Roldan, A., Lax, A. and Albaladejo, J. 1994. Formation of stable aggregates in degraded soil by amendment with urban refuse and peat. Geoderma, 63 (3–4), 277–288. Don, A., Schumacher, J., Scherer-Lorenzen, M., Scholten, T. and Schulze, E.D. 2007. Spatial
and vertical variation of soil carbon at two grassland sites - Implications for measuring soil carbon stocks. Geoderma, 141, 272–282.
Ghani, A., Dexter, M. and Perrott, K. 2003. Hot-water extractable carbon in soils: a sensitive measurement for determining impacts of fertilization, grazing and cultivation. Soil Biological Biochemistry. 35(9), 1231–1243.
Golchin, A., and Asgari, H. 2008. Land use effects on soil quality indicators in north-eastern Iran. Soil Research. 46(1), 27–36.
Graft, F. and Frei, M. 2013. Soil aggregate stability related to soil density, root length and mycorrhiza using site specific Alnus incara and Melanogaster variegatus S.L. Ecological Engineering. 57, 314-323.
Golchin, A., Clarke, R., Oades, J.M., and Skjemstad, J.O. 1995. The effects of cultivation on the composition of organic matter and structural stability of soils. Australian Journal of Soil Research. 33, 975–993.
Gregorich, E.G., Beare, M.H., Stoklas, U. and St-Georges, P. 2003. Biodegradability of soluble organic matter in maize-cropped soils. Geoderma, 113, 237-252.
Grüneberg, E., Ziche, D. and Wellbrock, N. 2014. Organic carbon stocks and sequestration rates of forest soils in Germany. Global Change Biology, 1, 1-10.
Hamkalo, Z., Bedernichek, T. and others. 2014. Total, cold and hot water extractable organic carbon in soil profile: impact of land-use change. Zemdirbyste –Agriculture, 101(2), 125– 132.
Hao, X., Ball, B.C., Culley, J.L.B., Carter, M.R. and Parkin, G.W. 2008. Soil density and porosity. pp: 743-759. In: Carter, M.R. and Gregorich, E.G., (Eds.). Soil Sampling and Methods of Analysis. Canadian Society of Soil Science, CRC Press, Taylor & Francis Group, Boca Raton, FL.
Harison, K.G., Broecker, W.S. and Bonani, G. 1993b. The effect of changing land use on soil radiocarbon. Science, 262, 725-726.
Haynes, R.J. and Beare, M.H. 1997. Influence of six crop species on aggregate stability and some labile organic matter fractions. Soil Biological Biochemistry, 29:1647-1653.
Haynes, R.J. and Francis, G.S. 1993. Changes in microbial biomass C, soil carbohydrate composition and aggregate stability induced by growth of selected crop and forage species under field conditions. Eurpian Journal of Soil Scirnce., 44, 665-675.
Heuscher, S.A., Brandt, C.C. and Jardine, P.M. 2005. Using soil physical and chemical properties to estimate bulk density. Soil Science Society American Journal, 69, 51–56. Jandl, R., Lindner, M., Vesterdal, L., Bauwens, B., Baritz, R., Hagedorn, F., Johnson, D.W.,
Minkkinen, K. and Byrne, K.A. 2007. How strongly can forest management influence soil carbon sequestration. Geoaderma. 137, 253-268.
Jiang, P.K. and Xu, Q.F. 2006. Abundance and dynamics of soil labile carbon pools under different types of forest vegetation. Pedosphere, 16(4), 505-511.
Jinenez, M.P., Horra, A.M., Pruzzo, L. and Palma R.M. 2002. Soil quality: a new index based on microbiological and biochemical parameter. Biol Fert Soils, 35, 302-306.
Jobbágy, E.G., and Jackson, R.B. 2000. The vertical distribution of soil organic carbon and its relation to climate and vegetation. Ecological Application. 10, 423–436.
Joergensen, R.G., and Scheu, S., 1999. Depth gradients of microbial and chemical properties in moder soils under beech and spruce. Pedobiologia 43, 134–144.
Johnson, D.W. and Curtis, P.S. 2001. Effects of forest management on soil C and N storage: Meta-analysis. Forest Ecology Management. 140, 227–238.
Kavvadias, V.A., Alifragis, A., Tsiontsis, G., Brofas, G. and Stamatelos, G. 2001. Litterfall, litter accumulation and litter decomposition rates in four forest ecosystem in northern Greece. Forest Ecology Management. 144, 113-127.
Kell, D.B. 2012. Large scale sequestration of atmospheric carbon via plant roots in natural and agricultural ecosystems: why and how. Philosophical Transactions of the Royal Society. Section B.1, 1-10.
Kolar, L., Kuzel, S., Horacek, J., Cechova, V., Borova-Batt, J. and Peterka, J. 2009. Labile fraction of soil organic matter, their quantity and quality. Plant Soil Environment. 55, 245-251.
Kroetsch, D. and Wang, C. 2008. Particle size distribution. pp: 713-725. In: Carter, M. R. and Gregorich, E.G., (Eds.). Soil Sampling and Methods of Analysis. Canadian Society of Soil Science, CRC Press, Taylor and Francis Group, Boca Raton, FL.
Lal, R., Negassa, W. and Lorenz, K. 2015. Carbon sequestration in soil. Curr Opin Environ Sustain. 15, 79-86.
Liu, C.H. and Luo, R.Y. 1990. Chemical characteristics of humus in forest soils of Nanjing-Zhenjiang Hills. Journal of Nanjing Forestry University (in Chinese) In: Jiang, P. K. and Xu, Q.F. 2006. Abundance and dynamics of soil labile carbon pools under different types of forest vegetation. Pedosphere, 16(4), 505-511.
Lorenz, K. and Lal, R. 2010. Carbon sequestration in forest ecosystems. Dordrecht, The Netherland: Springer Science and business Media. pp. 277.
Mandiola, M., Studdert, G.A., Dominguez, G.F. and Videla, C.C. 2011. Organic matter distribution in aggregate size of a mollisol under contrasting managements. Journal of Soil Science Plant Nutrition., 11(4), 41-57.
McLean, E.O. 1982. Soil pH and lime requirement. pp: 199–224. In: Page, A. L., Miller, R. H., Keeney, D.R., (Eds.). Methods of Soil Analyses., Part 2: Chemical and Microbiological Properties. 2nd ed. American Society of Agronomy, Madison, WI.
Miller, J.J. and Curtin, D. 2008. Electrical Conductivity and Soluble Ions. pp: 161-171. In: Carter, M.R. and Gregorich, E.G., (Eds.). Soil Sampling and Methods of Analysis. Canadian Society of Soil Science, CRC Press, Taylor and Francis Group, Boca Raton, FL.
Nelson, D.W., Sommers, L.E. 1982. Total carbon, organic carbon, and organic matter. pp: 539– 579. In: Page, A.L., Miller, R.H., Keeney, D.R., (Eds.). Methods of Soil Analysis., Part 2: Chemical and Microbiological Properties. 2nd ed. American Society of Agronomy, Soil Science Society of America, Madison, WI.
Nelson, R.E. 1982. Carbonate and gypsum. pp: 181–197. In: Page, A.L., Miller, R.H. and Keeney, D.R., (Eds.). Methods of Soil Analysis, Part 2: Chemical and Microbiological Properties., 2nd ed. American Society of Agronomy, Soil Science Society of America, Madison, WI.
Panahi, P., Jamzad, Z., Pourmajidian, M.R., Fallah, A. and Pourhashemi, M. 2011. A revision of chestnut-leaved Oak (Quercus castaneifolia C.A. Mey.; Fagaceae) in Hyrcanian forests of Iran. Caspian Journal of Environmental Science. 9(2), 145-158.
Parsakhoo, A., Lotfalian, M., Kavian, A. and Hosseini, S.A. 2014. Assessment of soil erodibility and aggregate stability for different parts of a forest road. Journal of Forest Research. 25(1), 193-200.
Pérez-CruzadO C, Mansilla-salinerO P, Odríguez-sOalleir and Merino, A. 2012. Influence of tree species on carbon sequestration in afforested pastures in a humid temperate region. Plant and Soil. 353, 333–353.
Perie, C. and Ouimet, R. 2008. Organic carbon, organic matter and bulk density relationships in boreal forest soils. Canadian Journal of Soil Science. 88(3), 315-325.
Piccolo, A. 1996. Humic substances in terrestrial ecosystems. Elsevier. Netherlands. pp.675. pourbabaei, H. and Roostami, S.T. 2007. Study of plant species diversity in Loblolly Pine (P.
Ramesh, T., Manjaiah, K., Mohopatra, K., Rajasekar, K. and Ngachan, S. 2015. Assessment of soil organic carbon stocks and fractions under different agroforestry systems in subtropical hill agroecosystems of north-east India. Agroforest Syst. 89, 677-690.
Rasse, D.P., Li, J.H. and Drake, B.G. 2005. Seventeen years of elevated CO2 exposure in a Chesapeake Bay wetland: Sustained but contrasting responses of plant growth and CO2 uptake. Global Change Biology. 11, 369-377.
Reich, P.B., Oleksyn, J., Modrzynski, J., Mrozinski, P., Hobbie, S.E., Eissenstat, D.M., Chorover, J., Chadwick, O.A., Hale, C.M. and Tjoelker, M.G. 2005. Linking litter calcum, earthworms and soil properties: a common garden test with 14 tree species. Ecological Letter, 811-818.
Resh, S.C., Binkley, D. and Parrotta J.A. 2002. Greater soil carbon sequestration under Nitrogen-fixing trees compared with Eucalyptus species. Ecosystems, 5: 217–231.
Rezaei, S.A. and Gilkes, R.J. 2005. The effects of landscape attributes and plant community on soil chemical properties in rangelands. Geoderma, 125, 167–176.
Rilling, M C. and Mummey, D.L. 2006. Mycorrhizas and soil structure. New Phytol. 171, 41-53.
Rhoades, J. D. 1982a. Cation exchange capacity. pp: 149–157. In: Page, A.L., Miller, R.H. and Keeney, R., (Eds.), Methods of Soil Analysis., Part 2: Chemical and Microbiological Properties., 2nd ed. American Society of Agronomy, Madison WI
Sagheb-Talebi, K., Sajedi, T. and Pourhashemi, M. 2014. Forests of Iran: A treasure from the past, a hope for future. Plant and Vegetation, Vol. 10, Springer Verlag, Dordrecht, pp. 152. SAS Institute, Inc., 2002. Statistical Analysis Software Version 8.2 for Microsoft Windows.
SAS Institute Inc. SAS Institute, Cary, NC.
Schoenholtz, S.H., Van Miegroet, H. and Burger, J.A. 2000. A review of chemical and physical properties as indicators of forest soil quality: challenges and opportunities. Forest Ecological Managment, 138, 335-356.
Six, J., Bossuyt, H., Degryze, S., and Denef, K. 2004. A history of research on the link between (micro) aggregates, soil biota, and soil organic matter dynamics. Soil Tillage Res. 79, 7-31. Six, J., Callewaert, P., Lenders, S., Gryze, S.D., Morris, S.J., Gregorich, E.G., Paul, E.A.,
Paustian, K., 2002a. Measuring and understanding carbon storage in afforested soils by physical fractionation. Soil Science Society American Journal. 66, 1981–1987.
Smolander, A. and Kitunen, V. 2002. Soil microbial activities and characteristics of dissolved organic C and N in relation to tree species. Soil Biological Biochemistry. 34, 651–660. Soil Survey Staff. 2010. Keys to soil taxonomy. USDA Natural Resources Conservation
Service, Washington, DC.
Theng, B.K.G., Ristori, G.G., Santi, C.A. and Percival, H.J. 1999. An improved method for determining the specific surface areas of topsoils with varied organic matter content, texture and clay mineral composition. Eurpian Journal of Soil Science. 50, 309-316.
Van Nevel, L., Mertens, J., Demey, A., De Schrijver, A., De Neve, S. and Verheyen, K. 2014. Can shrub species with higher litter quality mitigate soil acidification in pine and oak forests on poor sandy soils? Forest Ecology Management, 330, 38-45.
Vance, E.D., Brookes, P.C. and Jenkinson, D.S. 1987. Microbial biomass measurements in forest soils: the use of the chloroform fumigation incubation method for strongly acid soils. Soil Biology Biochemistry. 19, 697–702.
Vesterdal, L., Clarke, N., Sigurdsson, B.D. and Gundersen, P. 2013. Do tree species influence soil carbon stocks in temperate and boreal forests? Forest Ecology Management, 309, 4–18. Wang, D., Niu, B.W. and X. 2014. Effects of natural forest types on soil carbon fraction in
North-East China. Journal Of Tropical Forest Science, 26(3), 362–370.
Wang, Q., and Wang, S. 2007. Soil organic matter under different forest types in Southern China. Geoderma. 142(3), 349–356.
Wu, J., Joergensen, R.G., Pommerening, B., Chaussod, R., and Brookes, P.C. 1990. Measurement of soil microbial biomass C by fumigation–extraction: an automated procedure. Soil Biology and Biochemistry. 22, 1167–1169.
Yimer, F., Ledin, S. and Abdelkadir, A. 2006. Soil organic carbon and total nitrogen stocks as affected by topographic aspect and vegetation in the Bale Mountains, Ethiopia. Geoderma, 135, 335-344.
Young, A. 1997. Agroforestry for soil management. 2nd edition. CAB International, Wallingford, UK. pp. 320