Predicting emergency coronary artery
bypass graft following PCI: application
of a computational model to refer
patients to hospitals with and without
onsite surgical backup
Zeeshan Syed,1Mauro Moscucci,2David Share,3Hitinder S Gurm4
To cite:Syed Z, Moscucci M, Share D,et al. Predicting emergency coronary artery bypass graft following PCI: application of a
computational model to refer patients to hospitals with and without onsite surgical backup.Open Heart2015;2: e000243. doi:10.1136/ openhrt-2015-000243
▸Additional material is available. To view please visit the journal (http://dx.doi.org/ 10.1136/openhrt-2015-000243)
Received 23 January 2015 Revised 25 September 2015 Accepted 29 September 2015
For numbered affiliations see end of article.
Correspondence to Dr Hitinder S Gurm; hgurm@med.umich.edu
ABSTRACT
Background:Clinical tools to stratify patients for
emergency coronary artery bypass graft (ECABG) after percutaneous coronary intervention (PCI) create the opportunity to selectively assign patients undergoing procedures to hospitals with and without onsite surgical facilities for dealing with potential complications while balancing load across providers. The goal of our study was to investigate the feasibility of a computational model directly optimised for cohort-level performance to predict ECABG in PCI patients for this application.
Methods:Blue Cross Blue Shield of Michigan
Cardiovascular Consortium registry data with 69 pre-procedural and angiographic risk variables from 68 022 PCI procedures in 2004–2007 were used to develop a support vector machine (SVM) model for ECABG. The SVM model was optimised for the area under the receiver operating characteristic curve (AUROC) at the level of the training cohort and validated on 42 310 PCI procedures performed in 2008–2009.
Results:There were 87 cases of ECABG (0.21%) in
the validation cohort. The SVM model achieved an AUROC of 0.81 (95% CI 0.76 to 0.86). Patients in the predicted top decile were at a significantly increased risk relative to the remaining patients (OR 9.74, 95% CI 6.39 to 14.85, p<0.001) for ECABG. The SVM model optimised for the AUROC on the training cohort significantly improved discrimination, net
reclassification and calibration over logistic regression and traditional SVM classification optimised for univariate performance.
Conclusions:Computational risk stratification directly
optimising cohort-level performance holds the potential of high levels of discrimination for ECABG following PCI. This approach has value in selectively referring PCI patients to hospitals with and without onsite surgery.
INTRODUCTION
Despite a decline in the rate of emergency coronary artery bypass graft (ECABG)
follow-ing percutaneous coronary intervention
(PCI) in the current-stent era (0.3%–0.6%),
the mortality and morbidity associated with
ECABG remains constant and high.1–4
Historically, PCI has been performed at sites that have access to onsite cardiac surgery. In recent years, however, the number of primary PCI cases being performed at sites without cardiothoracic surgical backup has grown globally for both patients presenting with acute myocardial infarction (MI) and those
undergoing elective procedures.5 The
American College of Cardiology (ACC)/ American Heart Association (AHA)/Society
for Cardiovascular Angiography and
Interventions (SCAI guidelines designate
primary PCI a class IIa indication (is reason-able), and elective PCI a class IIb indication
KEY MESSAGES
What is already known about this subject?
▸ Predicting the risk of ECABG following PCI has traditionally been an extremely hard problem, with the low prevalence and multi-factorial nature of events resulting in no satisfactory pre-dictors for this outcome.
What does this study add?
▸ The purpose of this study is to explore a compu-tational approach that addresses this goal by drawing upon recent advances in statistical machine learning to integrate information from a diverse set of clinical variables that are individu-ally weak predictors of ECABG following PCI.
How might this impact on clinical practice?
▸ Computational modeling directly optimized for cohort-level performance can achieve potentially high levels of discrimination for ECABG follow-ing PCI. This approach may have value in screening PCI cases and selectively referring patients to hospitals with and without onsite surgical backup.
on September 13, 2020 by guest. Protected by copyright.
(may be considered) when performed at facilities without onsite surgical backup with the caveat that appropriate planning for programme development has been accomplished and rigorous clinical and angio-graphic criteria are used for proper patient selection.6 There has been a steady increase in PCI without surgical backup and it was estimated that over 16% of the facil-ities participating in the National Cardiovascular Data Registry were performing PCI without onsite backup7by the end of 2005.
Large meta-analyses and randomised controlled trials have found no differences in adverse outcomes between carefully selected patients undergoing PCI at facilities with onsite cardiac surgery and those undergoing PCI at facilities without surgical backup.8–10 The outcome of emergent surgery is extremely uncommon, however, and these studies have been underpowered with respect to this end point to definitively establish the superiority of one strategy versus the other. What is clear is that the low prevalence of ECABG means that surgical backup may not be needed for the vast majority of patients, and that there will be further increases in the number of hos-pitals providing PCI without onsite surgery.
In this setting, risk scores or decision-support algo-rithms that can accurately differentiate between patients at high or low risk of ECABG following PCI hold signifi -cant value as screening tools to selectively refer cases to facilities with or without surgical backup. Such tools fit particularly well within a hub-and-spoke model of PCI centres by guiding decisions related to patient transfer.11 The availability of tools that can accurately quantify patient risk also provide for more accurate assessments of quality and outcomes across institutions (both with and without onsite surgical backup) by creating the
opportunity to perform risk-adjusted
observed-to-expected analyses. However, predicting the risk of
ECABG following PCI has traditionally been an
extremely hard problem, with the low prevalence and multifactorial nature of events resulting in no satisfactory predictors for this outcome.12
The purpose of this study is to explore a computational approach that addresses this goal by drawing on recent advances in statistical machine learning to integrate information from a diverse set of clinical variables that are individually weak predictors of ECABG following PCI. The specific hypothesis underlying this study is that the process of stratifying patients for ECABG can be signifi -cantly improved through algorithms that directly opti-mise cohort-level metrics relevant for clinical use. Specifically, across a fairly broad range of medical appli-cations, the metrics that determine practical utility (mea-sures such as precision, recall and area under the receiver operating characteristic curve (AUROC)) are defined in terms of how the risk scores or predictions are distributed across a cohort. There is no notion of metrics such as an AUROC, for example, at the level of a single patient and they are defined instead in terms of how the risk scores or predictions change across a set of patients.
In contrast, the outstanding majority of existing
approaches to stratify patients (including the popular methodology of logistic regression) focus in their under-lying optimisation problems on individual patients separ-ately without direct regard for how the risk scores or predictions arising from these approaches collectively translate to cohort-level performance for meaningful performance metrics. This study diverges from this trend, and investigates how the process of predicting ECABG following PCI can be improved through a com-putational model directly optimised for cohort-level per-formance using novel machine learning methodology; as an objective basis that can be used for selectively referring patients to hospitals with and without onsite surgical backup.
METHODS
Data and variables
The Blue Cross Blue Shield of Michigan Cardiovascular Consortium (BMC2) multicentre interventional cardi-ology registry data13 were used to develop and validate a computational risk stratification model to predict ECABG following PCI. The study population comprised all patients undergoing PCI at 31 participating institu-tions in the state of Michigan. Procedural data on all patients undergoing elective and non-elective PCI at the participating hospitals are collected using standardised data collection forms. Baseline data include clinical, demographic, procedural and angiographic character-istics as well as medications used before, during and after the procedure, and in-hospital outcomes. All data
elements have been prospectively defined, and the
protocol was approved by the local Institutional Review Board (IRB) at each institution. The need for informed consent has also been waived by the respective IRBs due to the lack of any unique patient identifier in the data set. The data undergo a rigorous audit process with the medical records of all patients undergoing multiple pro-cedures, coronary artery bypass grafting or dying prior to discharge being reviewed to ensure data accuracy. A further 2% of cases are also randomly selected for audit.
Model development was performed on patients under-going PCI in 2004–2007, with the model validated on patients undergoing PCI in 2008–2009. In more detail, within the model development cohort, data from 2005 to 2007 were used for training (eg, to learn model weights for a given choice of cost parameters) while data from 2004 were used for internal selection of parameters (eg, to choose the best model across cost parameters). The evaluation of the best model produced during model development was then performed on held out test data from 2008 to 2009. The decision to adopt this approach in comparison to randomly sampling all of the data from 2004 to 2009 into development and validation sets was to evaluate the model in a manner that would be most consistent with real-world use (ie, with the
on September 13, 2020 by guest. Protected by copyright.
model being developed on data from earlier years and being applied subsequently to newer patients).
The clinical variables used for model development and assessment were related to: patient characteristics (gender, body mass index, age); cardiac status ( priority, staged PCI, salvage, ad hoc PCI, stable angina, cardiac arrest, unstable angina, high-risk non-cardiac surgery, atypical angina, patient turned down for coronary artery bypass graft by surgeon); PCI in the setting of MI ( primary PCI; symptom to PCI time: 0–6, 6–12, 12–24 and >24 h of symptoms; PCI of infarct-related vessel; car-diogenic shock; recurrent ventricular tachycardia or ven-tricular fibrillation; postinfarct angina; lytic therapy); comorbidities (current smoker, hypertension, insulin-dependent diabetes, non-insulin-insulin-dependent diabetes, congestive heart failure, peripheral vascular disease, renal failure requiring dialysis, significant valve disease,
current or recent gastrointestinal bleed, chronic
obstructive pulmonary disorder, cerebrovascular disease, atrial fibrillation, history of cardiac arrest, prior MI, prior PCI); pre-procedure laboratory results (creatinine, haemoglobin); contraindications (aspirin, ACE inhibi-tors, β-blockers, cholesterol-lowering agents,
clopido-grel); pre-procedure therapy (aspirin, intravenous
heparin, low molecular weight heparin, bivalirudin, ACE inhibitors, β-blockers, calcium channel blockers, diure-tics, coumadin, clopidogrel, thienopyridine, intra-aortic balloon pump, intubation); and cardiac anatomy and function (left main artery stenosis, ejection fraction, number of diseased vessels, left ventricular end diastolic pressure, graft lesion, grafts with ≥70% stenosis, ostial lesion, moderate to heavy calcification, thrombus and chronic total occlusion). The BMC2 data set provided 68 022 cases with these variables between 2004 and 2007 for model development (52 462 for training between 2005 and 2007 and 15 560 in 2004 for internal param-eter selection) and 42 310 cases between 2008 and 2009 for model validation. All risk variables were normalised to have zero mean and unit variance prior to model construction.
Model development
The approach of support vector machine (SVM) classifi -cation was used to develop the computational model to risk stratify patients for ECABG following PCI. In con-trast to the traditional formulation of SVM classification (described in online supplementary appendix A)14 the training data were used to develop an SVM classifier optimised multivariate non-linear performance on the training cohort using an AUROC loss function and a one-slack algorithm for structural learning (described in
online supplementary appendix B).15 This approach
differs in important ways from conventional modelling (both logistic regression and traditional SVM classifi ca-tion). Notably, instead of learning a model that opti-mises a univariate error function on the training data (eg, by summing up the error separately on individual patients in the training data), the learning problem is
formulated in terms of a multivariate error function (in this case related to the AUROC) that is defined at the level of the cohort.
The entire model development approach described here was performed exclusively on data from PCI between 2004 and 2007, with validation on held out data between 2008 and 2009.
Statistical analyses
The SVM model was evaluated using different measures. The AUROC was measured for the outputs of the model to predict ECABG in the validation cohort. The rates of events in each decile of the predicted outputs were also assessed. The OR and 95% CIs based on the SE between patients in the highest decile of predicted risk and the remainder of the validation cohort were further measured. The Hosmer-Lemeshow test was also per-formed to assess model calibration.
To evaluate the improvement in risk stratification achieved through the use of SVM classification opti-mised for multivariate non-linear performance at the cohort level using an AUROC loss function (subse-quently denoted as SVMAUROC), the predicted scores were compared with the scores obtained using logistic regression models with L1 (LogL1) and L2 (LogL2) regularisation, and traditional SVM classification models optimised for univariate performance separately
for individual patients with L1 (SVML1) and L2
(SVML2) regularisation. The increased discriminative value of the SVMAUROCmodels was assessed in terms of
changes in the AUROC and the net reclassification
improvement (NRI). The significance of changes in
the AUROC was assessed using the method proposed by Hanley and McNeil16 to compare receiver operating characteristic curves derived on the same patient cohort. The NRI, which evaluated the degree of patients appropriately assigned to a higher or lower risk, was measured using the category-less method described by Harrell.17
All statistical analyses were performed in MATLAB R2009a (Mathworks, Natick, Massachusetts, USA) and the R software environment for statistical computing (http://www.r-project.org).
RESULTS
Population and procedural characteristics
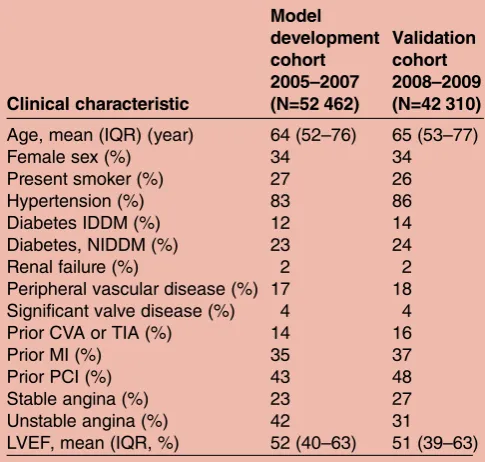
Tables 1 and 2 present the population and procedural characteristics of the model development and validation cohorts. Of the 68 022 patients in the model develop-ment cohort, there were 181 cases of ECABG (0.27%). In the 42 310 patients in the validation cohort, there were 87 cases of ECABG (0.21%).
Risk stratification using SVMAUROC
The SVMAUROC model for predicting ECABG achieved
an AUROC of 0.81 (95% CI 0.76 to 0.86). Table 3 pre-sents the rate of events in patients within each decile of
on September 13, 2020 by guest. Protected by copyright.
the predicted model outputs. Patients in the highest decile of risk (45 cases of ECABG in 4230 patients, 1.06%) were at a significantly elevated risk (OR 9.74, 95% CI 6.39 to 14.84, p<0.001). The relationship was more pronounced for patients in the top 2.5% of the predicted risk scores (22 cases of ECABG in 1057 patients, 2.08%) relative to other patients in the popula-tion (OR 13.47, 95% CI 8.27 to 21.93, p<0.001).
Discrimination/reclassification improvement relative to
LogL1, LogL2, SVML1and SVML2
The AUROCs of the SVMAUROC models were signifi
-cantly higher than the corresponding AUROCs for LogL1, LogL2, SVML1 and SVML2 (table 4), suggesting a statistically significant improvement in discrimination with the SVMAUROC approach that directly optimised performance for this metric. When assessed in terms of NRI, a similar effect was observed with the SVMAUROC models providing a significant improvement in reclassifi -cation relative to all other models for both study end points (table 4).
Model calibration and comparison to LogL1, LogL2, SVML1
and SVML2
Table 5compares the Hosmer-Lemeshow test statistic for the different models considered. The SVMAUROC model had a lower X2 statistic than for LogL1, LogL2, SVML1 and SVML2. While the Hosmer-Lemeshow statistic was significant at the 5% level for SVMAUROC( p=0.021), this result may not be meaningful; as sample sizes become large (in the range of this study), the magnitude of deviations from perfect model fit that yield statistically significant lack of fit becomes very small as noted in several earlier studies.18 19
Stepwise elimination and variable weighting
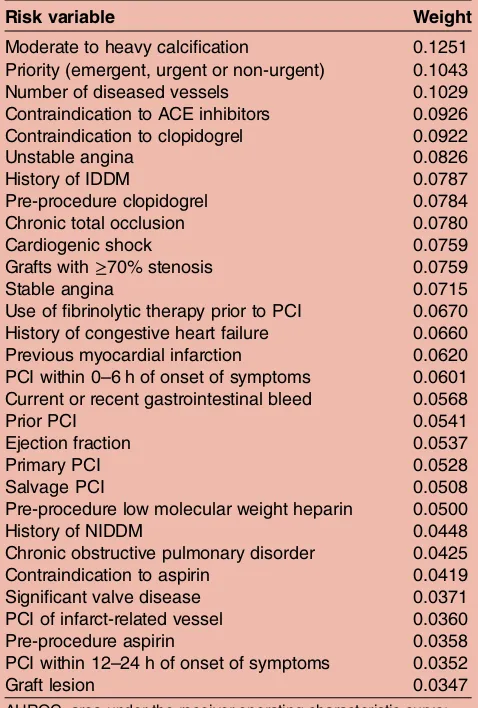
Table 6 presents the risk variables with the highest weight in the SVMAUROCmodels for ECABG. The top 30 variables and the absolute values of their coefficients in the models are shown. The discrimination of the SVMAUROC models diminished as the number of vari-ables used to develop the models was reduced. Figure 1 illustrates this observed effect. In general, model per-formance was stable when 10 or more variables were used for risk stratification.
DISCUSSION
With a growing number of PCI procedures being per-formed at hospitals without onsite surgical backup, the ability to identify patients at risk of ECABG can help streamline case distribution across providers and allow for patients to be matched to resources that are ideally suited for their individual acuity. Unfortunately, explor-ing this opportunity or realisexplor-ing its full potential is con-strained by the absence of clinical tools that can reliably stratify patients for ECABG after PCI. Prediction of pro-cedural risk is an intricate exercise and is especially Table 1 Baseline characteristics of the patients in both the
model development (2004–2007) and validation (2008– 2009) cohort
Clinical characteristic
Model development cohort 2005–2007 (N=52 462)
Validation cohort 2008–2009 (N=42 310)
Age, mean (IQR) (year) 64 (52–76) 65 (53–77)
Female sex (%) 34 34
Present smoker (%) 27 26 Hypertension (%) 83 86 Diabetes IDDM (%) 12 14 Diabetes, NIDDM (%) 23 24
Renal failure (%) 2 2
Peripheral vascular disease (%) 17 18 Significant valve disease (%) 4 4 Prior CVA or TIA (%) 14 16
Prior MI (%) 35 37
Prior PCI (%) 43 48
Stable angina (%) 23 27 Unstable angina (%) 42 31 LVEF, mean (IQR, %) 52 (40–63) 51 (39–63) CVA, cerebrovascular accident; IDDM, insulin-dependent diabetes mellitus; LVEF, left ventricular ejection fraction; MI, myocardial infarction; NIDDM, non-insulin-dependent diabetes mellitus; PCI, percutaneous coronary intervention; TIA, transient ischaemic attack.
Table 2 Procedural characteristics of the patients in both the model development (2004–2007) and validation (2008–2009) cohort
Procedural characteristic
Model development cohort 2005–2007 (N=52 462)
Validation cohort 2008–2009 (N=42 310)
Multivessel intervention (%) 29 27
Balloon (%) 73 78
Rotational coronary atherectomy (%)
1 1
Stent (bare metal) (%) 22 28 Angiojet rheolytic
thrombectomy catheter (%)
2 1
Unable to cross with device (%)
2 2
Intracoronary laser (%) <1 <1 Cutting balloon (%) 5 6 Intravascular ultrasound (%) 5 8 Distal protection device (%) 2 3 Not crossed with wire (%) 2 2 Drug eluting stent—sirolimus
eluting (%)
38 13
Drug eluting stent—paclitaxel eluting (%)
20 10
Drug eluting stent—zatrolimus eluting (%)
<1 11
Drug eluting stent— everolimus eluting (%)
<1 32
Thrombectomy catheter (%) 1 5
on September 13, 2020 by guest. Protected by copyright.
difficult for events that are multifactorial and relatively uncommon. Conventional modelling approaches to predict ECABG are severely challenged by these issues. As confirmed by the data from this study, approaches such as logistic regression and even methodologies in the conventional machine learning literature (like stand-ard SVM classification) fail to achieve levels of discrimin-ation that correspond to genuine clinical utility (an AUROC of 0.8 or higher20).
In this setting, the mainfinding of our study is that it is possible to predict the need for ECABG following PCI with a potentially useful degree of discrimination through the aid of advanced computational methods. These methods performed significantly better in our experiments than both logistic regression and standard SVM techniques. We demonstrated, in particular, the ability of a computational model directly optimised for multivariate non-linear performance at the cohort level using an AUROC loss function to identify subpopula-tions undergoing PCI at significantly increased or decreased risk of ECABG. This approach achieves higher levels of discrimination, net reclassification and calibration than existing methodologies. One of the primary reasons for this improvement is that unlike the statistical problem formulations of more traditional methods, which focus only on reducing the error assessed at the level of individual training examples, the computational techniques investigated in our study focus on simultaneously considering the classification of multiple training examples. This allows for a reduction of training error on individual examples to be enhanced with the joint maximisation of multivariate cohort-level performance metrics. As a result, the resulting classifier or predictive model is directly constructed to optimise cohort-level metrics that are relevant for practical use
and significantly outperforms more conventional
techniques.
Multiple models have previously been described to predict in-hospital mortality after PCI and serve to estab-lish benchmarks for quality improvement and public reporting. Prediction of the need for ECABG has impli-cations beyond risk adjustment and informed consent as a growing number of institutions start PCI services without surgical backup. Our methods can help identify patients who should not be treated at sites that do not have cardiac surgery on site and instead should be selectively referred to PCI centres with onsite surgical backup. Furthermore, even at centres that have cardiac surgery on site, it is rare to have surgical team and suite available around the clock and accurate models can help optimise resource utilisation by facilitating optimal planning for procedures that potentially have a higher need for surgical backup. The mortality associated with ECABG after PCI has remained unchanged over the last decade and it is possible that computational models such as the studied here can reduce burden by facilitat-ing better case selection, guidfacilitat-ing performance of the extremely high-risk procedures in hybrid catheterisation laboratories with surgery on standby, or the use of alter-native treatment such as planned CABG or medical therapy. Finally, regulatory agencies that oversee hospital accreditation can use these models to define reprodu-cible risk thresholds that should trigger transfer of patients from centres without onsite surgery to centres with surgical backup. This is likely to become an import-ant issue as PCI is expanded to a larger number of sites in response to the change in national guidelines and the emerging data.6 8 10
Ourfindings are important for many reasons. First, by harnessing sophisticated computational methods, we Table 3 Rate of ECABG following PCI in each decile of the risk scores predicted by the computational risk stratification model
Decile 100–90 90–80 80–70 70–60 60–50 50–40 40–30 30–20 20–10 10–0
Events 45 12 10 4 4 4 3 2 1 2
Patients 4230 4231 4232 4231 4231 4231 4231 4232 4231 4230 O(rate) 1.06% 0.28% 0.24% 0.09% 0.09% 0.09% 0.07% 0.05% 0.02% 0.05% E(rate) 1.48% 0.40% 0.28% 0.22% 0.18% 0.16% 0.13% 0.11% 0.09% 0.06% O(rate) corresponds to the observed rate of events (events/patients in the decile) and E(rate) corresponds to the expected rate of events (sum of the risk predicted across all patients in the decile by the SVMAUROCmodel).
AUROC, area under the receiver operating characteristic curve; ECABG, emergency coronary artery bypass graft; PCI, percutaneous coronary intervention; SVM, support vector machine.
Table 4 Comparison of SVMAUROCrelative to LogL1, LogL2, SVML1and SVML2in terms of discrimination and reclassification
Model SVMAUROC LogL1 LogL2 SVML1 SVML2
AUROC (p value) 0.81 (Referent) 0.77 (0.019) 0.77 (0.038) 0.77 (0.013) 0.64 (<0.001) NRI of SVMAUROC(p value) Referent 0.452 (<0.001) 0.299 (0.005) 0.167 (0.119) 0.950 (<0.001)
p Values for both AUROC and NRI are shown relative to SVMAUROC.
AUROC, area under the receiver operating characteristic curve; NRI, net reclassification improvement; SVM, support vector machine.
on September 13, 2020 by guest. Protected by copyright.
were able to develop a robust predictive approach for a PCI complication that is relatively uncommon, has dra-matic implications for patients, is expensive and has been difficult to reliably predict using traditional meth-odology. The generality of these methods and their dem-onstration on an end point that is representative of many PCI complications suggests that the techniques investigated here may have broader merit for stratifying patients undergoing PCI. Second, these methods are fully automated both in terms of training and predic-tion, and build on data elements that are routinely
collected by national PCI registries. The models
arising from this work can therefore be easily
embedded into the electronic medical records used by the catheterisation laboratories and it should be possible to have the risk calculation automatically generated as soon as diagnostic angiography is completed. This should permit seamless calculation of procedural risk using data collection tools that are routinely used in
catheterisation laboratories around the country.
Third, the risk for these outcomes is dependent on a multitude of factors that are by themselves only weak predictors of outcome and cannot be incorporated into a simplified risk scores. Yet in aggregate these predictors
are powerful determinants of clinical outcomes.
We believe that our study provides an important example for how to leverage such data for a variety of clinical use cases.
We conclude with a discussion of some limitations. Given the extremely low prevalence of ECABG even with a highly discriminative model, there are a large number of false positives. For example, among patients in the top 2.5% of the predicted risk scores, the rate of ECABG is only around 2%. Addressing this false-positive rate for events that occur with such low prevalence is difficult (unless models with an AUROC >0.99 can be devel-oped). From the perspective of the use case described Table 6 Risk variables with highest absolute coefficients
in the SVMAUROCmodel to predict ECABG following PCI
(top 30 variables shown)
Risk variable Weight
Moderate to heavy calcification 0.1251 Priority (emergent, urgent or non-urgent) 0.1043 Number of diseased vessels 0.1029 Contraindication to ACE inhibitors 0.0926 Contraindication to clopidogrel 0.0922
Unstable angina 0.0826
History of IDDM 0.0787
Pre-procedure clopidogrel 0.0784 Chronic total occlusion 0.0780
Cardiogenic shock 0.0759
Grafts with≥70% stenosis 0.0759
Stable angina 0.0715
Use of fibrinolytic therapy prior to PCI 0.0670 History of congestive heart failure 0.0660 Previous myocardial infarction 0.0620 PCI within 0–6 h of onset of symptoms 0.0601 Current or recent gastrointestinal bleed 0.0568
Prior PCI 0.0541
Ejection fraction 0.0537
Primary PCI 0.0528
Salvage PCI 0.0508
Pre-procedure low molecular weight heparin 0.0500
History of NIDDM 0.0448
Chronic obstructive pulmonary disorder 0.0425 Contraindication to aspirin 0.0419 Significant valve disease 0.0371 PCI of infarct-related vessel 0.0360 Pre-procedure aspirin 0.0358 PCI within 12–24 h of onset of symptoms 0.0352
Graft lesion 0.0347
AUROC, area under the receiver operating characteristic curve; ECABG, emergency coronary artery bypass graft; IDDM, insulin-dependent diabetes mellitus; NIDDM,
non-insulin-dependent diabetes mellitus; PCI, percutaneous coronary intervention; SVM, support vector machine.
Figure 1 Relation between the number of variables with highest weights included in the model (x-axis) and the AUROC (y-axis) for predicting ECABG following PCI (maximum AUROC obtained for model with 11 variables). Table 6provides more information on the top variables with the highest absolute coefficients in the SVMAUROCmodel.
AUROC, area under the receiver operating characteristic curve; ECABG, emergency coronary artery bypass graft; PCI, percutaneous coronary intervention; SVM, support vector machine.
Table 5 Hosmer-Lemeshow test statistics for SVMAUROCrelative to LogL1, LogL2, SVML1and SVML2(χ2statistic
corresponds to 8° of freedom for each test)
Model SVMAUROC LogL1 LogL2 SVML1 SVML2
χ2
(p value) 18.05 (0.021) 23.73 (0.003) 30.79 (<0.001) 26.58 (<0.001) 43.74 (<0.001) AUROC, area under the receiver operating characteristic curve; SVM, support vector machine.
on September 13, 2020 by guest. Protected by copyright.
here, however, we do not believe that the false-positive rate is prohibitive. For example, the high-risk subgroup above is at an almost 13-fold to 14-fold increased risk and represents over a quarter of all ECABG cases. Moreover, at a rate of 1 in every 50 patients requiring ECABG, this group may be considered appropriate for selectively being referred to hospitals with onsite cardiac surgery. We note, in particular, that the objective of this study is to demonstrate the feasibility of a computational approach such as the one described here as a screening tool. In this setting, despite the potential for improving precision and recall across different decision thresholds, our results offer positive validation through their ability to partition the population of patients undergoing PCI into groups at significantly higher or lower risk. Similarly, at the other end of the spectrum, we also observe that while the computational model constructed in this study was able to robustly stratify patients with a significantly elevated risk of ECABG following PCI, no group could be found that had a zero risk of complica-tions. For example, even in the patients placed within the lowest deciles of risk, there were at least one or two cases of ECABG across several thousand patients. This suggests that even though PCI risk can be minimised by careful case selection, it cannot be totally negated. This factor needs to be recognised by both patients and provi-ders and should be included in the consent process. We also note that despite accounting for information in a broad range of variables, the computational model inves-tigated here does not account for operator experience or judgement, factors that may significantly influence procedural complications. Availability of these data may improve performance further. Related to this, we note that while models such as the one presented here have value in selectively screening patients for PCI to reduce outcomes such as ECABG, many factors other than patient and procedural characteristics influence the occurrence of a rare outcome like ECABG and processes such as multidisciplinary meetings, morbidity and mor-tality reviews, and medical error reporting are still essen-tial to reducing event rates. Finally, the incidence of ECABG is susceptible to technological advances and may change with the emergence of newer technology. With increasing use of percutaneous support devices, the incidence of these complications may drop further in the future necessitating model recalibration. However, no survival benefit has been demonstrated with thefirst generation of these devices, and both the development and validation cohorts reflect patients treated with con-temporary PCI. The findings of our study are therefore likely extant for the near future; and additionally given the fully automated process of developing the computa-tional model any process of recalibrating it can be implemented without being burdensome. We anticipate, in particular, a use case for our model where it is retrained on an ongoing basis (eg, annually from regis-try data) to ensure sustained performance across pro-longed periods of time.
CONCLUSIONS
Computational modelling directly optimised for
cohort-level performance can achieve potentially high levels of discrimination for ECABG following PCI. This approach may have value in screening PCI cases and selectively referring patients to hospitals with and without onsite surgical backup.
Author affiliations
1Department of Electrical Engineering and Computer Science, University of Michigan, Ann Arbor, Michigan, USA
2Miller School of Medicine, University of Miami, Miami, Florida, USA 3Department of Family Medicine, University of Michigan, Ann Arbor, Michigan, USA
4Division of Cardiovascular Medicine, University of Michigan, Ann Arbor, Michigan, USA
Funding This research was supported in part by the National Science Foundation award IIS1064948 and the American Heart Association award 11SDG7700075 to ZS. Executive and clinical support for BMC2 is provided by Blue Cross and Blue Shield of Michigan (BCBSM) and Blue Care Network (BCN) under the aegis of BCBSM’s Value Partnerships programme (http:// www.valuepartnerships.com).
Competing interests HSG receives research funding from Agency for Healthcare Research and Quality (AHRQ) and the National Institutes of Health. DS is employed by Blue Cross Blue Shield of Michigan.
Ethics approval IRB.
Provenance and peer review Not commissioned; externally peer reviewed. Data sharing statement No additional data are available.
Open Access This is an Open Access article distributed in accordance with the Creative Commons Attribution Non Commercial (CC BY-NC 4.0) license, which permits others to distribute, remix, adapt, build upon this work non-commercially, and license their derivative works on different terms, provided the original work is properly cited and the use is non-commercial. See: http:// creativecommons.org/licenses/by-nc/4.0/
REFERENCES
1. Bittl JA. Reducing the risk of emergency bypass surgery for failed percutaneous coronary interventions.J Am Coll Cardiol
2005;46:2010–12.
2. Mattichak SJ, Dixon SR, Shannon F,et al. Failed percutaneous coronary intervention: a decade of experience in 21,000 patients. Catheter Cardiovasc Interv2008;71:131–7.
3. Seshadri N, Whitlow PL, Acharya N,et al. Emergency coronary artery bypass surgery in the contemporary percutaneous coronary intervention era.Circulation2002;106:2346–50.
4. Yang EH, Gumina RJ, Lennon RJ,et al. Emergency coronary artery bypass surgery for percutaneous coronary interventions: changes in the incidence, clinical characteristics, and indications from 1979 to 2003.J Am Coll Cardiol2005;46:2004–9.
5. Roy P, de Labriolle A, Hanna N,et al. Requirement for emergent coronary artery bypass surgery following percutaneous coronary intervention in the stent era.Am J Cardiol 2009;103:950–3.
6. Levine GN, Bates ER, Blankenship JC,et al. 2011 ACCF/AHA/SCAI guideline for percutaneous coronary intervention. A report of the American College of Cardiology Foundation/American Heart Association Task Force on Practice Guidelines and the Society for Cardiovascular Angiography and Interventions.J Am Coll Cardiol 2011;58:e44–122.
7. Dehmer GJ, Kutcher MA, Dey SK,et al. Frequency of percutaneous coronary interventions at facilities without on-site cardiac surgical backup—a report from the American College of Cardiology-National Cardiovascular Data Registry (ACC-NCDR).Am J Cardiol 2007;99:329–32.
8. Singh M, Holmes DR Jr, Dehmer GJ,et al. Percutaneous coronary intervention at centers with and without on-site surgery:
a meta-analysis.JAMA2011;306:2487–94.
on September 13, 2020 by guest. Protected by copyright.
9. Aversano T, Lemmon CC, Liu L. Outcomes of PCI at hospitals with or without on-site cardiac surgery.N Engl J Med2012;366: 1792–802.
10. Jacobs AK, Normand SL, Massaro JM,et al. Nonemergency PCI at hospitals with or without on-site cardiac surgery.N Engl J Med 2013;368:1498–508.
11. Kutcher MA, Klein LW, Ou FS,et al. Percutaneous coronary interventions in facilities without cardiac surgery on site: a report from the National Cardiovascular Data Registry (NCDR).J Am Coll Cardiol2009;54:16–24.
12. Shubrooks SJ Jr, Nesto RW, Leeman D,et al. Urgent coronary bypass surgery for failed percutaneous coronary intervention in the stent era: Is backup still necessary?Am Heart J2001;142:190–6. 13. Moscucci M, Share D, Kline-Rogers E,et al. The Blue Cross Blue
Shield of Michigan Cardiovascular Consortium (BMC2) collaborative quality improvement initiative in percutaneous coronary
interventions.J Interv Cardiol2002;15:381–6.
14. Vapnik VN. An overview of statistical learning theory.IEEE Trans Neural Netw1999;10:988–99.
15. Joachims T. A support vector method for multivariate performance measures.Proceedings of the International Conference on Machine
Learning. 2005:377–84.
16. Hanley JA, McNeil BJ. A method of comparing the areas under receiver operating characteristic curves derived from the same cases.Radiology1983;148:839–43.
17. Pencina MJ, D’Agostino RB Sr, D’Agostino RB,et al. Evaluating the added predictive ability of a new marker: from area under the ROC curve to reclassification and beyond.Stat Med2008;27:157–72; discussion 207–112.
18. Bertolini G, D’Amico R, Nardi D,et al. One model, several results: the paradox of the Hosmer-Lemeshow goodness-of-fit test for the logistic regression model.J Epidemiol Biostat 2000;5:251–3.
19. Pigeon J, Heyse J. A cautionary note about assessing the fit of logistic regression models.J Appl Stat1999;26:847–53.
20. Ohman EM, Granger CB, Harrington RA,et al. Risk stratification and therapeutic decision making in acute coronary syndromes.JAMA 2000;284:876–8.
on September 13, 2020 by guest. Protected by copyright.