Blended Learning the Contemporary Learning Environment Impinge Students’
Learning Preference
Ambikai S Thuraisingam
Muhd Iqbal Makmur
Taylor’s University
Malaysia
Abstract
The purpose of this study is aimed to determine the application of blended learning as a platform and a tool for learning. It also analyses how blended learning and the usage of technology enhanced classroom influences and impinges students’ learning preference. The study will also investigate the possible factors affecting the technology enhanced learning experience amongst undergraduate students. Primary research was conducted to collect data among the undergraduate students to determine their preference towards blended learning. However, the study was limited to Taylors’ University students. The data was collected based on the students’ preference on the mode of learning, the depth of understanding in learning and the possible factors that may influence their preference in blended learning in the technology enhanced context. In this research, the outcome was that male students’ learning experience is enhanced more than the female students’ learning experience when using the technology enhanced classroom. The findings prove statistically that the gender of the students has a significant effect on the perceived learning enhancement obtained through the use of the technology enhanced learning for the Taylor’s Business School students.
Keywords:
technology enhanced classroom, e-learning, level of acceptance, design, environment, architecture1. Introduction
In the current contemporary world, the development of university education process is marked by the overwhelming influence of information technology. As a consequence, the learning process is adopted in an exquisite and dandified manner. Modern society globalization has led, the labour market, the emergence of new professions, resulting in reconfigurations of specializations within universities and transformation of traditional classroom functions into integrated learning that encompasses the research needs. Classrooms today have received a significant overhaul with the inclusion of ICT and new learning pedagogies. Advancements in computing and multimedia technologies in education have resulted in an emerging breed of technologically proficient learners (Mai, 2013). Today’s students are digital natives and condoned by the transformative environment created by the advanced technology which is an efficacious mode for civilization and globalization.
The e-learning environment is an interesting research area in which the learning experience of learners is generally believed to be improved when his or her personal learning preferences are taken into account. The use of electronic learning (e-learning) as a medium of instruction in distance learning is also becoming increasingly important in Malaysia (Jefferies & Hussain, 1998; Poon et al., 2004) and globally (Volery & Lord, 2000). E-learning as a form of distance E-learning is being promoted as the educational medium of the future (O’Malley, 1999).
As such, Taylors’ University is the first university in Malaysia to embark on technology enhanced learning for its pre-university and undergraduate students. Therefore, the objective of this study is to determine the usage of technology as a platform and a tool for learning. It also analyses how technology influences and impinges the students’ learning preference in addition to analyzing the factors that underpin such learning preference. The aim of this paper, therefore, is to enhance the students’ learning experience by giving them as much as possible an inaugural conducive learning environment to further elevate their learning preferences. The real issue when it comes to the design of a personalized learning environment is therefore not really about getting the students’ preferred learning style on a perfectly accurate scale. The important thing is to get an initial profile of the learner, of course, but as accurately as possible (Santally, 2013) which is a vital contributing factor to the study.
2.0 Literature Review
A review of literature revealed a number of studies done on the effects of designing materials or learning activities that take into account the learning styles of learners. When the goal is enhancing motivation of the future generation, various approaches in delivering highly engaging learning processes and locating sources of information that can be used as evidence by students to give meaningful analysis has been long stressed in educational sectors. Internet has become a crucial common platform to access primary sources, digital libraries, newspapers, and archives from around the world and nothing less than a “truly revolutionary development” (Braun & Risinger, 1999), as it contains a vast array of freely available sources previously difficult or impossible to obtain. Integration of technology and future class environment may induce a positive perception in the learning process of students (Morgan, 2011). According to Mayer and Clark (2011), each new wave of instructional delivery technology has spawned optimistic predictions of massive improvements in learning.
2.1Environment
Environment has contributed towards early perception to attract students, where most universities are utilizing the physical environment towards technology driven approaches (Morgan, 2011) and architectural icons to be the pull factors that attract students (Jamieson, 2009). This is due to the fact that transformation of learning environments in higher education settings for an increasingly electronic world is critical to ensure that the benefits are fully realized (Williams, 2002). Hicks, Reid and George (2001) assert that there are demands for universities to “provide for a larger and more diverse cross-section of the population, to cater for emerging patterns on educational involvement which facilitate lifelong learning and to include technology-based practices in the curriculum”. Lecture theatres and other instructional spaces of the traditional university being the manifestation of a particular power relationship between teacher and students, which suggests to multiple the characters and experiences to shape and identify the relationship within (Ceppi and Zini, 1998). Jamieson (2003) finds that recent trends are encouraging universities to create new and diversified teaching and learning facilities in campuses, which has resulted in celebrated architecture that has proven to be educationally problematic.
A learner-centered environment should help students understand the meaning of what they are learning and why they are learning it. Here, students must assume responsibility for organizing what they learned (Dodge, 1996). An instructor who views teaching and learning from a constructivist philosophy creates a context for learning in a learning environment where learners can become engaged in authentic projects, problem-solving and other learning activities (Berge, 2002). In this context, the role of the instructor is more of a explorer and co-discoverer who guides learning in an interactive and collaborative manner. Runnels et al. (2006) concur that students’ learning in the online environment is affected by the quality of online instruction.
Equally important to note that, modern pedagogical excogitation believes that today’s student enjoys and sees the value in learning and working with technology (Phillips and Johnson 2011).
This enhances the brainwork of the students and collaborative learning. Teeter et al. (2007) contends that CRS (clickers) increases student satisfaction and perceptions of effectiveness. Laird and Kuh (2005) studied the use of technology in a university setting, and found a good fit between information technology and its use in collaborative learning. He reported an increased engagement in the use of technology that could lead to more time spent on a particular task. The inclusion of technologies in the classroom has also changed the education landscape of such premise and has introduced important changes in the educational system and impact the way learners have practiced interactive learning with each other (Muller, Lee & Sharma, 2008). Berge (1999) states that the process of engagement and reflection during the study, help in the self-construction of competent learning goals by a student. However, learners still play a passive role in their learning by being inactive in their learning processes. Therefore, educators in Malaysia are posed with challenges to design a learning environment and curriculum that can encourage interaction, communication and collaboration among students and teachers, and increase their motivation to learn and be independent in their learning process (Laurillard, 2008; McLoughlin & Lee, 2010; Bower, Kennedy, Dalgarno, & Lee, 2011).
2.2 Online Learning
According to Rosenberg (2001), the online learning or e-learning experience offers various possibilities in terms of relating information and instruction as vehicles to develop and preserve intellectual capital. E-learning is defined as instruction delivered on a digital device such as a computer or mobile device that is intended to support learning be it self-study (asynchronous) or instructor-led e-learning (synchronous) (Clark & Mayer, 2011). Ellis (2004) believes that teaching through digital referencing may help the student to enlighten the info seeking, besides, promoting knowledge extraction from multiple resources. Web 2.0 in education is one of the primary catalysts that motivate the seeking engine in teaching and learning process (Hicks and Graber, 2010). In contrast, Milson (2002) reported that many students simply took a path of least resistance when it came to gathering and working with information. Students sought to use sites that would yield the answer quickly, as opposed to examining a range of sites to pull together a more nuanced perspective. Similarly to Strickland and Nazzal (2005) and Lipscomb (2002), students experiencing technology frustration and might encounter initial disappointing in terms of technology’s inherent ability to facilitate inquiry. In certain cases, the students did worse at the end-of-unit experimental result as traditional approaches. Strickland and Nazzal (2005), Lipscomb (2002) and Milson (2002) suggest that teachers must provide scaffolding to support and monitor students in using technology as a tool to facilitate inquiry.
2.3Blended Learning
The technology enhanced classroom aims to promote this to meet specific learning requirements. The integration of e-learning environment and traditional learning environment may combine ideally the useful aspects of both methods. E-learning environments ensure the flexibility and efficacy which cannot be found in a classroom environment whereas face-to-face learning environment provides the social interaction which is required for learning. While definitions vary from one institution to another, blended learning is defined in this article essentially as a combination of face-to-face and web based environment.
However, it is important to construct equilibrium between e-learning and face to face environments, in view of the advantages of both methods, during the process of designing a blended learning environment. Today’s students have fundamentally different ways of approaching knowledge acquisition, problem solving, and operating in the workforce (Orhan, 2008). Therefore, blended and online learning offers a mechanism for meeting their needs within the value system that they embrace, henceforth; this study will address the gap on their learning preference.
Data and Research Methodology
The blended learning carries the similar concept; however, the execution of it may different in which to cater different level of learning process. This study used the cluster sampling which the number of samples is obtained from Law module between two different programme namely pre-university programme and degree programme in their second semester. The selection of study due to uncommon research done much on law related subject which has engaged with blended learning (especially the utilisation of technology in teaching and learning pedagogy).
Hence, enhhh Hthe purpose of this study is aimed to determine the usage of technology as a platform and a tool for learning and also to analyses how the technology influence and impinge the students’ learning preference. In addition, we are interested test the significance of relationships between these factors and understand if these relationships exhibit any change in their significance during the course of an academic term.
Model Framework
Diagram 1: Three Path Model Blended Learning Environments (Graham, 2005)
Three Path Model Blended Learning Environments (Graham, 2005) were chosen as the present study has the similar concern in which connect the three components of blended learning. Graham (2005) have highlighted few the purpose of blended learning, there are;
• To increase learning effectiveness • To increase convenience and access • To increase cost effectiveness
While blended learning is appealing to many because it enables one to take advantage of the “best of both worlds” (Morgan, 2002; Young, 2002), blended learning environments can also mix the least effective elements of both F2F and technology-mediated worlds if not designed well. The blended learning may carry the similar concept; however, the execution of it may different in which to cater different level of learning process.
3.2 The Questionnaire and data collection
To perform this study, a construct with four items was designed. The construct is that the “technology enhanced classroom enhances students’ learning experience.”
It has the following four items:
It integrates learning between instructor and learner. Sitting in a circle enables discussion and interaction. It has improved my learning process.
It has boosted my self-confidence.
This research utilized SPSS to analyze its inputs. The ordinal data of the Likert 1 -5 scale was converted into scale data. This was done through taking the average score of the four items for each student. This average score of the four items was considered to be the scale data of the construct for each student. This study used the cluster sampling method in its data collection. The cluster sampled was from the students taking the law module in the foundation programme and in the degree programme second semester. The law module cluster of Taylor’s Business School was considered to be representing the entire student population of Taylor’s Business School. 141students responded to the survey and this represented 31.33 % of the total number of students surveyed. Hence the non-response bias was considered not significant as the response rate was greater than 30%. It was assumed that the sample data fully represented the cluster. For hypothesis testing, the respondents were grouped according to their gender, their programme (foundation or degree), the level of usage of smart devices (based on the number of smart devices they own and use) and the number of e-learning platforms they have used in the technology enhanced learning.
3.3 Hypothesis
The following are the alternative hypotheses that will be derived for testing:
H1: There is a difference in the X space learning experience for students of different genders.
H2: There is a difference in the X space learning experience for students in foundation and degree programmes.
H3: There is a difference in the X space learning experience for students who have used different number of e-learning applications in the Technology enhanced e-learning.
H4: There is a difference in the X space learning experience for students who own and use different number of smart devices.
4. Results and Analysis
4.1Normality test
Ho: All sample data comes from a normal distribution
Table 1.0: Normality test
Skewness Kurtosis K-S statistic
Gender Male -0.462 1.532 0.093
Female -0.440 0.566 0.103
Programme level Foundation 0.141 -0.424 0.085
Degree -1.021 2.068 0.141*
Number of e-learning applications used in the Technology enhanced learning
1 application -0.483 0.839 0.091 2 applications 0.206 0.418 0.119 > 2 applications -0.800 2.277 0.120
Number of smart devices owned and used
Prior to further analysis, we have performed normality test to ensure the collected data are normally distributed. The K-S statistics indicates that the p-value for most of collected data were unable to reject the null hypothesis. This may indicates that the data are normally distributed. Meanwhile, for number of smart devices owned and used indicates that the data for the students who uses 2 devices in not normally distributed. Similarly, the data for degree students indicates rejected the null hypothesis for normally distributed. Therefore, we use parametric test to test the hypothesis 1 and 3, and non-parametric test to analyse the hypothesis 2 and 4.
4.2Parametric test
An independent t-test was then performed to determine if there was any difference in the technology enhanced learning experience for different gender of students. This hypothesis was given in the previous section.
Table 2.0: Learning experience between male and female students
t - statistics F - statistics P - value
The Levene’s test 0.171 0.680*
The independent t-test 2.083 0.039
The astricks * indicates 5% significant level
From Levene’s test of equality of variances, F (0.171), the p-value (0.680) > 0.05, hence we do not reject the null hypothesis and conclude that the variances are equal. Meanwhile, the independent t-testwith t (2.083), the p-value = 0.039 < 0.05 (for equal variances assumed). Hence we reject the null hypothesis and conclude that the mean value of the learning experiences of male and female students using the technology enhanced learning is significantly different.
From an examination of the means, we find that the mean male student score is higher at 4.47 compared to the mean female student score at 4.13. Hence we conclude that male students’ learning experience is enhanced more than the female students’ learning experience when using the technology enhanced learning. This may suggest to support the finding by Marton & Booth (1997) and Posser & Trigwell (1999) which the learning are being constituted between an individual and a phenomenon driven, as the students may have different experiences in the blended learning.
Table 3.0: The mean and standard deviations between male and female students
Gender Mean Standard deviation
Male 4.47 0.94
Female 4.13 0.95
4.3Non- Parametric test
In response to non-normally distributed in the number of devices, we proceed with non-parametric test for the difference in the X space learning experience for students between foundation and degree programmes . In this case, the Mann-Whitney U test, would be appropriate for not normally distributed sample data. However a check on the sample sizes revealed the following:
Table 5.0: Central Limit Theorem of respondents
No. of students from different programmes
Foundation Degree
Sample size (no. of respondents) 80 61
Hence we can invoke the Central Limit Theorem, whereby for sample sizes greater than 30, the sampling distribution of means is approximately normal. In this case we can use the independent t-test for normally distributed samples, invoking the Central Limit Theorem. This t-test was carried out and in addition we also performed the Mann-Whitney U test for the purpose of comparison.
Table 4.0: Learning experience between foundation and degree students
t - statistics F - statistics P - value
The Levene’s test 0.034 0.854*
The independent t-test 0.523 0.602
The Levene’s test of equality of variances indicates that, F (0.034), the p-value (0.854) > 0.05, hence we do not reject the null hypothesis and conclude that the variances are equal. Meanwhile, the independent t-test with t (0.523), the p-value = 0.602 < 0.05 (for equal variances assumed) which suggests that the mean value of the learning experiences of foundation and degree students using the Technology enhanced learning are not significantly different.
Table 6.0: The mean and standard deviations between foundation and degree
Programme Mean Standard deviation
Foundation 4.33 0.93
Degree 4.25 1.00
A Mann-Whitney U test was also performed as one of the samples is not from a normal distribution. However this was not necessary due to the sample size being more than 30 and complies with the Central Limit Theorem. However this test was conducted solely for the basis of comparison with the t-test only. Based on the test result with a z = -0.109, the exact p-value (0.915) > 0.05 hence the null hypothesis was not rejected and we conclude that that the mean value of the learning experiences of foundation and degree students using the technology enhanced learning are not significantly different. This was the same conclusion drawn from the independent t-test. Although a study by Robinson (2005) shows the cost of technology usage are somewhat lower than face to face, however, the returns of investment in relation to learning process may not able to measure in detail. Many intangible factors that would be evaluated to measure the success rates, reduced number of drop outs, and improved faculty and student skills (Dziuban et al., 2006).
Test for ANOVA
The students were categorized into 3 groups. First group uses one application, second group uses 2 applications, while the third group uses more than 2 applications. E-learning applications include Padlet, Socrative, Today’s Meet, TIMES, or anything similar.
Table 7.0: The mean and standard deviations between applications
No. of applications Mean Standard deviation
1 4.20 1.02
2 4.18 0.90
> 2 4.49 0.91
The result of ANOVA indicates that F (1.531), and the p-value (0.220) > 0.05, hence we do not reject the null hypothesis. The mean values of the learning experiences of students using one, two or more than two applications when using the technology enhanced learning are not significantly different. We can stop at this point but for the sake of discovery, we continued with homogenity of variances and post hoc analysis. This yielded p-value (0.770) for a Levene statistic of 0.262. Hence null hypothesis is maintained and variances concluded to be homogeneous. The S-N-K test for homogeneous variances and unequal sample sizes was conducted. It yielded the following result as shown in the SPSS output below:
Table 8.0: the S-N-K test for homogeneous variances and unequal sample sizes
How type of applications has you used in the Technology
enhanced classroom? N
Subset for alpha = 0.05 1
Two applications 37 4.1824
One application 56 4.2009
Three applications 48 4.4896
Sig. 0.276
Student-Newman-Keulsa,b
Hence there is no significant difference in the mean values of learning experiences of students using one, two, or more than two applications when using the technology enhanced learning. This was the same conclusion obtained from the One-way ANOVA test.
4.5Non – parametric Test for ANOVA
Smart devices include laptop computer, iPad, tablet, smartphone, desktop computer, or anything similar. Consequently a non-parametric test, the Kruskal-Wallis test was selected. The sample sizes were as follows:
Table 9.0: Central Limit Theorem of sample on number of devices
Sample size (no. of respondents)
No. of students owning and using the following number of devices One device(1) Two devices(2) More than two devices (>2)
9 40 92
ANOVA was also considered but the Central Limit Theorem cannot be applied to assume normality in this case as one of the sample sizes, i.e. sample size for one device was only 9, which is less than 30. Hence the Kruskal-Wallis test is the appropriate test. Nonetheless we also performed the ANOVA subsequent to the Kruskal-Kruskal-Wallis test just to observe the result.
The finding indicates that Chi-Square (5.929), the p-value (0.052) > 0.05, hence we do not reject the null hypothesis even though 0.052 and 0.05 are very close. The mean value of the learning experiences of students owning and using one, two or more than two devices using the technology enhanced learning are not significantly different.
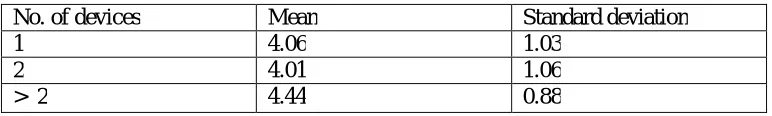
Table 10.0: The mean and standard deviations between numbers of devices
No. of devices Mean Standard deviation
1 4.06 1.03
2 4.01 1.06
> 2 4.44 0.88
ANOVA test was also performed on the same hypothesis for purpose of comparison. The finding indicates that F (3.181), the p-value (0.045) < 0.05, it appears that we need to reject the null hypothesis. We then proceed with variance homogeinity test which depicted for Levene statistic (0.262), p-value (0.770) > 0.05, which conclude that variances are homogenous.
A post-hoc analysis using the S-N-K test was performed as variances are equal but sample sizes are not equal. Based on the S-N-K test, none of the mean value of learning experiences was significantly different from the other. They all fall under the same column with the values as shown in the table 11.0.
Table 11.0: The S-N-K test for homogeneous variances and unequal sample sizes
How type of applications have you used in the Technology enhanced
classroom? N
Subset for alpha = 0.05 1
Two devices 40 4.0125
One device 9 4.0556
Three devices 92 4.4402
Sig. 0.318
Student-Newman-Keulsa,b
Hence the same conclusion can be drawn from ANOVA as from the Kruskal-Wallis test. We do not reject the null hypothesis. The mean values of the learning experiences of students owning and using one, two or more than two devices using the technology enhanced learning are not significantly different.
5. Conclusion
A study was conducted to determine if the learning experience using the technology enhanced learning was perceived differently by different groups of students in the Taylor’s Business School. Cluster sampling was used with the law module students identified as the cluster representing the entire School. The response rate of 31.33% was sufficient to mitigate concerns over any non-response bias. The survey consisted of a single construct with four items to gage the learning enhancement experience of four groups of students grouped according to their gender, the number of devices owned and used, the number of e-learning application they had used in the technology enhanced learning and their programme level whether they were in the foundation or the degree programme.
The level of enhancement was higher for the male students at a mean value of 4.47 compared to female students at a mean value of 4.13. There was no significant difference in perceived learning experience enhancement for the other groups such as number of devices owned, number of e-learning applications used and the programme level. These tests were performed based on a significance level of 0.05 for Type 1 error.
Hence through the result obtained from sampling the law module students of Taylor’s Business School, it can be concluded statistically that the gender of the students has a significant effect on the perceived learning enhancement obtained through the use of the technology enhanced learning for the Taylor’s Business School students. Therefore, sooner or later many students of current Generation Y age will be interested and committed to e-learning (Tagoe, 2012).
References
Balraj Kistow (2011), Blended learning in higher education: A study of a graduate school of business, Trinidad and Tobago Caribbean Teaching Scholar, Vol. 1, No. 2, November 2011, 115–128
Berge, Z. L. (1999). Interaction in post-secondary web-based learning and teaching. Educational Technology, 39 (1), 5-11.
Berge, Z. L. (2002). Active, interactive and reflective elearning. The Quarterly Review of Distance Education, 3 (2), 181-190.
Clark, R. C. & Mayer, R. E. (2011). E-learning and the science of instruction: Proven guidelines for consumers and designers of multimedia learning. (book)
Dziuban, C. D., Hartman, J., Juge, F., Moskal, P. D., and Sorg, S. (2006). Blended learning enters the mainstream. In Handbook of Blended Learning: Global Perspectives, Local Designs, edited by C. J. Bonk and C. R. Graham, pp. 195–208. San Francisco, CA: Pfeiffer Publishing
Dodge, B. (1996). Active learning on the web (k-12 version). [Online] [Accessed August 7, 2001] http://edweb.sdsu.edu/people/bdodge/active/ActiveLearningk-12.html
Hicks, M., Reid, I. and George, R. (2001), Enhancing on-line teaching: Designing responsive learning environments, The International Journal for Academic Development, 6 (2), pp. 143–151
Garrison, D. R., & Kanuta, H. (2004). Blended learning: Uncovering its transformative potential in higher education. The Internet and Higher Education, 7(2), 95-105.
Graham, C. R. (2005). Blended learning systems: Definition, current trends, and future directions. In C. J. Bonk & C. R. Graham (Eds.), Handbook of blended learning: Global perspectives, local designs (pp. 3-21). San Francisco: Pfeiffer Publishing.
Graham, C. R., & Allen, S. (in press). Designing blended learning environments. In C. Howard, J. V. Boettecher, L. Justice, K. D. Schenk, P. L. Rogers, & G. A. Berg (Eds.),
Encyclopedia of distance learning (2nd ed.). Hershey, PA: Idea Group Reference.
Graham, C. R., Allen, S., &Ure, D. (2003). Blended learning environments: A review of the research literature. Retrieved May 29, 2006, from http://msed.byu.edu/ipt/graham/vita/ble_litrev.pdf
Graham, C. R., & Dziuban, C. D. (submitted). Core research and issues related to blended learning environments. In J.M. Spector, M. D. Merrill, J. J. G. van Merrienboer, & M. P. Driscoll (Eds.), Handbook of research on educational communications and technology (3rd ed.). Mahwah, NJ: Lawrence Earlbaum Associates Graham, C. R., & Robison, R. (in press). Realizing the transformational potential of blended learning: Comparing
cases of transforming blends and enhancing blends in higher education. In A. G. Picciano& C. D. Dziuban (Eds.), Blended learning: Research perspectives. Sloan Consortium.
Laird, T., and G. Kuh. 2005. Student experiences with information technology and their relationship to other aspects of student engagement. Research in Higher Education 46 (2): 211–233.
Laurillard, D.M. (2008). The teacher as action researcher: Using technology to capture pedagogic form.Studies in Higher Education, 33(2), 139-154
McLoughlin, C. & Lee, M. J. W. (2010). Personalised and self-regulated learning in the Web 2.0 era: International exemplars of innovative pedagogy using social software. Australasian Journal of Educational Technology, 26(1), 28-43. http://www.ascilite.org.au/ajet/ajet26/mcloughlin.html
Neo, M. and Neo. T. K & Lim. S., (2013), Designing a Web-Based Multimedia Learning Environment with Laurillard’s Conversational Framework: An Investigation on Instructional Relationships, The Turkish Online Journal of Educational Technology – Volume 12 issue 3
Orhan, R. (2008). Redesigning a course for blended learning environment. Turkish Online Journal of Distance Education, 9(1).
Phillips, F., and B. Johnson, (2011), Online homework versus intelligent tutoring systems: Pedagogical support for transaction analysis and recording, Issues in Accounting Education 26 (1): 87–97.
Robison, R. (2005). The business of online education: are we cost competitive? In Elements of Quality Online Education: Engaging Communities, edited by J. Bourne and J. C. Moore, pp. 173–181. Needham, MA: Sloan Consortium. Rosenberg, M. J. (2001). E-learning: Strategies for delivering knowledge in the digital age.
Santally, M.I., (2013), Effectiveness of Personalised Learning Paths on Students Learning Experiences in an e‐Learning Environment, European Journal of Open, Distance and e‐Learning – Vol. 16 / No. 1 36, ISSN 1027‐5207
Tagoe, M., (2012), Students’ Perception in incorporating e-learning into teaching and learning at the University of Ghana, International Journal of Education and Development Using Information and Technology, I(8), 91-103
Teeter, S., S. R. Madsen, J. Hughes, and B. Eagar. 2007. The perceptions and experiences of students in a paperless accounting class. The Journal of Effective Teaching 7 (1): 15–30.