The Thirty-Third AAAI Conference on Artificial Intelligence (AAAI-19)
3D Object Detection Using Scale Invariant and Feature Reweighting Networks
Xin Zhao,
1Zhe Liu,
2∗Ruolan Hu,
2Kaiqi Huang
11Center for Research on Intelligent System and Engineering
Institute of Automation, Chinese Academy of Sciences, Beijing, China, 100190 2Huazhong University of Science and Technology, Wuhan, China, 430074
[email protected], [email protected], [email protected], [email protected]
Abstract
3D object detection plays an important role in a large number of real-world applications. It requires us to estimate the lo-calizations and the orientations of 3D objects in real scenes. In this paper, we present a new network architecture which focuses on utilizing the front view images and frustum point clouds to generate 3D detection results. On the one hand, a PointSIFT module is utilized to improve the performance of 3D segmentation. It can capture the information from dif-ferent orientations in space and the robustness to difdif-ferent scale shapes. On the other hand, our network obtains the use-ful features and suppresses the features with less informa-tion by a SENet module. This module reweights channel fea-tures and estimates the 3D bounding boxes more effectively. Our method is evaluated on both KITTI dataset for outdoor scenes and SUN-RGBD dataset for indoor scenes. The eximental results illustrate that our method achieves better per-formance than the state-of-the-art methods especially when point clouds are highly sparse.
Introduction
In recent years, remarkable progress has been made on the task of 2D object detection in complex scenes by deep con-volutional neural networks (Girshick 2015; Redmon et al. 2016; Liu et al. 2016). However, it still remains an open problem on 3D object detection. Such as on the KITTI ob-ject detection benchmark (Geiger, Lenz, and Urtasun 2012), a great gap of the average precision (AP) still remains be-tween 2D and 3D object detections. The most important thing of 3D object detection is the way to use the 3D infor-mation which represents the depth inforinfor-mation of objects in the estimation task. In addition, different from 2D object de-tection, we need to consider the orientations of 3D bounding boxes simultaneously. Since 3D Lidar is limited by the num-ber of horizontal scan lines and has a non-uniform sampling manner in 3D space, the obtained point clouds are usually very sparse and uneven distributed. These difficulties on 3D object detection bring us enormous challenges.
Some existing methods (Li, Zhang, and Xia 2016; Wang, Zhan, and Tomizuka 2017) project the 3D point clouds to
∗
Corresponding author
Copyright c2019, Association for the Advancement of Artificial Intelligence (www.aaai.org). All rights reserved.
the 2D images or fuse the object information from multi-ple views (Su et al. 2015; Rubino, Crocco, and Del Bue 2018). These approaches are intuitive and have obtained sat-isfactory results in simple scenes. However, they are limited in complex scenes for the reason of losing 3D information. Other methods (Engelcke et al. 2017; Maturana and Scherer 2015) convert point clouds into a 3D voxel grid by quan-tization and extract each voxel feature by applying 3D con-volutional neural networks. However, these approaches have high computational costs especially on dealing with 3D con-volutional operations preventing them for real-world appli-cations.
Since 3D data is usually storaged in the form of point clouds, we can mainly make use of this kind of data to ex-tract shape features. Recently, Qi et al. provide a unified net-work architecture named Pointnet (Qi et al. 2017a), which can represent the permutation invariance of the original in-put point clouds. It is widely applied in 3D object classifica-tion and 3D part segmentaclassifica-tion. Pointnet has strong ability to capture global structure information rather than local infor-mation. Therefore, an improved version of Pointnet which called Pointnet++ (Qi et al. 2017b) is proposed to obtain local structures by increasing contextual scales in distance metric space.
bench-marks. However, it still has some limitations. Since Point-net++ uses K-nearest searching method, it may lose many useful local orientation information. In real scenes, objects have quite different scales. Thus, we need to consider the scale variations of 3D objects. In addition, each channel fea-ture has different contribution to the network which should have the ability to distinguish their importance.
In this paper, we propose a sub-network (Point-UNet) to achieve the scale invariance and capture the orientation information. In term of the network structure, we can ob-tain context information and produce the precise localiza-tion through a symmetric expanding path. The network can be trained from limited samples but obtains a satisfactory result. This is also captured in 3D UNet (C¸ ic¸ek et al. 2016) for segmentation tasks. Since the standard 3D convolutional, pooling and upsampling operations would lead to a large amount of computation cost. In our network, we take the Set Abstraction (SA) module and the point Feature Propa-gation (FP) module (Qi et al. 2017b) to improve our net-work. Point-UNet has the ability to learn the different orien-tation information while it is adaptive to scale variations. We achieve this by integrating a PointSIFT module (Jiang, Wu, and Lu 2018) into our network. Since the front view image has rich appearance information, we encode them into our Point-UNet with Resnet-50 (He et al. 2016) as our backbone feature extractor. Thus, our network can distinguish the cat-egories of objects efficiently through the color information of each 3D point.
The second component of our network is a T-Net sub-network. It is used to centralize the points of interests ini-tially. In the network, we use a SA module not only to learn the global feature but also take the extra Lidar reflection in-tensity feature into consideration. Finally, Point-SENet is the sub-network designed to estimate final 3D bounding boxes. Since each channel feature has different contribution to the whole network. To make the network have an ability to en-hance the useful features and suppresses the useless features, we extend the SENet (Hu, Shen, and Sun 2018) module into 3D space to learn the relationship of 3D point channel fea-tures.
For outdoor scenes, F-Pointnet (Qi et al. 2018) has ob-tained 8.04% Average Precision (AP) better than (Chen et al. 2017) on 3D detection task for Cars on KITTI dataset. For indoor scenes, it has also achieved 4.4% better 3D mean Av-erage Precision (mAP) than COG (Ren and Sudderth 2016) on SUN-RGBD dataset. Compared with F-Pointnet (Qi et al. 2018), our model obtains 1.4% higher 3D mAP perfor-mance on the validation set of KITTI and 4.4% higher 3D mAP performance on the test set of SUN-RGBD.
Our contributions in this paper are as follows:
• We propose a new network architecture which has scale invariance to the shape of point clouds. It has excellent applicability to highly sparse point clouds as it is robust to different scale shapes.
• Our network can reweight features by learning the corre-lation from different channel features. This takes the rela-tionship of different channel features into account.
• Our method has significant and consistent improvement
on both outdoor dataset and indoor dataset compared with the state-of-the-art approaches.
Related Work
Researchers propose high-quality hand-crafted feature rep-resentations to localize 3D objects (Dorai and Jain 1997; Johnson and Hebert 1999; Rusu, Blodow, and Beetz 2009) when 3D object detection just emerges. These methods can obtain acceptable results when 3D shape descriptions are available in a simple scene. However, they fail to learn po-tential invariant features from more complex scenes so that they have a certain gap in practical applications.
The monocular RGB images can provide rich appear-ance and context information. Deep3DBox (Mousavian et al. 2017) finds the fact that the perspective projection of the 3D bounding boxes should fit tightly within their 2D de-tection boxes. It extracts the 3D bounding boxes only from monocular RGB images. (Chen et al. 2016) proposes an en-ergy minimization method that puts candidate boxes in 3D space by exploiting the fact that objects should be on the ground-plane and perform 3D object detection from monoc-ular images. However, due to lacking of depth information, they fail to get high accuracy on 3D object detection tasks.
Estimating the orientations of 3D bounding boxes is of great importance as the orientation angles will directly af-fect the 3D detection. We can easily get the orientation information from the bird’s eye view of 3D point clouds. (Chen et al. 2017) utilizes a bird’s eye view representation of point clouds to generate 3D highly accurate candidate boxes. However, this region proposal method would fall behind for small object detection.
3D space can be discretized into a 3D voxel grid and a sliding window method can be used through all three di-mensions for detection (Wang and Posner 2015). It is also demonstrated that the exhaustive window searching in 3D space can be extremely efficient by exploiting the sparsity of the problem. Voxelnet (Zhou and Tuzel 2018) divides 3D points into 3D voxel grids equally in space, putting forward a novel voxel feature encoding (VFE) layer to encode each voxel via stacked VFE layers, which enable the interaction between points within a voxel by combining point-wise fea-tures with a locally aggregated feature. Then, the region pro-posal network takes the voxel features and obtains the 3D detection results.
In order to reduce the search space, F-pointnet (Qi et al. 2018) extracts the 3D frustum point clouds by extruding 2D bounding boxes from 2D image detectors. Then Point-nets (Qi et al. 2017a; 2017b) are performed for each 3D bounding box frustum to get 3D points of interests. Finally, an amodal 3D box estimation network is applied to yield the 3D detection results.
SIFRNet For 3D Object Detection
Point-UNet 2D Detector
Point-SENet
𝑐𝑟𝑜𝑝
𝐹𝑟𝑢𝑠𝑡𝑢𝑚
64-D Vector
Extractor
T-Net
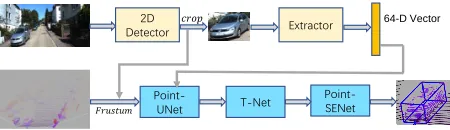
Figure 1: The pipeline of SIFRNet for 3D object detection
of SIFRNet architecture are introduced.
Point-UNet: 3D instance segmentation network
This module takes 3D points in the frustum as the input and outputs the probability of each point to determine whether it is the point of interests or not. In the later 3D box estimation network, only these points of interests are really useful to the estimation of 3D bounding boxes, and other points may be the background or noise.
For one-class 3D detection tasks, an efficient model can be more easily designed to get satisfied detection results. However, objects in multiple categories have huge differ-ences in size and orientation angle. These problems bring great difficulties for the 3D box estimation. Therefore, it is necessary that the network should have the ability to iden-tify different types of objects. Then, the geometric features of objects in different categories can be distinguished when estimating 3D bounding boxes.
RGB image information with an effective and available feature plays an irreplaceable role in most 2D classification, detection and scene understanding tasks. For example, the color information is quite different from Cars, Pedestrians and Cyclists on the KITTI dataset. If the color information of these objects is known in advance, we can exploit the dif-ference in color to get better performance. However, some objects are hardly to be distinguished only be the color in-formation in sparse 3D point cloud space, such as Pedes-trians and Cyclists. Luckily, the front view 2D image can provide much more appearance information, so we can en-code the regions of interests into high-dimensional represen-tations and fuse them into the network. Finally, the one-hot class information from 2D detection results can be utilized to improve the performance of the segmentation network as well.
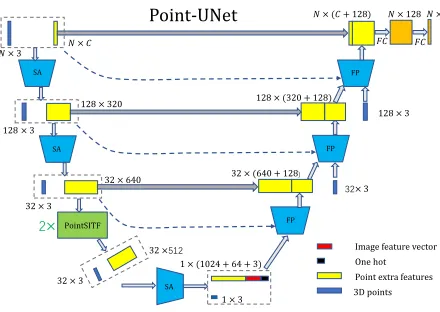
The architecture of Point-UNet is shown in Figure 3. The input data of the network isN ×3 3D point clouds for 3 axis, and the corresponding extra data isN×3RGB images for 3 channels and N ×1Lidar reflection intensity maps. Nis the number of point clouds. In the beginning, the point cloud features can be extracted via two Set Abstract (SA) modules, which can be vividly understood as the process of Convolution and Pooling operations. Since Pointnets can not consider the orientation information of point clouds and the adaptability to the shape scales, we introduce the PointSIFT module based on the segmentation network of Pointnet++ into the network. Before the global SA module operation, two PointSIFT modules are integrated into our network. As a result, it has an ability to capture the orientation
informa-tion in 3D space and has the robustness to different scale shapes. Then, we perform three FP operations, which can be considered as the process of Deconvolution and Upsampling operations. In addition, the previous point features at each stage of Feature Propagation (FP) layer are concatenated to gain richer information. Finally, the probability of the points of interests can be predicted via two fully-connected layers. The 3D instance segmentation network looks like an English letter U, so we name the network as Point-UNet.
T-Net: 3D point cloud translation network
The architecture of T-Net is shown in Figure 2, which is pri-marily used to estimate the center of a 3D box and translate the points of interests to the center of the box. After this pro-cess, the subsequent network only needs to further predict the residual for the final 3D box.
The input of the network is the points of interests from Point-UNet. The extracted feature is the reflection intensity of the Lidar. The input is imported into a SA module to ex-tract the global features of 3D point clouds. Next, two fully-connected layers are used to predict the negative center co-ordinates, which are added to the original input points for achieving the process of the point cloud translation. The net-work is functionally similar to the translation netnet-work with similar residual network structure.
Point-SENet: 3D box estimation network
Point-SENet architecture is shown in Figure 2 which is mainly used to estimate the cx,cy, cz, h, w, l,θ param-eters of a 3D box. cx,cy,cz represent the 3D box center coordinates along the X, Y, Z axis, respectively.h,w,l rep-resent the length, width and height of a 3D box, respectively. θrepresents the heading angle along up-axis. In addition, the output of the network is a (3+4×NS+2×NH)-dimensional vector. NS denotes the number of size templates and NH represents for the number of orientation angle templates.
The input of the network is 3D point clouds from T-Net, no extra feature is used. At first, two point-wise convolu-tions are performed to get a high-dimensional point cloud feature which isX∗. Since the general convolutional
neu-ral networks do not consider the relationship of all channel features, it may causes some useless features propagating to subsequent networks, decreasing the performance of the en-tire network. In order to improve the feature representation ability of the network, the SENet module is extended into 3D space for operating on 3D point clouds directly.
The third convolutional operation in Point-SENet model is used to obtain the input feature of SENet moduleX. First, the squeeze operation is performed by a global max pooling layer instead of the global average pooling layer to aggregate spatial information into the channel feature which is formu-lated as follows:
Clsq= max(Xl1:h,1:w) (1)
Point-SENet
SA
128
𝑀 × 1 × 128
+
T-Net
𝐹𝐶 𝐹𝐶 × +
SENet
𝑀 × 1 × 3 1 × 128
1 × 32
512 + 3
1 × 128 3
𝑀 × 3
𝑀 × 𝐶 𝑀 Res-SENet 𝑀 × 1 × 512 512 256 59
Figure 2: The network architecture of T-Net and Point-SENet.
PointSITF
𝑁 × 𝐶 𝑁 × 3
128× 3
32 × 3
32 × 640
32 × 3
32× 3 128 × 3
32 ×512
128 × 320
1 × 3 1 × (1024 + 64 + 3)
32 × (640 + 128) 128 × (320 + 128)
𝑁 × (𝐶 + 128) 𝑁 × 128 𝑁 × 2
SA
SA
SA
FP FP
FP
Image feature vector
One hot Point extra features 3D points
Point-UNet
𝐹𝐶 𝐹𝐶
2×
Figure 3: The network architecture of Point-UNet.
the correlation between all channel features. The excitation operation is used to obtain the channel-wise dependency and formulated as:
Scalel=Sigmoid(W2Relu(W1Clsq)) (2)
whereW1∈ R c
r×candW1∈ Rc× c
r represent the
param-eters of two fully connected layers, respectively.rdenotes the reduction rate of the bottleneck (r = 4in our model). Next, the original feature is multiplied byScalel, obtaining the featureXlse, which achieves the process of reweighting the feature channels of 3D point clouds.
Xlse=Scalel·Clex (3)
Since the value ofScalel is limited to(0,1), the gradient disappears easily during the back-propagation, which makes the optimization of the network very difficult. Encouraged by the residual networks (He et al. 2016), we use the follow-ing formulation for better gradient back-propagation:
FlSE=Xlse+Xl∗ (4)
The model can automatically obtain the importance of chan-nel features by self-learning. According to the importance of each channel feature, useful features are enhanced while features that have little information to the network are sup-pressed. The final output feature via SENet module can be represented asFSE ={F1SE,F
2 SE, ...,F
c
SE}. After that, a point-wise convolution operation is performed to upgrade the reweighted features to 512 dimensions. It is aimed at al-leviating the loss of information in the subsequent pooling
operation. Finally, three fully-connected layers are used to estimate all residual parameters of 3D bounding boxes.
Loss Function
We compute the loss function for Point-UNet, T-Net and Point-SENet jointly.Lsegis the classification loss for Point-UNet. LT−N etis the center regression loss for T-Net. For Point-SENet,Lc−reg andLangle−clsare losses for estima-tion of the orientaestima-tion angle.Langle−reg andLsize−clcare losses for the estimation of 3D box size.Lcornerrepresents the distances between the eight corners of the groundtruth 3D box and the predicted 3D box. The corner loss can refer to (Qi et al. 2018) for details. The total loss function can be formulated as follows:
Ltotal=Lseg+LT−N et+λ(Lcenter−reg+ Langle−cls+Langle−reg+Lsize−clc
+Lsize−reg+γLcorner)
(5)
In addition, the new L2 loss function is redefined for Langle−reg. The L2 loss for an orientation angle is equal to the Euclidean distance between the true angle and the pre-dicted angle, which is a more reliable angle regression for estimating 3D bounding boxes. It is worth noting that co-sine function is not easy to optimize, so we only use it in the process of fine-tuning.
Langle−reg=
1
B N S X
m=1 N H X
n=1
Mmn|ejθmn−ejθ ∗ mn|2
= 1
B N S X
m=1 N H X
n=1
Mmn[(cosθmn−cosθ∗mn) 2
+ (sinθmn−sinθmn∗ ) 2]
= 1
B N S X
m=1 N H X
n=1
Mmn[2−2cos(θmn−θ∗mn)]
(6) where B is the batch size andM is the mask which can be obtained from the output of Point-UNet.θrepresents the groundtruth orientation angle and θ∗ means the predicted orientation angle.
Experiments
Datesets and Evaluation Metrics
Method Cars Pedestrians Cyclists 3D mAP
Easy Moderate Hard Easy Moderate Hard Easy Moderate Hard
Mono3D (Chen et al. 2016) 2.53 2.31 2.31 - - -
-3DOP (Chen et al. 2015) 6.55 5.07 4.10 - - -
-VeloFCN (Li 2017) 15.20 13.66 15.98 - - -
-MV3D (Chen et al. 2017) 71.29 62.68 56.56 - - -
-Pointfusion-final (Xu, Anguelov, and Jain 2018) 77.92 63.00 53.27 33.36 28.04 23.38 49.34 29.42 26.98 42.75
AVOD(Feature Pyramid) (Ku et al. 2018) 84.41 74.44 68.65 - 58.8 - - 49.7 -
-F-pointnet(V1) (Qi et al. 2018) 83.26 69.28 62.56 - - -
-F-pointnet(V2) (Qi et al. 2018) 83.76 70.92 63.65 70.00 61.32 53.59 77.15 56.49 55.37 65.58
V2-SENet 84.71 71.25 63.74 69.14 60.12 52.91 78.71 57.43 53.55 65.73
V2-SENet-PointSIFT 84.45 71.87 64.06 69.13 60.21 53.10 79.43 58.55 54.86 66.18
V2-SENet-PointSIFT-rgb-image 85.99 72.72 64.58 69.26 60.54 52.90 79.43 59.26 55.09 66.64
Fine-tune-final 85.62 72.05 64.19 69.35 60.85 52.95 80.87 60.34 56.69 66.99
Table 1:AP3D(%) results on KITTI validation set for 3D object detection.
Method Cars Pedestrians Cyclists 3D mAP
Easy Moderate Hard Easy Moderate Hard Easy Moderate Hard
Mono3D (Chen et al. 2016) 5.22 5.19 4.13 - - -
-3DOP (Chen et al. 2015) 12.63 9.49 7.59 - - -
-VeloFCN (Li 2017) 40.14 32.08 30.47 - - -
-MV3D (Chen et al. 2017) 86.55 78.10 76.67 - - -
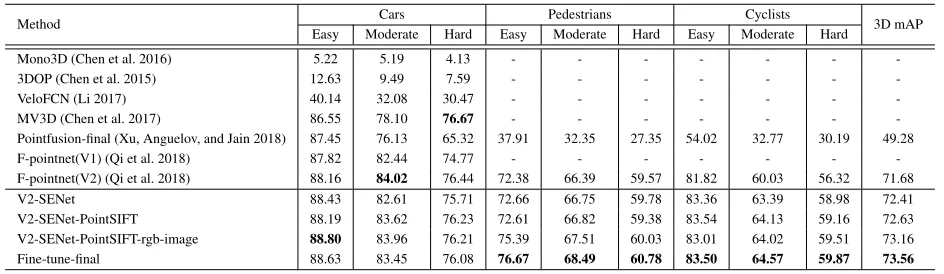
-Pointfusion-final (Xu, Anguelov, and Jain 2018) 87.45 76.13 65.32 37.91 32.35 27.35 54.02 32.77 30.19 49.28
F-pointnet(V1) (Qi et al. 2018) 87.82 82.44 74.77 - - -
-F-pointnet(V2) (Qi et al. 2018) 88.16 84.02 76.44 72.38 66.39 59.57 81.82 60.03 56.32 71.68
V2-SENet 88.43 82.61 75.71 72.66 66.75 59.78 83.36 63.39 58.98 72.41
V2-SENet-PointSIFT 88.19 83.62 76.23 72.61 66.82 59.38 83.54 64.13 59.16 72.63
V2-SENet-PointSIFT-rgb-image 88.80 83.96 76.21 75.39 67.51 60.03 83.01 64.02 59.51 73.16
Fine-tune-final 88.63 83.45 76.08 76.67 68.49 60.78 83.50 64.57 59.87 73.56
Table 2:AP2D−Bird−V iew(%) results on KITTI validation set for 3D object localization.
common evaluation metric. If 3D IoU with the groundtruth is over a given threshold, the predicted 3D box is considered as a true positive (TP). For KITTI dataset, we follow the of-ficial KITTI evaluation protocol, where 3D IoU threshold is 0.7 for Cars category and 0.5 for both Pedestrians and Cy-clists categories, respectively. On SUN-RGBD dataset, the 3D IoU is 0.25 for all the categories.
KITTI:The KITTI 3D object detection dataset contains
7481 training images and Velodyne Lidars. We follow the settings in (Qi et al. 2018) and split the dataset into training set and validation set with 3717 and 3769 samples, respec-tively. Finally, we report the results on the validation set for Cars, Pedestrians and Cyclists categories.
SUN-RGBD:The SUN-RGBD dataset have 700 object
categories, the training set and test set contains 5285 and 5050 images, respectively. But we only report the results of ten kinds of objects in the test set with the same settings in (Qi et al. 2018). This is because there are more samples on these categories and the object sizes are also relatively larger than the others.
Implementation Details
The details on 2D detector:In 2D detection tasks,
manu-ally selecting anchor boxes can not match the distribution of the 2D boxes well from the training set, and it is better to apply K-means (Jain 2010) to cluster the anchor boxes from the training set. YoloV3 (Redmon and Farhadi 2018)
is used as the 2D detector to generate the final 2D bounding boxes. The model is pre-trained on MS-COCO dataset and fine-tuned on SUN-RGBD dataset. We adopt Adaptive Mo-ment Estimation (Adam) to optimize the model. The learn-ing rate is equal to 1e-4. Durlearn-ing the trainlearn-ing process, we freeze the first 185 layers and release all the layers after 50 epochs. The training is terminated after 100 epochs. For fair comparisons, 2D detection results are the same with (Qi et al. 2018) on KITTI dataset.
The details on SIFRNet:The input data sizes of
Point-UNet, T-Net and Point-SENet are N×7,N×4 and N×3, respectively. ResNet-50 is used to extract the features of the cropped images from 2D detector. The 64-dimensional fea-ture vector is obtained by the AveragePooling2D layer of ResNet-50. The Adam optimizer is adopted to optimize the deep neural networks with the learning rate of 0.001. The first exponential decay rate is equal to 0.95 and the second exponential decay rate is equal to 0.999. In addition, data augmentation on point clouds is performed in the following two ways: randomly flip the point clouds in the frustums and shift the point clouds in the frustums along the z-axis direc-tion.
Comparisons to the state-of-the-art methods
Experimental results on KITTI: The results of our 3D
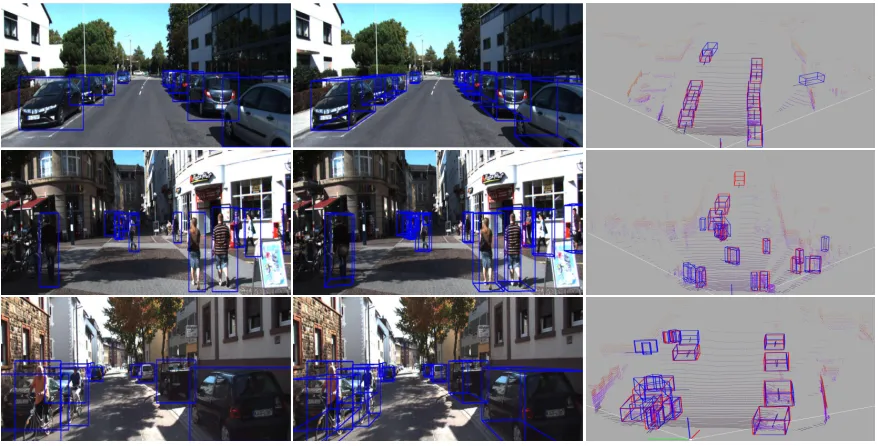
Figure 4: The visualization results for 3D object detection on KITTI validation set. The first column shows the 2D detection re-sults on 2D images. The second column displays the 3D boxes that are projected on the 2D image. The last column demonstrates our 3D detection results on Lidar. The groundtruths are in red and the predicted boxes are in blue.
Pointfusion (Xu, Anguelov, and Jain 2018) that use multi-sensor fusion strategy, our network greatly outperforms these state-of-the-art methods. In the experiments, our V2-SENet method only uses V2-SENet module instead of the three SA modules on F-Pointnet (v2) (Qi et al. 2018) which con-tains more parameters. With the reduced number of param-eters of our model, the performance still has a slight im-provement. V2-SENet-PointSIFT is based on the V2-SENet model with an additional PointSIFT module. V2-SENet-PointSIFT-rgb-image is the model that image features and RGB information are attached to V2-SENet-PointSIFT for further improvements. Fine-tune-final is the model that we fine-tune on the V2-SENet-PointSIFT-rgb-image model by using the redefined angle loss function. As shown in the re-sults, our methods have a lower accuracy on the Cars class than AVOD for 3D object detection. It should be noted that our network generates a single model to predict all cate-gories for a good generalization ability. However, AVOD separates Cars category individually for training to achieve better performance. This makes the trained model not adap-tive for all object categories.
In order to illustrate the effectiveness of the new an-gle regression loss, we use the same pre-trained model to experiment on different angle loss functions with various epochs. The 3D mAP results of the original loss are 65.37%, 65.82%, 66.54% and 66.68% (epochs=1, 5, 10 and our fine-tune-final result) while the corresponding 3D mAP results of the proposed loss are 65.61%, 66.25%, 66.91% and 66.99%, respectively. Based on the above results, our angle loss has more contributions on the performance. In addition, Table 2 also reports the results on 3D object localization. Since Cy-clists category contains persons, it is very difficult to
distin-guish Cyclist and Pedestrian categories. Nevertheless, our method still outperforms the cutting-edge methods on Cars and Cyclists categories. Figure 4 shows the visualization re-sults of our method for 3D object detection on KITTI vali-dation set.
Experimental results on SUN-RGBD: Different from
the KITTI dataset for outdoor scenes with only three types of objects, SUN-RGBD contains much more kinds of objects in indoor environment which bring us even greater chal-lenges for 3D object detection. In the experiments, YoloV3 is used as our 2D detector and has achieved 2D mAP of 53.9% on SUN-RGBD test dataset. The whole network ar-chitecture is the same to the one on KITTI dataset. Ta-ble 3 indicates that our method significantly outperforms the state-of-the-art methods which include DSS (Song and Xiao 2016), 2d-driven (Lahoud and Ghanem 2017), Point-fusion (Xu, Anguelov, and Jain 2018), COG (Ren and Sud-derth 2016) and F-Pointnet (v1) (Qi et al. 2018). Surpris-ingly, We achieve 4.4% 3D mAP higher than F-Pointnet (Qi et al. 2018). For 2048 input 3D points, our method has a rela-tive 2.3% 3D mAP higher than V1-2048. Figure 5 shows the visualization results of our method for 3D object detection on SUN-RGBD test set.
Influence of 2D Detection
Method bathtub bed bookshelf chair desk dresser nightstand sofa table toilet 3D mAP
DSS (Song and Xiao 2016) 44.2 78.8 11.9 61.2 20.5 6.4 15.4 53.5 50.3 78.9 42.1
2d-driven (Lahoud and Ghanem 2017) 43.5 64.5 31.4 48.3 27.9 25.9 41.9 50.4 37.0 80.4 45.1
Pointfusion (Xu, Anguelov, and Jain 2018) 37.3 68.6 37.7 55.1 17.2 24.0 32.3 53.8 31.0 83.8 44.1
COG (2016) 58.3 63.7 31.8 62.2 45.2 15.5 27.4 51.0 51.3 70.1 47.6
F-Pointnet(v1) (Qi et al. 2018) 43.3 81.1 33.3 64.2 24.7 32.0 58.1 61.1 51.1 90.9 54.0
V1-1024 51.6 82.0 32.2 54.6 33.5 32.4 67.9 66.3 48.0 88.2 55.7
V1-2048 51.6 83.1 35.4 54.5 33.0 33.7 68.2 66.7 48.2 87.1 56.1
Ours-1024 61.5 83.3 38.1 57.7 33.8 32.8 67.3 67.4 51.3 87.3 58.1
Ours-2048 64.0 84.4 38.4 57.9 34.1 32.2 67.7 67.3 51.4 86.2 58.4
Table 3: Comparison with the state-of-the-art methods on SUN-RGBD test dataset.
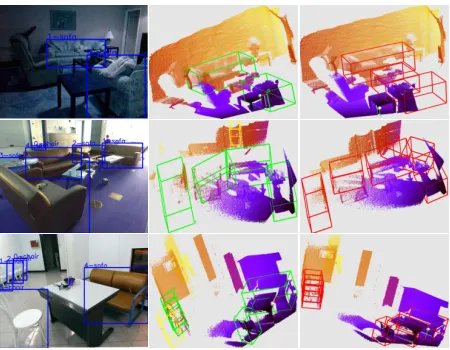
Figure 5: The visualization results for 3D object detection on SUN-RGBD test set. The first column shows the 2D bound-ing boxes based on YoloV3. The second column displays the 3D bounding boxes on 3D point clouds. The green boxes are true positives and yellow boxes are false positives. The 3D IoU threshold is 0.25. The last column illustrates the groundtruths which are in red.
the bigger gain of our model for 3D detection.
2D mAP 3D mAP
V1 Our Gain
40.6 46.1 48.1 2.0
47.1 49.6 51.6 2.0
50.5 52.2 54.3 2.1
52.9 55.5 57.6 2.1
53.9 56.1 58.4 2.3
GT 84.1 86.7 2.6
Table 4: The influence of 2D detection.
Influence of the Number of Input Points
The KITTI dataset is collected from a long-distance outdoor scene, sometimes there are only a few points on the 3D ob-ject. To analyze the influence of the number of 3D points for 3D bounding box estimation, we perform the experiments on SUN-RGBD test dataset which has reliable dense depth
maps. We take 32, 128, 256, 512, 1024, 2048 points (in a frustum) as the input, respectively. Table 5 shows 3D mAP results with different number of input points. It can be seen that our model can achieve a big improvement when the number of input points is very small. In particular, with 32 3D points as the input, our mAP still obtains 51.1%, which is 7.2% higher than the V1 result with a huge margin. It can be proved that our model is quite suitable for highly sparse 3D point clouds.
Number of input points
3D mAP
V153.9 Our53.9 Gain V1GT OurGT Gain
32 43.9 51.1 7.2 63.1 70.2 7.1
128 53.1 56.3 3.2 79.2 83.2 3.0
256 54.4 56.9 2.5 81.4 85.3 2.9
512 55.4 57.8 2.4 83.2 86.0 2.8
1024 55.7 58.1 2.4 83.7 86.3 2.6
2048 56.1 58.4 2.3 84.1 86.7 2.6
Table 5: The influence of the number of input points.
Conclusion
In this paper, SIFRNet is put forward for 3D object detec-tion, which is suitable for both indoor and outdoor scenes. The proposed architecture can make full use of the advan-tages of both RGB images and 3D point clouds. Outstanding experiment results both on KITTI dataset which contains a large number of sparse point clouds and SUN-RGBD dataset which contains many occluded objects reveal that our model has a certain generalization ability and robustness on 3D object detection tasks. Even when the point clouds are ex-tremely sparse, our method can still obtain very satisfied re-sults, which also demonstrates that our model can provide a better 3D representation. In future work, we will focus on the end-to-end trainable model for Lidar-only 3D data to im-prove the efficiency of 3D object detection tasks.
Acknowledgement
This project was partially supported by the National Natu-ral Science Foundation of China (Grant No.61602485
and Grant No.61673375), the National Key
Re-search and Development Program of China (Grant
No.2016YFB1001005), and the Projects of Chinese
References
Chen, X.; Kundu, K.; Zhu, Y.; Berneshawi, A. G.; Ma, H.; Fidler, S.; and Urtasun, R. 2015. 3d object proposals for accurate object class detection. InNIPS, 424–432.
Chen, X.; Kundu, K.; Zhang, Z.; Ma, H.; Fidler, S.; and Urtasun, R. 2016. Monocular 3d object detection for au-tonomous driving. InCVPR, 2147–2156.
Chen, X.; Ma, H.; Wan, J.; Li, B.; and Xia, T. 2017. Multi-view 3d object detection network for autonomous driving. InCVPR, volume 1, 3.
C¸ ic¸ek, ¨O.; Abdulkadir, A.; Lienkamp, S. S.; Brox, T.; and Ronneberger, O. 2016. 3d u-net: Learning dense volumetric segmentation from sparse annotation. InMICCAI, 424–432. Springer.
Dorai, C., and Jain, A. K. 1997. Cosmos-a representation scheme for 3d free-form objects. PAMI19(10):1115–1130. Engelcke, M.; Rao, D.; Wang, D. Z.; Tong, C. H.; and Pos-ner, I. 2017. Vote3deep: Fast object detection in 3d point clouds using efficient convolutional neural networks. In
ICRA, 1355–1361. IEEE.
Fu, C.-Y.; Liu, W.; Ranga, A.; Tyagi, A.; and Berg, A. C. 2017. Dssd: Deconvolutional single shot detector. arXiv preprint arXiv:1701.06659.
Geiger, A.; Lenz, P.; and Urtasun, R. 2012. Are we ready for autonomous driving? the kitti vision benchmark suite. In
CVPR, 3354–3361. IEEE.
Girshick, R. 2015. Fast r-cnn. InICCV, 1440–1448. He, K.; Zhang, X.; Ren, S.; and Sun, J. 2016. Deep residual learning for image recognition. InCVPR, 770–778. Hu, J.; Shen, L.; and Sun, G. 2018. Squeeze-and-excitation networks. InCVPR.
Jain, A. K. 2010. Data clustering: 50 years beyond k-means.
Pattern recognition letters31(8):651–666.
Jiang, M.; Wu, Y.; and Lu, C. 2018. Pointsift: A sift-like network module for 3d point cloud semantic segmentation.
arXiv preprint arXiv:1807.00652.
Johnson, A. E., and Hebert, M. 1999. Using spin images for efficient object recognition in cluttered 3d scenes.PAMI
(5):433–449.
Ku, J.; Mozifian, M.; Lee, J.; Harakeh, A.; and Waslander, S. 2018. Joint 3d proposal generation and object detection from view aggregation. IROS.
Lahoud, J., and Ghanem, B. 2017. 2d-driven 3d object de-tection in rgb-d images. InICCV. IEEE.
Li, B.; Zhang, T.; and Xia, T. 2016. Vehicle detection from 3d lidar using fully convolutional network. InRobotics: Sci-ence and Systems.
Li, B. 2017. 3d fully convolutional network for vehicle detection in point cloud. InIROS, 1513–1518. IEEE. Lin, T.-Y.; Doll´ar, P.; Girshick, R. B.; He, K.; Hariharan, B.; and Belongie, S. J. 2017. Feature pyramid networks for object detection. InCVPR, volume 1, 4.
Liu, W.; Anguelov, D.; Erhan, D.; Szegedy, C.; Reed, S.; Fu, C.-Y.; and Berg, A. C. 2016. Ssd: Single shot multibox detector. InECCV, 21–37. Springer.
Maturana, D., and Scherer, S. 2015. Voxnet: A 3d convo-lutional neural network for real-time object recognition. In
IROS, 922–928. IEEE.
Mousavian, A.; Anguelov, D.; Flynn, J.; and Koˇseck´a, J. 2017. 3d bounding box estimation using deep learning and geometry. InCVPR, 5632–5640. IEEE.
Qi, C. R.; Su, H.; Mo, K.; and Guibas, L. J. 2017a. Pointnet: Deep learning on point sets for 3d classification and segmen-tation.CVPR1(2):4.
Qi, C. R.; Yi, L.; Su, H.; and Guibas, L. J. 2017b. Point-net++: Deep hierarchical feature learning on point sets in a metric space. InNIPS, 5099–5108.
Qi, C. R.; Liu, W.; Wu, C.; Su, H.; and Guibas, L. J. 2018. Frustum pointnets for 3d object detection from rgb-d data. InCVPR.
Redmon, J., and Farhadi, A. 2018. Yolov3: An incremental improvement. arXiv preprint arXiv:1804.02767.
Redmon, J.; Divvala, S.; Girshick, R.; and Farhadi, A. 2016. You only look once: Unified, real-time object detection. In
CVPR, 779–788.
Ren, Z., and Sudderth, E. B. 2016. Three-dimensional ob-ject detection and layout prediction using clouds of oriented gradients. InCVPR, 1525–1533.
Rubino, C.; Crocco, M.; and Del Bue, A. 2018. 3d ob-ject localisation from multi-view image detections. PAMI
40(6):1281–1294.
Rusu, R. B.; Blodow, N.; and Beetz, M. 2009. Fast point feature histograms (fpfh) for 3d registration. InICRA, 3212– 3217. Citeseer.
Song, S., and Xiao, J. 2016. Deep sliding shapes for amodal 3d object detection in rgb-d images. InCVPR, 808–816. Su, H.; Maji, S.; Kalogerakis, E.; and Learned-Miller, E. 2015. Multi-view convolutional neural networks for 3d shape recognition. InICCV, 945–953.
Wang, D. Z., and Posner, I. 2015. Voting for voting in on-line point cloud object detection. InRobotics: Science and Systems, volume 1.
Wang, Z.; Zhan, W.; and Tomizuka, M. 2017. Fusing bird view lidar point cloud and front view camera image for deep object detection.arXiv preprint arXiv:1711.06703.