80 3q
100 0 40 120
100
{Cenilmeters} 40 50 60
2b
[inches)
WATER AVAILABLE DURING GROWING SEASON
Furrow Intake Rates and Water Management
W. D. Kemper, B. J. Ruffing, J. A. Bondurant FELLOW
ASAE
ABSTRACT
F
URROW intake rates and their effects on the uni-formity of water distribution throughout the length of run are examined. Yields are substantially reduced by nonuniformities. Several treatments are discussed which can increase or decrease infiltration rates to improve uniformity.
Furrow compaction is suggested as a method of com-pensating for intake opportunity time differences result-ing from advance time requirements. Computations show that differentially compacting the furrow along the length of run could provide more uniform application and increase the length of run without increasing ero-sion. This reduces the farmer's investment in the irriga-tion system and the time and energy required for plan-ting, cultivating and irrigating.
INTRODUCTION
Recent and anticipated increases in energy costs are inducing irrigation farmers to evaluate and reduce the energy inputs in their operations. Such evaluations have shown that the energy required in sprinkler irrigation often exceeds the energy input into cultivation and haul-ing and seedhaul-ing operations by factors of from 4 to 8 (Skold, 1977). In the past, the farmer's labor bill has generally exceeded the cost paid for energy by a factor of 3 to 10. This has resulted in the adoption of labor saving systems such as center pivot irrigation systems which re-duced labor inputs at the cost of previously inexpensive energy. However, on many sprinkler irrigated farms, the costs of energy will soon be equal to, or perhaps exceed, the cost of labor. To keep their operations economically viable, many irrigation farmers will have to reduce their energy inputs. On many sprinkler irrigated farms, there is a potential for reducing energy inputs by converting to surface irrigation. Farms which were originally irrigated by gravity flow generally fall in this category.
Effects of Furrow Infiltration
Some of the most productive irrigated soils are highly erodible. Many farmers realize that fewer sets are re-quired if fields are longer, but the stream flows rere-quired to get water to the end of the longer runs within a small fraction of the total irrigation time also cause severe
fur-Article was submitted for publication in October 1980; reviewed and approved for publication by the Soil and Water Division of ASAE in August 1981,
Joint contribution from the USDA-ARS.
The authors are: W. D. KEMPER, Supervisory Soil Scientist; B. I. RUFFING, Agricultural Research Technician; and J. A. BONDURANT, Agricultural Engineer, Snake River Conservation Re-search Center, Kimberly, ID.
Acknowledgment: Appreciation is expressed to Truman Massee, Dennis Kincaid, and Robert Worstell who made substantial contribu-tions to this paper and the ideas therein.
row erosion at the upper ends of the fields. This move-ment of topsoil reduces the crop production on the upper ends of the fields without appreciable benefits at the lower ends and was soon recognized as a harmful pro-cess.
A commonly adopted solution to this problem has been to shorten the runs and proportionally reduce the flow rate required to advance water to the bottom end. Since erosion is about a fourth power function of furrow stream size, the reduction of flow rate greatly reduces erosion. However, it does have appreciable costs. More siphons or gates have to be set, increasing the irrigation labor and capital outlay. The area required for the extra ditches and associated tail water drains was removed completely from production, and in the 3 to 5 m of turn-ing area on each side of added ditches, production was often reduced to about 50 percent of that in the field in general. Additional costs accompanying shorter runs were a major factor in the decisions of many farmers to adopt less labor intensive sprinkle irrigation systems.
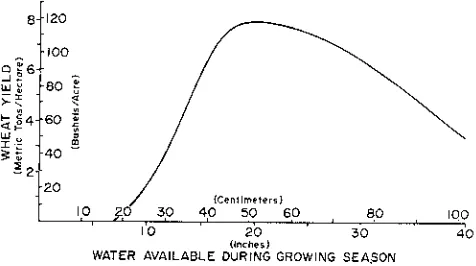
Another factor which led many farmers to change to sprinkle irrigation is that when water is applied slowly by a sprinkler, the infiltration rate is controlled by the distribution system and is no longer a function of the heterogeneous characteristics of the soil. As the switch back to surface irrigation is contemplated, the variability of furrow infiltration rates and its consequences on crop production must be considered. A typical crop produc-tion versus amount of water available curve (Fig. 1), in-dicates that under the climate and soil conditions en-countered, a maximum yield of about 8 tons/ha is ob-tained with about 50 cm of available water. From this curve it is obvious that yield will be reduced if infiltration into this field is heterogeneous, with some areas receiving less, and others receiving more than the optimum.
HETEROGENEITY OF INFILTRATION RATES
Extent and Causes
Texture variations are a cause of differences in infiltra-tion rates. However, when texturally heterogeneous soils
SA"JD? LOAM SANDY LOAM SILTY CLAY 70% SAND, 20% SILT. 601 SAND, 30% SILT, 16% SAND, 40% SILT,
FO% CLAY 10% CL AY 4 4% CLAY
(GREELEY) (AKRON} (GRAND JUNCTION)
WATER CONTENT AT T!ME OF COMPACTION (gm /cm3)
0,2 GI 0.2 0 0.1 0.2 0.30
CLAY LOAM 39% SAND, 29% SILT,
32% CLAY (FORT COLLINS)
0.2 0.3
001,1 ..112 Cy 6 LOAMY SAND
83% SAND, 10% SILT, 7% CLAY
:NUNN)
2
0 rr CT_
2
E 200
100
I0
0.1
0.01
[...00 I 50
40
30 20 0 0
1.8
1,6
1,4
1,2
are being irrigated with water carrying fine sediment, greater amounts of water enter the coarser textured areas carrying the fine sediment and tend to equalize the tex-ture.
Aggregate stability of the soils is another major factor affecting infiltraiton rates. Soils with large amounts of organic matter, iron oxides and clay contents generally have higher aggregate stabilities (Kemper and Koch, 1966). Appreciable quantities of sodium on the exchange complex can reduce the aggregate stability so the
in-dividual particles disperse from each other and after dry-ing or settling form a close packed, structureless mass
which has low permeability.
Another major factor affecting infiltration rates is compaction. Passage of loaded trucks carrying silage across a recently wetted sandy loam has been observed to reduce the infiltration rates from 15 to 0.3 cm/hr (Akram and Kemper, 1979). Doneen and Henderson (1953) found that tractors passing over soils two days after irrigation reduced infiltration rates to less than half the rates occurring when there had been no traffic in the furrow. Multiple passes further decreased infiltration rates. Akram and Kemper showed that wetting and dry-ing and freezdry-ing and thawdry-ing allow infiltration rates of the compacted soils to increase, but infiltration rates of these soils did not reach the values measured on soils where no compaction occurred.
TABLE 1. EFFECT OF TRACTOR WHEEL COMPACTION ON FURROW INFILTRATION RATES* IN FIELDS IN
THE TWIN FALLS, IDAHO AREA. Average infiltration rate, cm /h
Field no. Wheel row No compaction
Percent reduction of infiltration due to wheel compaction
1 1.14 1.30 12
2 0.46 0.64 28
3 0.71 0.97 26
4 0.69 1.07 36
5 0.20 0.43 53
6 0.15 0.58 '/4
7 0.27 0.48 44
8 0.51 0.97 47
9 0.27 1.35 80
10 0.69 1.07 36
11 0.20 0.33 39
12 0.64 0.99 35
13 0.41 1.91 79
14 0.38 0.48 21
15 0.43 0.91 53
Average 0.48 0.89 46
*Measured with small flumes on furrow section 100 mlong begin ning about 30 m from the top end of the field. Six consecutive furrows, which included two or three tractor wheel furrows, were measured. The numbers in this table were the average infiltration rates for the time period beginning when the water flow rates in the second flume were reasonably stable and continuing for about 1.5 hr. Rows were spaced 56 cm apart, and the rates are in cm31cm2 of
total field area per hour.
'-'•'. TT 1 1 r i•-1
' G
'..---•
•
...1111111111P"'
/T.. .
/
.
\\.../ ',.../
. . 1
COMPACTING LOAD n::1- I
0,43 kg / cmz o
.S
\\\..\ic
0.8 • ko/ cmz n .
1.73 kg /ern2 L .4 a
3.46 he ../ c.rn 0
Note: Legend Applies to
all Figures. _ .n..// .
- E .
- _
- . _ •
•
• ...P. Nit, /
Th
• :
/ \ ,
/
• - /
rC
[. 0---
---F • ro I- L 0
. ..
. • • • . I''---- ._-•
• • • • .,!,k• --r
_11...._____,.._n-• ...„...-.41.---* L''''''-„,,...._.__o_____„,,___.C,----b----C'
._,,, 4____._-..---- • .."---:
1 . , , 4.-L.--L-J- i i i , .11LLial ....,_,. •
0,4 0.8 1,2 0 06 0.8 0 0.4 0,8 0 0,4 043 0 0,4 0.e 1,2
WATER CONTENT AT TIME OF COMPACTION AS A FRACTION OF FIELD CAPACITY
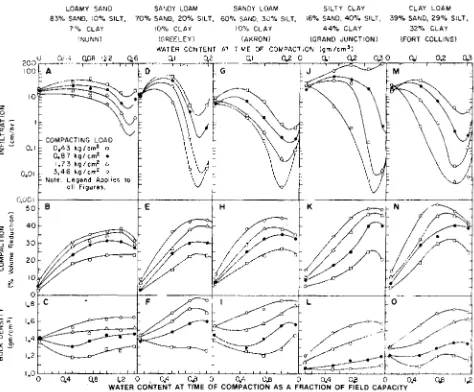
FIG. 2 Effects of compacting loads and water content at time of compaction on infiltration rate, compaction and bulk density, (Akram and Kemper, 1979).
1.00
S • .26 C.V. • .385
Mots from Fig.l Excluding Wheel Compaction Factor )
S . .39 C.V. • .57
.(Data from Fig I Including Wheel Compaction Factor )
.5 1.0 1.5
INFILTRATION RATE (Centimeters/Hour)
FIG. 3 Frequency distributions predicted from indicated standard deviations (or from coefficients of variance and the average) for the data in Table 1.
The effect of tractor wheel compaction on the infiltra-tion rates in furrows is indicated in Table 1. In fields 9 and 13, infiltration rates in the furrows compacted by the tractor wheels were 21 percent of those in the respective noncompacted rows. In fields 1 and 14, passage of the tractor wheels seems to have had little effect on subse-quent infiltration rates. A study of Fig. 2A, D, G, J, M (Akram and Kemper, 1979) indicates that the large reduction in compaction in the wheel rows in the field was probably a result of cultivation and associated trac-tor traffic (compacting pressure of about 1.7 kg/cm' or 170 kilo Pascals) when the soil was near field capacity. The fields where tractor wheel compaction reduced in-filtration less than 30 percent were probably cultivated when the soils were drier.
When soils are wetted rapidly, the side of the gregate wetted first expands before the rest of the ag-gregate has expanded. As this wetting plane moves across the aggregate, shearing forces at this plane disrupt most of the particle to particle bonds that hold the aggregates together. When soils are wetted slowly, the aggregate tends to absorb water and to swell as a unit so a smaller fraction of the bonds between particles are broken (Kemper et al., 1975). As water floods into a newly plowed or cultivated soil, many of the aggregates and clods are wetted from their whole perimeters, air is entrapped in their interior and is increasingly com-pressed until it breaks out through the weakened, moist soil and contributes to the disruption. The material from these disrupted aggregates slakes into a structureless mass and upon drying develops dense, impermeable crusts. For these and related reasons, the soil in the bot-tom of the furrow will have a lower permeability than the soil which is on the side of the furrow above the free water level.
The wetted perimeter of furrows can change appreci-ably from the top to the bottom end of the field, or throughout the season. This latter change is generally a result of differences in furrow roughness. When the fur-row is rough, the velocity of the flow is retarded and generally the depth of water in the furrow will increase. This is commonly observed as grass or other vegetation begins to grow on the bottom of a furrow, increasing the roughness coefficient, the depth of water, and the wetted perimeter, and consequently increasing the infiltration rates per unit length of furrow (Marsh et al., 1952).
Immediately after cultivation, the open structure of the soil allows rapid infiltration of water. Later when the aggregates on the perimeter of the furrow have disinte-grated, the infiltration rate is only a fraction of what it was during the initial stages of the first irrigation. These changes in infiltration rates, often of the order of 2 to 4, are a particular problem in trying to optimize the unifor-mity of water distribution down a furrow and prevent leaching of nitrates from excessive water application.
Production Losses Due to Heterogeneity
The analyses of variance of the infiltration rate data from which the averages in Table 1 are derived are presented in Table 2. They indicate that about 52 per-cent of the observed variance was associated with dif-ferences between fields. Of the variance within fields, 57 percent is associated with tractor wheel compaction fac-tor. Consequently, it is estimated that if water were run only in compacted furrows, or only in uncompacted
fur-TABLE 2. ANALYSIS OF VARIANCE OF INFILTRATION RATES AS AFFECTED BY FIELDS AND TRACTOR WHEEL COMPACTION.
Source Degrees Sum of Mean Probability of of variance of freedom squares square significance Between fields 14 2.48 0.177 0.95
Compaction 1 1.32 1.32 0.999
Within field 14 1.01 0.72
Total 29 4.81
rows, the variance would be reduced to 43 percent of the value that was measured within these fields. This would reduce the coefficient of variation from 0.57 to 0.39.
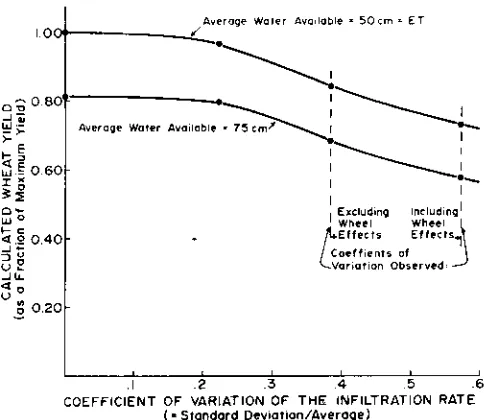
The effect of such a reduction in the coefficient of variation of infiltration rates on crop yields may be estimated (Snedecor, 1950, pp. 178-180) by constructing the frequency distribution curves which these coefficients of variance predict as is done in Fig. 3. Yield vs. available water curves of the type given in Fig. 1 may then be used with the curves in Fig. 3 to calculate the yields that will be obtained when a given average amount of irrigation is applied and the seasonal infiltration rates have the coefficients of variation indicated in the measured individual irrigations.
The fraction F, of the infiltration rates which fall within a given range AR, is then multiplied by the yield Y, expected when available water is in that range to ob-tain the yield contribution AY of that range. That is
LY Fi Yi [1]
The average yield, Y, in a field which has this distribu-tion of infiltradistribu-tion rates should be
FiYi
Y ° EFi yi [2]
EF
Average Wa ler Available • 50 cm = ET
Average Water Available • 75 cm ,
Excluding wheel LEffects Coef f lents of Variation Observed.
• --.
including Wheel Effects
Note that, even though the yields in Fig. 1 do not fall off as fast with overirrigation as with underirrigation, the average yields indicated in Fig. 4 are substantially re-duced when available water is raised by irrigation to pro-vide total available water equal to 150 percent of ET. Realizing that the farmers' net profits are often only about 25 percent of the gross, it is apparent from Fig. 4 that large heterogeneity of infiltration rates can degrade an otherwise profitable farm operation into a losing pro-position.
Methods for Reducing Heterogeneity
From the analysis of variance shown in Table 2, it is apparent that more than half of the heterogeneity can be avoided if the farmer will always irrigate either in the tractor wheel row or the non-wheel rows. This is possible if the tractor wheels have compacted the alternate rows and every other row is irrigated.
The presence of sodium in the exchange complex of the soils is a self-aggravating problem. If there is appre-ciable sodium on the exchange complex, the aggregates will tend to disperse, the saturated permeability will decrease and the permeability at suctions from 100 to 300 cm of water generally increases. Consequently, less of the salt will be removed from these sections during ir-rigation and more will be brought near the surface when the hydraulic gradient is moving water upward and the water table is reasonably near the surface. This salt com-monly has substantial amounts of sodium in it and the problem intensifies. Removal of the sodium from ex-change positions on the soil mineral requires replace-ment by another ion such as calcium and sufficient extra water percolating down through the profile to remove the sodium from the system. Bringing the permeability of the soil up to levels equal or greater than that of surrounding soils can often be accmplished by the incorporation of large amounts of organic matter and leaching the sodic spot. Crops with extensive root systems, such as wheat grass (Robinson et al., 1965) appear to be able to ag-gregate slightly sodic soils and bring about greater uniformity of infiltration rates.
.1 .2 .3 .4 .5 .6
COEFFICIENT OF 'VARIATION OF THE INFILTRATION RATE (• Standard Deviation/Average)
FIG. 4 Effect of Infiltration rate variation and of water available on yield when the yield vs. available water curve is that shown in Fig. I.
Subsoils commonly have lower permeability than top-soils because their organic matter content is lower, When the topsoil has been removed as a result of erosion or land leveling, infiltration rates in those areas are general-ly lower. Some farmers have used the fact that infiltra-tion in the tractor wheel rows is generally lower than in the uncompacted furrows to help compensate for changes in infiltration rate caused by removal of topsoil. When they are irrigating every other furrow and the fur-rows are in the area which has topsoil, they allow the water to run in the compacted wheel row. Where the furrow runs through areas from which the topsoil has been removed, they cut the water over into the nonwheel furrow, thereby increasing the infiltration and achieving more uniform irrigation.
Crop residue, even in small amounts, has been ob-served (Aarstad and Miller, 1980) to appreciably in-crease the resistance to flow and the level of water in a furrow. Applying straw in furrows increased infiltration rates about 50 percent when only 360 kg/ha (320 lb/acre) of straw was applied. Surprisingly, practically none of the straw was washed out of the furrow. This pro-vides a reasonably priced tool for increasing the infiltra-tion rates at specific zones along the furrows where the permeability of the soil is lower than in the rest of the field.
INTAKE OPPORTUNITY TIME
Reasons for Variation
One of the most obvious factors affecting total water intake is the intake opportunity time. Furrow irrigation generally involves supplying water at the high end of a furrow and gravity induces flow to the bottom end. Con-sequently, the intake opportunity time begins sooner at the upper end of the furrow. When flow of water at the upper end is stopped, furrow outflow soon stops so that intake opportunity time at the lower end of the furrows is often considerably less than that at the top of the field.
Natural Compensating Factors
There are naturally occurring factors which tend to compensate for this difference in intake opportunity time. When water is coming from a cool source and warms as it travels down the furrow, its viscosity decreases and infiltration rate increases. The fluidity of
water which is the inverse of viscosity and is proportional to its rate of infiltration is plotted as a function of temperature in Fig. 5. The temperature of the water in furrows has been observed to increase (Fig. 6) from 14 °C at the top of the furrow to 20 °C at the bottom of a furrow during the middle of a day in late August near Twin Falls, ID. This should increase infiltration by about 17 percent, and if it were prolonged would com-pensate for an intake opportunity time at the bottom end of the furrow which was 85 percent of that at the top. Larger and smaller changes in viscosity are probably en-countered. During the night the water may, in some cases, cool as it proceeds down the furrow. A diurnal fluctuation of water temperature in the furrows has been observed ranging from 15 °C in the early morning hours to over 23 °C in the early afternoon. Such changes in temperature are probably a major factor in the "backing up" phenomenon noted by many farmers who carefully set their flow in the early morning so that water is reaching the ends of the furrow and return later in the
0.60
w▪r
• 0.60 2
°
.9 0.40
—J
a • 0.20
7
11.1
• 10
100 LL j
v80
a
w 51_ 60 _14150
20 18 16 14
12
In lower end of furrow
•
Supply from ditch
140
Y
a 120
›-1– 17)
t) ▪ 100
•
80 O 7 4_
0 10 20 30
TEMPERATURE (°C)
FIG. 5 Effect of temperature on the fluidity of water.
day to find it is traversing only about 80 percent of the furrow. An example of this is given in Fig. 6. The rate of intake of the water increased as the day progressed as would be expected from the measured temperature in-creases.
Greater infiltration at the lower ends of the fields often occurs as a result of long term furrow erosion. Larger stream flows at the upper end of the field erode soil from the furrow. As this water proceeds to the end of the fur-row, half or more of the water generally infiltrates into the soil. Since the ability of the water to carry this eroded sediment is about a fourth power function of its flow rate, most of the sediment is redeposited in the lower reaches of the furrow. The portion settling out is in-creased if water at the lower end of the field is ponded reducing its velocity to a low value. The long term result of this erosion-deposition process is removal of most of the topsoil from the upper end of the field and its deposi-tion at the lower end. This topsoil generally has a higher organic matter content, better aggregate stability and higher infiltration rates. Farmers farming such fields often observe that the wetting fronts from adjacent fur-rows meet at the lower end of the fields before they meet at the upper. This observation indicates that the greater intake rates at the lower ends of the fields, compared to the tops, are more than compensating for the lower in-take opportunity times at the bottom.
Since infiltration rates generally decrease as water con-tents increase, the ratio of infiltration at the top divided by infiltration at the bottom end of a furrow will be less than the ratio of the respective intake opportunity times.
Potential Management Factors for Compensation The use of small amounts of straw in the lower ends of furrows which can increase infiltration rates by 50 per-cent or more (Aarstad and Miller, 1980) can compensate for normal differences in intake opportunity time.
In the course of grading land for irrigation, it is often possible to decrease the slope at the lower ends of the fields. This causes water levels in the furrows to be higher. The wetted perimeter and infiltration rate conse-quently increase at the lower end, tending to compensate for the lower intake opportunity time.
The data in Table 1 and past findings (Doneen and Henderson, 1953; Akram and Kemper, 1979) indicate
2.02
n
Fluidity
Intake
°8AM 10 12 NOON TIME OF DAY
FIG. 6 Water temperature and intake rates.
that compaction can be used as a management tool to compensate for different intake opportunity times.
Several equations have been developed (Bishop, 1962; Christiansen et al., 1966; Davis, 1961; Smerdon and Hohn, 1961) for rate of water advance in furrows to pro-vide estimates of intake opportunity time. These equa-tions depend on the shape of the intake rate with time curve.
On Portneuf silty loam, which constitutes the majority of the irrigated soil in the Twin Falls area, the high initial intake rate in furrows drops down toward a steady rate, following a curve that is approximated by the equation
b
R
At + c + K [3]
where R is the intake rate in cmVcm furrow length per h, which when divided by the furrow spacing gives the average intake in cm/h over the area irrigated, At is the intake opportunity time (h), K is the final steady state intake rate cm 3/cm h and K b/c is the initial rate. The coefficients b and c are functions of the soil characteristics. The intake I in cm3/cm of furrow can be found by integrating equation [3] with respect to time, i.e.
t At +c
I =
f
Rdt b in + KAt s 141ti
of a large amount of data collected at this location on *Equations [3] and [4] are empirical approximationsL
furrow infiltration. They are somewhat similar to Philip's (1957) equation, I = St" + At, for one dimensional in-filtration but fit furrow inin-filtration data from this loca-tion better where I becomes practically a linear funcloca-tion of time when t 7 3 hiwhere t i and t are the times at which [the water comes in contact with the soil and at which the
evaluation of I is made, i.e., At = t — t ,. Values of b
60
0
ft ft 100
ce UJ
g
tu 50 x re F LL
fpx
z W
1.5
1.0
v,) h
and c that fit the intake cury s to the average data points - 1
Portneuf soil were 0.42 and 0.0 cm3 /cmof furrow)
Q0 Kx t
for Q,,
respectively. The term b In [(At + c)/c] in equation [4] represents the integrated "extra initial intake," most of which takes place in the first few hours of intake oppor-tunity time.
Calculating this term (i.e. L = b In [(At + c)/c] for these values of b and c and at times of 1, 2, 5, 12 and 24 h, the extra initial intake would be 0.64, 0.74, 1.01, 1.21 and 1.37 cm respectively on furrows spaced 56 cm apart. Since most of the extra initial intake takes place within the first 2 h, a reasonable approximation, which simplifies development of an equation, describing flow along a furrow is that this extra initial infiltration occurs when the furrow fills and that it can be added to the cross sectional area of flow component A, to give a total furrow filling requirement, F, of
[10]
which gives the time t (hours) at which the furrow will be
wet to the distance x (meters) when rearranged as
follows:
F Q0
t - 1n
K Q0 - Kx
Second, assume that the base intake rate K is not a constant but increases with distance from the top end of the furrow in an exponential manner, such as
K ge ax [12]
F = A +1i L5]
For a flow cross section 10 cm wide and 2 cm deep and furrows on 56 cm centers, A would be 10 X 2/56 = 0,36 cm. Thus the "total furrow filling requirement" for a 24-h application will be 1.73 cm. This indicates that most of the 8 to 10 cm of water applied in such an irriga-tion is from the steady state component, Kit.
The data in Table 1 and Fig. 2 indicate that different compacting pressures at water contents commonly occur-ring duoccur-ring cultivation can cause infiltration rates to change by factors of two or greater. Assuming that a machine can be constructed to compact furrows with the pressures and resulting infiltration rates desired by the operator, the effects of such variation in infiltration rates on furrow intake as a function of distance along the fur-row can be calculated from the following equations.
First, to make calculations of furrow advance rate on a soil with an infiltration rate R of the type indicated by equation [3], where K is a constant with distance down the furrow, assume an abrupt wetting front behind which the furrow is full and the extra initial intake has occurred and ahead of which the soil is dry. Then
Q0= Kx QX [6]
where Q,, is the rate of inflow to the furrow, K is the rate of intake per unit length of the furrow, x is the distance from the inlet of the furrow to the wetting front and Q, is the rate of flow past the point x. The rate at which the wetting front is progressing down the furrow is
cixicit Ch/F [7]
where F is the total furrow filling requirement defined in equation [5]. Combining equations [6] and [71
dx/dt = (Q0 - Kx)/F [8]
separating variables
integrating both sides from when t and x are both equal to zero to any time t,
where g is the intake rate at the top end of the furrow, x is distance in meters along the furrow and a is a coeffi-cient, constant for the field. Then the average intake rate times the wetted distance
Kx = f geax dx =1-(eax -1) [13]
a
Substituting K for K in equation [6] and combining the resulting equation with equation [131 yields
Q0 g _ 1) + Qx [14]
a
Using equation [14] to substitute for Q„ in equation [7],
dx[ a g
dt = Q-n - -1)]JF [15]
Separate variables,
dx dt
[16]
Qo g g
a a
From Dwight's (1969) Table of Integrals ( No. 569.1), in-tegration of equation [16] from x = 0 and t = 0 to any specified value of x, yield
t =-
Q0 a+g [ax + in
C2 0 F
Qo —(1 eg ax )
a
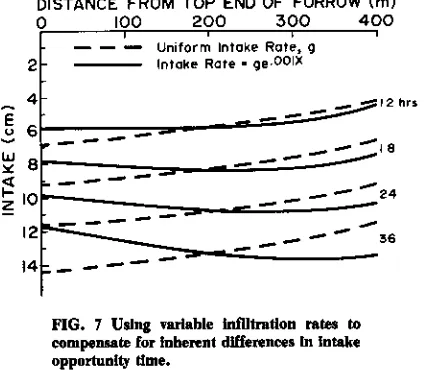
To estimate how effectively the difference in intake op-portunity time could be compensated for by adjusting in-take rates so they increase exponentially with distance from the supply ditch, equations [11] and [17] were used to calculate the total intakes shown in Fig. 7.
In both cases it was assumed that the total furrow fill-ing requirement F was 9.69 X 10 m3 /m and that water is supplied to the furrow at a rate Q of 1.136 m3/h. For the case of constant intake rate (equation [11]) the rate K was assumed to be 2.36 X 10⁻³ m3 /m-h = (0.42 cm/h). For equation [17] the intake rate was assumed to be K = ge— where g = 1.9 X 10- 3m3 1m-h, a = 0.001 and K
dx dt
Q0 - Kx [9]
[17]
DISTANCE FROM TOP END OF FURROW (m) 0 100 200 300 400
— Uniform Intake Rate, g Intake Rate • ge•00IX
FIG. 7 Using variable infiltration rates to compensate for inherent differences In intake opportunity time.
= 1) g/ax, which when X = L = 400 m, gives K =
2.33 X 10- 3 m 3/m-h.
Comparison of the curves in Fig. 7 at 18 h when the
intakes averaged about 8 cm indicates that the variation in intake due to differences in intake opportunity time can be reduced from 2.65 cm to 0.88 cm.
Reducing intake rate of the soil to values slightly less than the exponential function in the middle range of the furrow would further reduce the variation. However, consideration of Figs. 1 and 2 indicates that the 10 percent variation remaining is less than other variations in intake which occur randomly in farmers' fields.
This treatment provides evidence that compaction can reduce intake rates sufficiently to compensate for differences in intake opportunity time and thereby achieve more uniform intake rates. However, there is also substantial evidence that the initial assumption of uniform intake rates is not justified on many (and
perhaps most) fields.
INFORMATION NEEDED TO MANAGE INFILTRATION
Intake uniformity can be improved to increase yields by at least two approaches. Tillage treatments that disrupt soil layers with low permeability increases intake uniformity. However, tractor traffic after such cultiva-tion causes compaccultiva-tion and reduces intake rates, par-ticularly if that cultivation occurs when the soil is moist. The possibilities for maintaing more uniform infiltra-tion rates by restricting tractor traffic to tracks that do not coincide with the furrows in which irrigation water runs should be investigated.
Another possibility for achieving more uniform intake rate is to compact corrugates in which the water will run so that the soil on the perimeter of these corrugates has an infiltration rate as low or lower than that in the rest of the soil. Compaction and reducing infiltration rates have generally been looked upon as practices to be avoided. However if the compacted zone is limited, leaving ade-quate uncompacted soil for the roots, it may be possible to compact such small corrugates without reducing yields. This possibility should be investigated.
Reduced infiltration rates require smaller streams of water run in the furrow for longer periods of time. This may have disadvantages in terms of reducing the time when equipment can be taken into the field for cultiva-tion or spraying. Compaccultiva-tion and reduced flow rate have
some potential advantages which should be evaluated: 1 Reduced erosion which accompanies smaller flow rates.
2 Longer runs with the same flow rates which reduces labor costs on nonautomated systems, reduces land used by ditches, reduces equipment turning and thereby decreases cultivation time and damage to crops; or with piped distribution systems, reduces the cost of pipe since the length of pipe needed is inversely propor-tional to the length of the furrows.
3 Reduced pipe size for distribution since the pipe is used for a longer time to distribute the same amount of water.
4 Intake rate during the first irrigation after cultiva-tion can be brought down to near that which will occur during subsequent irrigations and may thereby enable stream flow of the same size (from constant sized orifices) to be used in all irrigations.
Some - farmers are already complaining of low intake rates which raises questions concerning a management procedure which would involve reduction of intake rates. Intake rates in such "problem areas" go down as low as 0.1 cm/h,* or 2.4 cm/day. However, this is still about three times the rate of evapotranspiration encountered. Consequently, the lowest intake rates observed to date are still sufficient to meet the needs of crops. Studies are needed to determine whether having water in corrugates on such soils for 2 or 3 days per week causes inadequate aeration of the plant roots and reduced yields. If such yield reductions do not occur, the problem to be solved on such soils is how to get water into the furrows in the small regulated amounts and for the extended times needed. To gain farmer acceptance, the distribution system must also have a reasonable cost and low labor re-quirement.
In general, there appears to be significant potential for improving surface distribution of water by modifying the intake rates of soils. Present design, criteria for irrigation systems generally assume that intake rates are an dependent rather than a manageable factor. Data in-dicate that infiltration rates can generally be reduced by compaction to the levels desired. To some extent, farmers are already reducing intake rates and surface roughness of furrows by using "furrow slickers," ir-rigating in tractor wheel rows, etc. However, there ap-pears to be a major potential for improving the engineer-ing of irrigation systems if water intake by the soil can be changed to what is needed. Management of intake rates will require equipment and guidelines to achieve the desired compaction and means of measuring the result-ing rates of intake.
References
1 Aarstad and Miller, 1980. Effects of small amounts of residue on furrow irrigation. Soil Sci. Soc. Am, J. 45(1):116-118.
2 Akram, Mohd and W. D. Kemper. 1979. Infiltration of soils as affected by the pressure and water content at the time of compaction. Soil Sci. Soc. Am. J. 43:1080-86.
3 Bishop, A. A. 1962. Relation of intake rate to length of run in surface irrigation. Trans. ASCE 127, Part III.
Furrow Intake Rates
(continued from page 339)
water in surface irrigation. TRANSACTIONS of the ASAE 9(5):671-674.
5 Davis, J. R. 1961. Estimating rate of advance for irrigation fur-rows. TRANSACTIONS of the ASAE 4(1):52-54, 57.
6 Doneen, L. D. and D. W. Henderson. 1953. Compaction of ir-rigated soils by tractors. AGRIC. ENG. 34(1):94-102.
7 Dwight, H. B. 1969. Tables of Integrals and Other Mathe-matical Data. The Macmillan Company, New York.
8 Kemper, W. D. and E. I. Koch. 1966. Aggregate stability of soils from western United States and Canada. USDA Tech. Bull. No. 1355.
9 Kemper, W. D., J. S. Olsen and Alan Hodgdon. 1975.
Irriga-tion method as a determinant of large pore persistence and crust strength of cultivated soils. Soil Sci. Soc. Am. Proc. 39:519-523.
10 Marsh, A. W., L. R. Swarner, F. M. Tileston, C. A. Bower and
E. N. Hoffman. 1952. Irrigation management investigations of non saline soils: Owyhee Irrigation Project. Oregon State College Tech. Bull. No. 23.
11 Philip, I. R. 1957. Theory of infiltration. Soil Sci. 84(3):257-264.
12 Robinson, C. W., W. D. Kemper, H. M. Golus, G. Schumaker and W. 3. Pugh. 1965. Requirements for achieving and maintaining uniformly low salt in a saline soil. Soil Sci. Soc. Am. Proc. 29:597-601. 13 Skold, M. D. 1977. Farmer adjustments to higher energy prices: The case of the pump irrigator. USDA Econ. Res. Serv. Bull. No. 663. 14 Smerdon, E. T. and C. M. Rohn. 1961. Relationships between the rate of advance and intake rate in furrow irrigation. Texas Agric. Exp. Stn. Misc. Publ. MP-509, April.
15 Snedecor, G. W. 1950. Statistical Methods. Iowa State College Press, Ames.