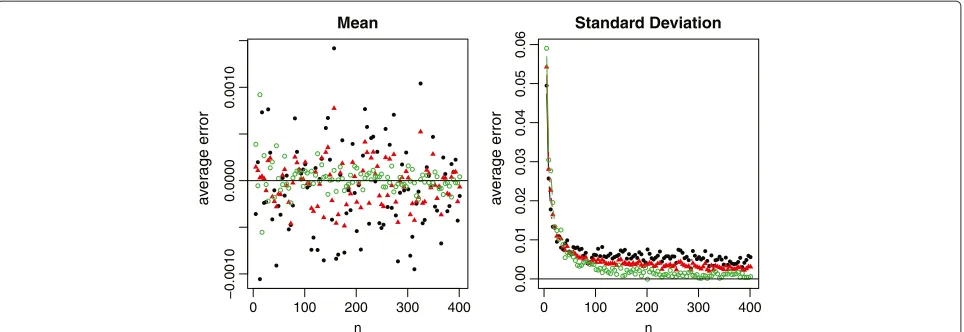
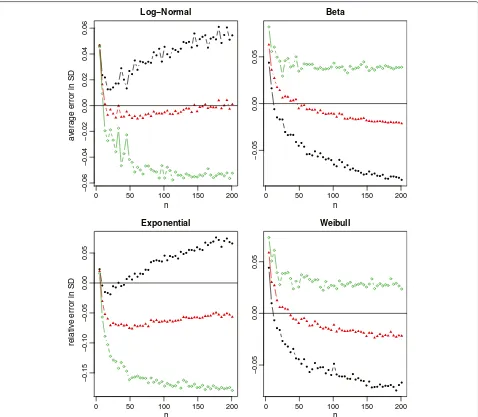
Estimating the sample mean and standard deviation from the sample size, median, range and/or interquartile range
Full text
Figure


Related documents
But when the sample size is large the population of all possible sample proportions has approximately normal distribution, with mean ( ˆp ) equals P, and standard deviation ( ˆp
a) Compute the variance of the average number of passengers searched (¯ z j ) per day during the first eight months. Looking at this ratio and considering the fact that the number
Ever compute the standard deviations from one of data points, finding standard deviation tells about the steps to sample. Assumption of the population, we are rounded
FURTHER RESOLVED, That the Coordinating Board instructs the Director of the Arkansas Department of Higher Education to notify the administration of Vincennes University,
(a) What sample size would be needed to estimate the mean from a population with standard deviation of 100 with a maximum error of 5 with 95% confidence.. (b) What sample size from
The screening incidence can be used as a measure of the extent of screening in a defined target group, and the ratio defined above can be used as a measure of the appropriateness
As the sample size n increases, the shape of the distribution of the sample means taken with replacement from a population with mean and standard deviation will approach
Since population standard deviation is not given and we have the sample data to calculate the sample standard deviation, we can construct a t-confidence interval for estimating
