R E G U L A R A R T I C L E
Blood lead levels of contemporary Japanese children
Jun Yoshinaga•Mai Takagi•Kumiko Yamasaki• Sayaka Tamiya•Chiho Watanabe•
Masayuki Kaji
Received: 20 January 2011 / Accepted: 4 April 2011 / Published online: 23 April 2011
ÓThe Japanese Society for Hygiene 2011
Abstract
Objectives Lead concentrations in whole blood (BPb) of Japanese children were measured to obtain insight into the sources of variation and to estimate health risk.
Methods Blood samples were taken from 352 children (aged 1–14 years) at pediatric clinics/hospitals in 3 regions of Japan (Tokyo, Shizuoka, and Osaka) during 2005–2006 (Shizuoka only) and 2008–2010 (3 regions), and BPb was measured by inductively coupled plasma mass spectrome-try after acid digestion.
Results Geometric mean BPb of the 352 children was 1.07lg/dL, among the lowest in the world. Based on this result, the probability of exceeding BPb 10lg/dL, the action level proposed by the US Centers for Disease Control and Prevention, in general Japanese children was estimated to be negligible. There was a significant negative correlation between BPb and age, while sex difference was not significant. BPb was significantly lower in subjects in Tokyo than in the other two regions. Age-adjusted mean BPb was significantly higher in children with a family member who smoked in their presence than in those who did not have such a family member, indicating that passive smoking had a significant effect on BPb.
Conclusions Health risk of lead exposure is minimal in Japanese children. To lower the exposure level further, reduction of passive smoking is suggested as one of the effective measures.
Keywords BloodLeadChildrenVariation Passive smoking
Introduction
Lead (Pb) is a well-known neurotoxicant. A number of epidemiologic studies done since the 1980s have revealed that Pb impairs normal development of cognitive functions of children [1]. Exposure to Pb has been related to lower intelligence quotient (IQ) [2], poor academic achievement [3], and delinquent behavior [4]. Moreover, concern has recently been raised that adverse effects are seen at expo-sure levels lower than were considered safe in the past [5,6]. Schwartz [7] and Lanphear et al. [8] suggested that there is no threshold for Pb exposure below which no adverse effect on cognitive development was observed.
Lead concentration in whole blood (BPb) has long been considered a reliable indicator of relatively short-term (approximately 1 month [1]) exposure to Pb, and it was measured to represent exposure level in most of the pre-vious epidemiologic studies on Pb and cognitive functions of children. BPb has also been measured routinely for biomonitoring of Pb exposure of children in many countries.
However, in Japan, BPb in children has not been extensively measured. To the best of our knowledge, there are only two reports on children’s blood, taken in Shizuoka in 1993 and in 2004–2005 [9–11]. This scarcity of data may be related to the notion that Japan has been one of the J. Yoshinaga (&)M. TakagiK. YamasakiS. Tamiya
Department of Environmental Studies, University of Tokyo, Kashiwanoha 5-1-5, Kashiwa, Chiba 270-8563, Japan e-mail: junyosh@k.u-tokyo.ac.jp
C. Watanabe
Department of Human Ecology,
School of International Health, University of Tokyo, Hongo 7-3-1, Bunkyo, Tokyo 113-0033, Japan
M. Kaji
least Pb-contaminated countries in the world, because early phase-out of leaded gasoline was achieved by the mid-1980s and it is not the custom to paint residences; resi-dential paint used in some countries in the past was Pb based and a well-known source of Pb poisoning [12] and elevated BPb [13] of children in such countries. In agree-ment with this assumption, BPb data obtained in Shizuoka (mean 3.16 and 1.55lg/dL in 1993 and 2004–2005, respectively) demonstrated lower BPb than in other countries.
However, since no threshold for cognitive effects has been postulated, BPb should be monitored in Japan more extensively, even though BPb levels of Japanese children are expected to be low. In this paper we report BPb of Japanese children. Variation due to physiological (age and sex) and regional factors and passive smoking status were examined. Information on the source of variation may be helpful in identifying the source of exposure to Pb in Japanese children.
Materials and methods
Collaborating pediatricians
Eight pediatricians from 3 regions of Japan (Tokyo, Shi-zuoka, and Osaka) in addition to one of the authors of this study (M.K.) collaborated in blood sampling. There were six collaborating pediatricians in Tokyo from one general hospital and five pediatric clinics, two in Shizuoka (including M.K.) from one general hospital, and one in Osaka from a general hospital.
Contamination check
Since BPb of Japanese children was expected to be low, any Pb contamination derived from blood sampling and storage can be critical. Contamination levels of stainless-steel needles, syringes, and blood collection tubes were examined prior to blood sampling.
The water used in this study was purified using a Mil-liporeRElix/Academic A10 system. Purified water taken in polypropylene (PP) tube, which had been cleaned of Pb contamination by soaking in 6 mol/L nitric acid for 1 week followed by vigorous rinsing with purified water, was drawn with stainless-steel needle and syringe, and the aspirated water was taken in another cleaned PP tube. The needles and syringes were from two manufacturers and were used in the collaborating clinics/hospitals. Concen-tration of Pb in the water was measured by inductively coupled plasma mass spectrometry (ICPMS, Agilent 7500ce; Agilent Technologies Japan Ltd., Tokyo) as described below.
Three types of blood collection tube were tested for Pb contamination. The tubes were from two manufacturers: two of the three tubes had anticoagulants [ethylenediamine tetraacetic acid (EDTA) 2 K and heparin Na], and one did not have anticoagulant. Into eight to nine tubes of each type was added 2 mL purified water, followed by gentle agita-tion and standing for 30 min at room temperature. Then, Pb concentration in the water was measured by ICPMS. The tube with acceptable Pb contamination was selected and distributed to the collaborating pediatricians.
Blood sampling
Blood sampling by collaborating pediatricians was carried out in two separate periods: one in 2005–2006 in Shizuoka only, and the other in 2008–2010 in Shizuoka, Tokyo, and Osaka regions. The purpose and procedure of this study were explained to the child’s caretaker by the collaborating pediatrician. Children aged 1 year and older, and whose caretaker voluntarily agreed to participation and gave written consent, were the subjects of this study. Blood was sampled from the subject child by the collaborating pedi-atrician at the time of blood sampling for diagnosis and other routine examination. The diagnoses of most of the sick subject children included acute infectious diseases, such as upper respiratory diseases. Apparently healthy children who underwent blood sampling for allergy testing were another major group of subjects. In total, 352 children donated blood sample for this study: 161 from Tokyo, 34 from Osaka, and 187 from Shizuoka.
After sampling, blood in the collection tube was immediately frozen and sent to University of Tokyo for Pb analysis. Information on passive smoking of children was obtained from the caretaker by a brief questionnaire at the time of blood sampling. The caretaker was asked if there was smoking person(s) in their home. If yes, the caretaker was further asked whether the smoking family mem-ber(s) smoked in the presence of the child. This informa-tion, as well as the age and sex of the subject children, were analyzed in relation to BPb concentration.
Blood Pb analysis
of 1 ng/g. All operations were done under a compact clean booth supplied with high-efficiency particulate air (HEPA)-filtered air. All of the PP tubes and PTFE vessels were soaked in 6 mol/L nitric acid for at least 1 week before use. Lead concentration was measured by internal standard-ization. Working standard solution, prepared from com-mercial multi-element standard solution (SPEX XSTC-622, USA), contained 1 ng/g Pb and 0.3 mol/L nitric acid. The operational conditions for ICPMS were as follows: radiofrequency (RF) power 1.5 kW, plasma gas flow rate 12 L/min, carrier gas flow rate 0.84 L/min, make-up gas flow rate 0.45 L/min, monitoredm/z206, 207, and 208 for Pb and 205 for Tl, and integration time 0.3 s for eachm/z. Analytical quality control
Each batch of blood digestion was composed of one pro-cedural blank, one whole blood reference material (RM, SeronormTM Trace Elements Whole Blood L-1; Sero, Norway), and 5–15 samples from subject children. The analytical result of RM was checked, and when significant deviation from the reference range was found, remeasure-ment was undertaken.
Statistical analysis
Lead concentration in whole blood had a skewed distri-bution. Since the distribution of log-transformed values was regarded as normal (Kolmogorov–Smirnov test), log-transformed values were used in statistical analyses.t-Test, one-way analysis of variance (ANOVA) with Scheffe´’s multiple-comparison procedure, Pearson correlation anal-ysis, and analysis of covariance (ANCOVA) were carried out by using the SPSS statistical package (version 12.0J) for PC.
The probability of exceeding a certain, prefixed BPb level [e.g., the US Centers for Disease Control and Pre-vention (CDC) action level] was estimated by generating 100,000 random hypothetical BPb values according to the observed BPb distribution in this study and counting the number of trials that exceeded the prefixed BPb level using Crystal Ball (Decisioneering Inc., USA), which was similar to the method employed by Kobayashi and Yoshida [11].
This study was approved by the Ethical Committee of the University of Tokyo and collaborating clinics/hospitals.
Results
The Pb contamination level of the three blood collection tubes tested was 0.01, 0.05, and 0.6 ng/tube. We selected the tube with 0.05 ng/tube contamination for this study because the tube with the lowest value (0.01 ng/tube) did
not contain anticoagulant: blood clotting was considered problematic for taking aliquots of homogeneous, repre-sentative subsamples from each tube for digestion. Possible Pb contamination from stainless-steel needles and/or syringes for blood sampling was detected to be 0.006 ng. Therefore, the total Pb contamination during blood sampling and storage was expected to be 0.056 ng.
During the course of BPb analysis of 352 samples, 24 subsamples of RM were analyzed, and the mean and standard deviation of Pb concentration was 2.61 ± 0.09lg/dL. This RM (SeronormTMTrace Elements Whole Blood L-1) has two reference values: 2.76 lg/dL (range 2.62–2.90lg/dL) determined by inductively coupled plasma (ICP)-sector field MS and 2.1lg/dL (1.7–2.5lg/dL) by graphite furnace atomic absorption spectrometry (GFAAS), and our average value (2.61lg/dL) was inter-mediate between these two ranges. In addition, the coeffi-cient of variation of our analyses was as small as 3.4%, demonstrating good reproducibility of analysis. These results for RM demonstrated the accuracy of our blood Pb analysis. Procedural blanks rarely exceeded the limit of detection of our ICPMS measurement (0.0001 ng/g or 0.003 ng).
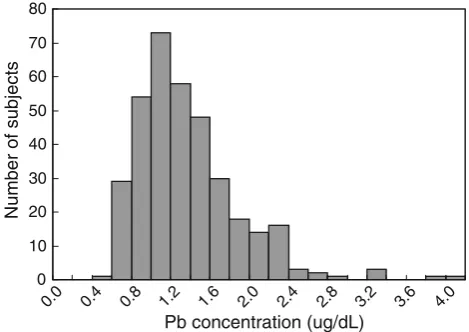
Figure1 shows a histogram of the BPb values for 352 subject children (184 boys, 167 girls, 1 unknown) deter-mined in this study. As seen from this histogram, the distribution was skewed toward higher values, indicating log-normal distribution. Geometric mean (GM) BPb con-centrations are reported in Table1.
Based on the observed distribution of BPb shown in Fig.1, Monte Carlo simulation revealed that the number of trials that exceeded 4 lg/dL (the tentative threshold value estimated from Surkan et al. [5] and Jusko et al. [6]) and 10lg/dL (the US CDC action level) was 75 and 0, respectively, out of 100,000 random trials.
0 10 20 30 40 50 60 70 80
0.0 0.4 0.8 1.2 1.6 2.0 2.4 2.8 3.2 3.6 4.0
Pb concentration (ug/dL)
Number of subjects
When sex- and age-related variation was examined for the whole dataset (n=352), there was a significant neg-ative correlation between BPb and age (r= -0.193, p\0.001). Therefore, in the following comparisons, age was considered as a potential covariate in the models.
Geometric mean [geometric standard deviation (GSD) in parenthesis] BPb was 1.11lg/dL (1.47) and 1.04lg/dL (1.55) for males and females, respectively, andt test did not find significant sex difference (no sex difference was observed for mean age).
In this study, three regions of Japan were selected, i.e., Tokyo, Shizuoka, and Osaka. For Shizuoka region, blood sampling was done in two different periods: one in 2005–2006 (n=132) and the other in 2008–2010 (n=55). Sampling in Tokyo and Osaka was done in 2008–2010 only. For Shizuoka samples, there was no sig-nificant difference in mean BPb (GM 1.18 and 1.07lg/dL in 2005–2006 and 2008–2010, respectively) or age (7.1 and 7.7 years) between 2005–2006 and 2008–2010; therefore, these two periods are combined in the following analyses.
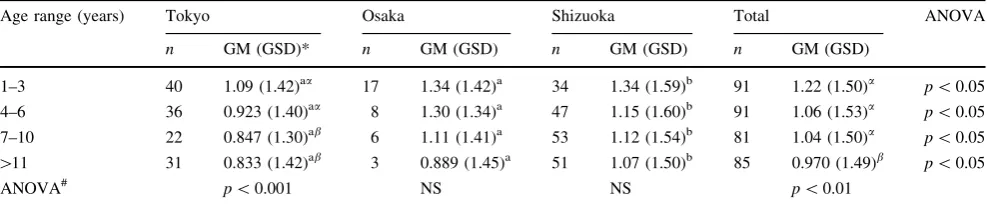
Geometric means and GSDs of BPb are also presented in Table1, divided into the 3 regions. Mean BPb signifi-cantly varied from region to region: the lowest GM was seen in Tokyo and the highest in Osaka. However, mean age of subjects was also significantly different by region. ANCOVA using age as covariate still found significantly lower BPb in Tokyo than in Shizuoka and Osaka. Table2 presents a comparison of BPb by age group and region. ANOVA within each age group found significant variation due to region, and regional difference in GM in each age group was only significant for the pair Tokyo–Shizuoka (p\0.05, Table2). Since there were 6 collaborating pediatricians in Tokyo, geographic variation within Tokyo was also examined; however, no significant variation was found after controlling for age (data not shown).
The subject children were divided into three groups according to passive smoking status: no smoking family member (n =162), smoker present but does not smoke in the presence of child (n =115), and smoker present and smokes in the presence of child (n =64). Data for passive smoking were missing for 11 subjects.
ANOVA found marginally nonsignificant variation in BPb concentration due to passive smoking status (F=2.349, p =0.097). However, mean age was signifi-cantly different by passive smoking status (higher mean age in children with family members who smoked in the presence of child). Therefore, ANCOVA analysis was applied controlling for age. Figure2 shows age-adjusted BPb according to passive smoking status. Children with passive smoking had significantly higher BPb (adjusted BPb 1.21lg/dL) than children who were expected to be passive smoking-free (1.07 and 1.02lg/dL). When the same analysis was applied separately to each region, the results were similar, although not necessarily identical, to that of the total dataset. For Shizuoka, the result was the same, i.e., higher BPb in children with passive smoking. Table 1 Average lead concentrations in blood samples from 3
regions
N Age
(years)**
Blood Pb concentration (GM,lg/dL)**
Tokyo 131 6.2±3.8a 0.940 (1.42)#
Osaka 34 4.8±3.6 1.24 (1.41)
Shizuoka 187 7.3±3.6a,# 1.15 (1.56)
Total 352 6.6±3.8 1.07 (1.51)
a Age of two subjects was missing for Tokyo and Shizuoka
** Variation in age and blood Pb concentrations due to the regions was significant (ANOVA,p\0.01 and\0.001, respectively) # Significantly different from the other two regions (Scheffe´’s multiple-comparison procedure)
Table 2 Comparison of blood Pb concentration (lg/dL) of children by age group and region
Age range (years) Tokyo Osaka Shizuoka Total ANOVA
n GM (GSD)* n GM (GSD) n GM (GSD) n GM (GSD)
1–3 40 1.09 (1.42)aa 17 1.34 (1.42)a 34 1.34 (1.59)b 91 1.22 (1.50)a p\0.05
4–6 36 0.923 (1.40)aa 8 1.30 (1.34)a 47 1.15 (1.60)b 91 1.06 (1.53)a p\0.05
7–10 22 0.847 (1.30)ab 6 1.11 (1.41)a 53 1.12 (1.54)b 81 1.04 (1.50)a p\0.05
[11 31 0.833 (1.42)ab 3 0.889 (1.45)a 51 1.07 (1.50)b 85 0.970 (1.49)b p\0.05
ANOVA# p\0.001 NS NS p\0.01
Significant difference is present between GMs with different alphabet (regional difference) and Greek letters (age grade) (Scheffe´’s multiple-comparison procedure)
The total number of subjects was 348 in this table because there were 4 children without age information in the 352 children
NSnot significant
However, for Tokyo, the tendency was similar but did not reach statistical significance. For the Osaka subsample, the correlation between BPb and age was weak and ANCOVA could not be applied. ANOVA did not find significant variation in BPb according to passive smoking status in Osaka. Lack of significance in Tokyo and Osaka was probably because of loss of statistical power due to reduction of sample size.
Discussion
Because BPb analysis involves trace analysis of Pb, which is prone to external contamination, we paid utmost atten-tion to contaminaatten-tion control and analytical quality assur-ance. The total amount of contamination estimated from blood sampling/storage devices was 0.056 ng, which was
\0.3% of the expected amount of Pb in 2 mL blood samples assuming BPb of 1lg/dL. Procedural blanks during digestion of blood sample were typically undetect-able (\0.003 ng) and negligible. Thus, our present BPb analysis was done under well-controlled conditions in terms of external contamination. In addition, the result of RM analyses was satisfactory in terms of precision and trueness of the analysis. All of our quantitative evaluation of contamination during blood sampling and accuracy of BPb analysis demonstrated the reliability of our BPb analysis.
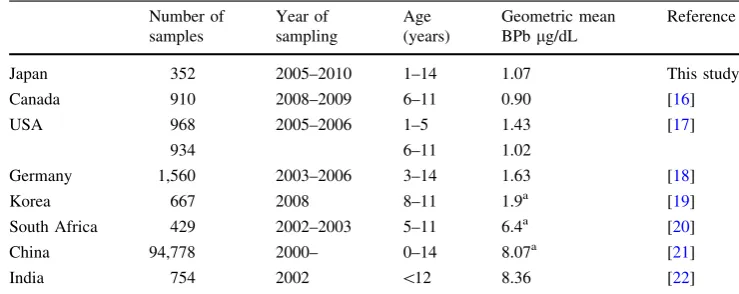
As shown in Table1, average BPb of the present sub-jects was 1.07lg/dL (GM), among the lowest in the world. Table3 summarizes some of the recent data on BPb of
children reported in other countries, though year of sam-pling and age of subject children vary among these reports [15–21]. The lower BPb in Japanese children may be due to lack of apparent Pb exposure sources such as leaded gas-oline and residential Pb-based paint, which are well-known contributors to Pb contamination of children in many countries. In Japan, as mentioned above, leaded gasoline was completely phased out as early as the mid-1980s, and it is not the custom to paint houses.
BPb in Japanese children has been reported in a limited number of studies. The first report was by Kaji et al. [9]; the arithmetic mean BPb of 188 children ([1 year) of Shizuoka region in 1993 was 3.16lg/dL (range 0.80–9.51lg/dL). They reported BPb concentration of 23 children aged \1 year to be 1.83lg/dL. Kaji [10], in collaboration with Kobayashi and Yoshida [11], reported the arithmetic mean BPb of 282 children (aged[1 year) to be 1.55lg/dL or GM 1.36lg/dL (range 0.19–7.68lg/dL). They collected blood samples in Shizuoka in 2004–2005. The present GM (1.15 lg/dL) of children in Shizuoka (Table1) was lower than previously reported values, indicating a general trend for decreasing Pb exposure in children in Shizuoka.
Based on the BPb distribution of the present study (Fig.1), the probability of exceeding the US CDC action level (10lg/dL) was negligible. It has been claimed that 10lg/dL is too high a reference BPb, and we postulated a tentative threshold value to be 4lg/dL based on recent epidemiologic studies, in which significant loss of IQ of children was indicated above 4–5lg/dL BPb [5, 6]. The probability of exceeding this level was 0.075%, indicating that the health risk due to Pb in Japanese children was minimal, even using the postulated lower threshold value. However, some researchers have claimed that there is no threshold for cognitive effect of Pb for children [7, 8]. Therefore, it may be desirable to reduce Pb exposure level of children as much as possible, although the current Pb exposure level seems to pose minimum risk.
Among the potential factors to vary BPb of children examined in the present study, age, geographic region, and passive smoking emerged as significant factors, while sex did not.
The negative correlation with age observed in this study is consistent with the results of previous studies. In a number of cohort studies, in which the same children were followed from birth to school age, peak BPb was observed in the 2nd year of life, followed by decrease thereafter [22–25]. The present result (Table2) seemed to be con-sistent with this finding, although ours is a cross-sectional design. This elevation of BPb in the early years of life has been ascribed to physiological and behavioral features: higher uptake rate of Pb in digestive tract and more fre-quent hand-to-mouth activity in early life than in later life. 0.0
0.2 0.4 0.6 0.8 1.0 1.2 1.4
1 2 3
Passive Smoking Status
BPb ug/dL
*
**
This study is the first to examine regional variation in BPb of children in Japan. As shown in Table2, GM of BPb in Tokyo was lower than that in Osaka and Shizuoka for all age groups, although statistical significance was seen only for the pair Tokyo-Shizuoka, probably because of small sample size for Osaka, and this result was supported by ANCOVA analysis as well. The lower BPb in Tokyo may partly be related to the smaller percentage of children with passive smoking, whose BPb was significantly higher than children without it (Fig.2). The percentage of children with passive smoking was 14.0% in Tokyo while it was 29.4% and 20.0% in Osaka and Shizuoka, respectively, though this difference was not statistically significant (v2 test). However, it may be premature to conclude that there are regional differences in BPb based on the present study, because sampling was done in only one hospital in Shizuoka and Osaka while blood samples were taken from children in six different clinics/hospitals in Tokyo. There-fore, it is possible that hospital bias was present for Osaka and Shizuoka subjects. The present result should be confirmed by including more samplings and analyses in Shizuoka and Osaka, and also in other regions. Geographic variation, if any, may provide a clue to the source of Pb for Japanese children.
Higher BPb in children with passive smoking has been reported in the past [7,8,26] and was ascribed to the fact that cigarette smoke contains Pb [1]. The present result is consistent with those previous results (Fig.2). We have estimated the Pb exposure level of Japanese children living in Tokyo Metropolitan Area by assuming that diet/tap water, soil, house dust, and atmosphere were potential Pb sources and by summing the exposure level from each medium [27]. The present study suggests that cigarette smoke is another potential source of Pb for Japanese children which might significantly contribute ([10% of absorbed amount) to total Pb exposure. However, we need to consider the possibility that misclassification of passive smoking status took place in this study: we estimated it based solely on information obtained from questionnaire
by asking whether the smoking family member(s) smoked in the presence of the subject child. Future study should include biomarker of cigarette smoke exposure, such as blood or urine cotinine concentration, to relate to BPb concentration [28].
Conclusions
Lead concentration in whole blood sampled from Japanese children was analyzed by a contamination-controlled, reli-able analytical method. Geometric mean concentration was 1.07lg/dL, indicating that Japanese children are at minimal health risk in terms of the presently recognized safety level. Variation was found in blood lead concentration due to age, region of blood sampling, and passive smoking status. Reduction of passive smoking is an effective practical measure to further reduce lead exposure level, and conse-quently health risk, of children, since it is postulated that adverse effects of Pb may not have a threshold.
Acknowledgments The authors appreciate the following collabo-rating pediatricians:.Drs. A. Uematsu, K. Sugihara, M. Goto, K. Nakamura, H. Koyanagi, K. Baba, H. Utsumi, and H. Yamakage. The authors sincerely appreciate the subject children and their caretakers. This study was supported by a grant from the Food Safety Com-mission, Cabinet Office, Japan (project #0801).
References
1. IPCS. Environmental Health Criteria 165 inorganic lead. Geneva: WHO; 1995.
2. Pocock SJ, Smith M, Baghurst P. Environmental lead and chil-dren’s intelligence: a systematic review of the epidemiological evidence. BMJ. 1994;309:1189–97.
3. Miranda ML, Kim D, Galeano MAO, Paul CJ, Hull AP, Morgan SP. The relationship between early childhood blood lead levels and performance on end-of-grade tests. Environ Health Perspect. 2007;115:1242–7.
4. Needleman HL, Riess JA, Tobin MJ, Biesecker GE, Greenhouse JB. Bone lead levels and delinquent behavior. JAMA. 1996;275: 363–9.
Table 3 Comparison of blood Pb levels of children
a Arithmetic mean
Number of samples
Year of sampling
Age (years)
Geometric mean BPblg/dL
Reference
Japan 352 2005–2010 1–14 1.07 This study
Canada 910 2008–2009 6–11 0.90 [16]
USA 968 2005–2006 1–5 1.43 [17]
934 6–11 1.02
Germany 1,560 2003–2006 3–14 1.63 [18]
Korea 667 2008 8–11 1.9a [19]
South Africa 429 2002–2003 5–11 6.4a [20]
China 94,778 2000– 0–14 8.07a [21]
5. Surkan PJ, Zhang A, Trachtenberg F, Daniel DB, McKinlay S, Bellinger DC. Neuropsychological function in children with blood lead levels\10lg/dL. Neurotoxicology. 2007;28:1170–7. 6. Jusko TA, Henderson CR Jr, Lanphear BP, Cory-Slecha DA, Parsons PJ, Canfield RL. Blood lead concentrations\10lg/dL and child intelligence at 6 years of age. Environ Health Perspect. 2008;116:243–8.
7. Schwartz J. Low-level lead exposure and children’s IQ: a meta-analysis and search for a threshold. Environ Res. 1994;65:42–55. 8. Lanphear BP, Hornung R, Khoury J, Yolton K, Baghurst P, Bellinger DC, et al. Low-level environmental lead exposure and children’s intellectual function: an international pooled analysis. Environ Health Perspect. 2005;113:894–9.
9. Kaji M, Gotoh M, Takagi Y, Masuda H. Blood lead levels in Japanese children: effects of passive smoking. Jpn J Pediatr. 1997;101:1584–7. [in Japanese].
10. Kaji M. Blood lead levels in Japanese children—effects of pas-sive smoking. Biomed Res Trace Elem. 2007;18:199–203. 11. Kobayashi N, Yoshida K. Health risk assessment of lead in
Japanese children based on blood lead concentration. Jpn J Hyg. 2006;61:295. [in Japanese].
12. Su M, Barrueto F Jr, Hoffman RS. Childhood lead poisoning from paint chips: a continuing problem. J Urban Health. 2002;79: 491–501.
13. Lanphear BP, Matte TD, Rogers J, Clickner RP, Dietz B, Bornschein RL, et al. The contribution of lead contaminated house dust and residential soil to children’s blood lead levels. Environ Res. 1998;79:51–68.
14. Okamoto K, Fuwa K. Low-contamination digestion bomb method using Teflon double vessel for biological materials. Anal Chem. 1984;56:1758–60.
15. Bushnik T, Haines D, Levallois P, Levesque J, Van Oostdam J, Viau C. Lead and bisphenol A concentrations in the Canadian population. Health Rep. 2010;21:7–18.
16. US Center for Disease Control and Prevention. Fourth National Report on human exposure to environmental chemicals. Atlanta, GA: CDC; 2010.
17. Kolossa-Gehring M, Becker K, Conrad A, Lu¨decke A, Riedel S, Seiwert M, et al. German Environmental Survey for Children (GerES IV)—first results. Int J Hyg Environ Health. 2007;210: 535–40.
18. Cho S-C, Kim B-N, Hong Y-C, Shin Y-C, Yoo HJ, Kim J-W, et al. Effects of environmental exposure to lead and tobacco smoke on inattentive and hyperactive symptoms and neurocog-nitive performance in children. J Child Psychol Psychiat. 2010; 51:1050–7.
19. Mathee A, Ro¨llin H, von Schirnding Y, Levin J, Naik I. Reduction in blood lead levels among school children following the introduction of unleaded petrol in South Africa. Environ Res. 2006;100:319–22.
20. He K, Wang S, Zhang J. Blood lead levels of children and its trend in China. Sci Total Environ. 2009;407:3986–93.
21. Nichani V, Li W-I, Smith MA, Noonan G, Kulkarni M, Kodavor M, et al. Blood lead levels in children after phase-out of leaded gasoline in Bombay, India. Sci Total Environ. 2006;363:95–106. 22. Baghurst PA, McMichael AJ, Wigg NR, Vimpani GV, Robertson EF, Roberts RJ, et al. Environmental exposure to lead and chil-dren’s intelligence at the age of seven years. N Engl J Med. 1992;327:1279–84.
23. Dietrich KN, Berger OG, Succop PA. Lead exposure and the motor developmental status of urban six-year-old children in the Cincinnati prospective study. Pediatrics. 1993;91:301–7. 24. Canfield RL, Henderson CR Jr, Cory-Slechta DA, Cox C, Jusko
TA, Lanphear BP. Intellectual impairment in children with blood lead concentrations below 10lg per deciliter. N Engl J Med. 2003;348:1517–26.
25. Schnaas L, Rothenberg SJ, Flores M-F, Martinez S, Herna´ndez C, Osorio E, et al. Blood lead secular trend in a cohort of children in Mexico City (1987–2002). Environ Health Perspect. 2004;112: 1110–5.
26. Stro¨mberg U, Lundh T, Schu¨tz A, Skerfving S. Yearly mea-surements of blood lead in Swedish children since 1978: an update focusing on the petrol lead free period 1995–2001. Occup Environ Med. 2003;60:370–2.
27. Aung NN, Yoshinaga J, Takahashi J. Exposure assessment of lead among Japanese children. Environ Health Prevent Med. 2004; 9:257–61.