R E S E A R C H A R T I C L E
Open Access
Undernutrition and its association with
socio-demographic, anemia and intestinal
parasitic infection among pregnant women
attending antenatal care at the University
of Gondar Hospital, Northwest Ethiopia
Gemechu Kumera
1*, Dereje Gedle
1, Animut Alebel
2, Fetuma Feyera
2and Setegn Eshetie
3Abstract
Background:Under nutrition is a worldwide public health problem affecting the well-being of millions of pregnant women in the developing world. Only limited research has been conducted on the prevalence and determinants of maternal nutritional status in Ethiopia. Particularly, data on the nutritional status of pregnant women are lacking. The aim of this study was to assess the prevalence and determinants of undernutrition among pregnant women attending antenatal care at the University of Gondar Hospital, Northwest Ethiopia.
Methods:An institution based cross-sectional study was conducted in January and February 2016. Randomly selected 409 pregnant women were included in the study. Nutritional status was estimated using mid-upper-arm circumference. Data on potential determinants of undernutrition were gathered using a structured questionnaire. The blood sample was collected to analyze hemoglobin. The stool sample was collected to identify intestinal parasitic infections. Statistical analysis was done using logistic regression.P-value < 0.05 at 95% confidence interval was considered as statistically significant.
Results:The prevalence of undernutrition among pregnant women was 16.2% (95% CI: 12.4–20.1%). Using a logistic regression model, factors significantly associated with the undernutrition were living in rural areas (AOR = 2.26), low educational status [no formal education (AOR = 2.91), primary education (AOR = 2.69)], history of too many births (AOR = 2.55), anemia (AOR = 2.01), and intestinal parasitic infection (AOR = 2.73).
Conclusion:The study findings provide evidence for the public health significance of under nutrition among pregnant women in the study area. The problem must be combated through rural livelihood promotion, socioeconomic empowerment of women, sustained nutrition education and expansion of family-planning services in the area.
Keywords:Undernutrition, Pregnant women, Northwest Ethiopia
* Correspondence:gemechisfreedom@gmail.com
1Department of Public Health, College of Medicine and Health Science,
Debre Markos University, Debre Markos, Ethiopia
Full list of author information is available at the end of the article
Background
Undernutrition and poor health from preventable causes disproportionately affect the well-being of millions of
people in the developing world [1]. Maternal
undernutri-tion is a worldwide public health problem affecting a
high proportion of women in developing countries [2].
Women and young children are the most affected [3].
More than 3.5 million women and children under age five in developing countries die each year due to the
underlying cause of undernutrition [4]. Women in
sub-Saharan Africa, south-central and southeastern Asia are the most affected [3].
Ethiopia faces one of the world’s highest rates of
maternal undernutrition. The analysis of Ethiopian Demo-graphic Health Surveys (EDHS) 2000, 2005 and 2011 data revealed 30.5, 26.9, 27% of women in Ethiopia are under-nourished respectively [5–7]. Based on recently conducted DHS country surveys, the proportion of undernourished women in sub-Saharan African countries ranges from 7 to 37%, indicating that maternal undernutrition in Ethiopia is higher than the level for many African countries [8].
Maternal prenatal undernutrition has a major
impact on their own health as well as their children’s
health. Increased perinatal and neonatal mortality, a higher risk of low birth weight and stunted babies, intrauterine growth restriction, stillbirths, and miscar-riage are some of the consequences of undernutrition in women, which further undermines the human cap-ital development of the family and society, and
con-tinues the cycle of poverty and malnutrition [9–15].
Undernutrition is a serious problem in Ethiopia. One of every four (27%) women in Ethiopia are undernourished
[7]. Although the government and nongovernmental
orga-nizations have been perpetually working to improve the nutritional status of the women, the outcome of these ef-forts has not yet knocked mitigating effect on the preva-lence of undernutrition among women in Ethiopia.
Only limited research has been conducted on the prevalence and determinants of maternal nutritional tus in Ethiopia. Particularly, data on the nutritional sta-tus of pregnant women are lacking. Information on the nutritional status and associated factors among pregnant women are needed for prioritizing, designing and initiat-ing intervention programs aimed at improvinitiat-ing maternal nutrition. In addition, such data can be employed in pro-grammes that are aimed to reduce maternal and child morbidity and mortality. Thus, this study was carried out to provide information regarding the prevalence and factors associated with undernutrition during pregnancy.
Methods
Study design, area and population
An institution based cross-sectional study was con-ducted at the University of Gondar Hospital in January
and February 2016. The University of Gondar Hospital is a tertiary-level service-rendering institution that pro-vides health service to over 4 million people in Gondar town and surrounding area. The Gondar town lies in the average at 2000 m above sea level and over 370,000
population reside in this administrative town [16]. The
study populations were all pregnant women in Gondar town and surrounding area who attend antenatal care (ANC) at the University of Gondar Hospital.
Sample size and sampling technique
A sample size of 409 was computed using single popula-tion proporpopula-tion sample size calculapopula-tion formula with in-puts of 95% confidence level, 4% margin of error, 19.1%
expected prevalence of undernutrition [17] and 10%
non-response rate. A systematic random sampling tech-nique was used to select the study subjects. According
to the Hospital report, on average, 35–45 pregnant
women visit the ANC daily, and 1241 pregnant women have been enrolled in ANC. Since the sample size was determined as 409, a sampling interval of 3 was used to select study participants. Of the first three pregnant women, one woman was randomly selected by using lot-tery method (The pregnant women is assigned to unique number (1, 2 and 3), putting it on a piece of paper. The pieces of paper are placed in the container and thor-oughly mixed. Then, a blind folded researcher picks a number. Number three (3) was selected.). Accordingly, every 3rd pregnant women were selected to participate in the study until the required sample size of 409 preg-nant women was obtained.
Data collection methods
Questionnaire
A structured and pre-tested questionnaire was used for assessing potential determinants of undernutrition. The parts of the questionnaire on dietary diversity were adopted from Food and Nutrition Technical Assistance
(FANTA) indicator guideline [18]. Other parts of the
questionnaire were developed by the principal investiga-tors. The questionnaire was administered in a local
lan-guage(Amharic). The English version of the
supervisor by the principal investigator to have consen-sus and the same understanding of what is intended to be measured by each question in the questionnaire. The data collection process was followed daily by the super-visor and principal investigator. The dietary diversity (DD) level was assessed using 24-h recall method. Re-spondents were asked whether they had taken any food from predefined 12 food categories on a preceding day. Accordingly, the level of Dietary Diversity Score (DDS) was computed out of 12. According to the recommenda-tion of Food and Agriculture Organizarecommenda-tion (FAO) of the
United Nations, DD was classified into low (DDS ≤3),
medium (DDS of 4 or 5), or high (DDS ≥6) [19].
Preg-nant women from all trimesters (first, second and third) were included in the study.
Mid upper arm circumference (MUAC) measurement
Mid upper arm circumference was measured halfway be-tween the tip of the shoulder (olecranon process) and the tip of the elbow (acromion process) to the nearest 0.1 cm. An insertion type MUAC tape that is non-elastic and non-stretchable was used to take the measurement. The measurement was taken at the mid-point on the re-laxed left arm, without any clothing and with optimal tape tension (not too loose or not too tight) following
the standard instructions and steps [20]. Recently
pub-lished paper based on a review of evidence revealed that MUAC is a preferred anthropometric measurement dur-ing pregnancy [21] and also not affected by non-nutritional
changes [22]. Undernutrition was defined as MUAC less
than 22 cm [23].
Laboratory analysis
Hemoglobin level determination
Venous blood was collected from each pregnant woman, using sterile blood collection tubes following standard procedures. Hemoglobin level was determined using hematological analyzer (Cell Dyn 1800, PD, USA) ma-chine. Anemia was defined as a hemoglobin level of less than 11.0 g/dl during the first or third trimester or less
than 10.5 g/dl during the second trimester [24].
Accord-ing to the formula recommended by Center for Disease Prevention and Control, hemoglobin values were ad-justed for altitude [25].
Stool specimen collection and examination
Stool samples were collected from participants using clean, dry and leak-proof cupped plastic container fol-lowing standard procedures. The stool samples were masked, coded, and processed for parasitological exam-ination. Different stool examinations were used for effi-cacy in detecting parasites. These were direct wet-mount
and formaldehyde-ether sedimentation method [26, 27].
The WHO guide for diagnosis of intestinal parasitosis was used as an identification reference [28].
Data processing and analysis
Data were entered using EPI-INFO version 7 software. The analysis was carried out using SPSS version 20 stat-istical program. Wealth index (poor, middle and rich) were computed using principal component analysis as a composite indicator of living standard. In this study, un-dernutrition (MUAC < 22 cm) was an outcome variable. Bivariate and multivariable logistic regression analysis was used to assess the association between the dependent and independent variables and to control confounders. Independent variables significantly associ-ated with the dependent variable in bivariate regression
models were exported to multivariable regression
models for adjustment. The collinearity effect was tested using the Variance Inflation Factor (VIF) for all inde-pendent variables. Model fitness was assessed using the
Hosmer-Lemeshow statistic test. P-value < 0.05 at 95%
CI was considered statistically significant.
Ethical cosideration
The study was conducted in confirmation of national and international ethical guidelines for biomedical re-search involving human subjects. Ethical clearance was obtained from an ethical review committee of the Uni-versity of Gondar. Written informed consent was
ob-tained from each study participants prior to
participation in the study after the nature of the study was fully explained to the study participants. Women who had intestinal parasites and anemia were treated ac-cordingly. Those women identified as undernourished were referred to ANC clinicians for treatment. Nutrition education was given to all study participants. Those par-ticipants identified as undernourished were given nutri-tional counseling and Ready Use Therapeutic Food (RUTF) in collaboration with the clinicians working in an ART clinic at Hospital.
Results
Socio-demographic characteristics of the study participants
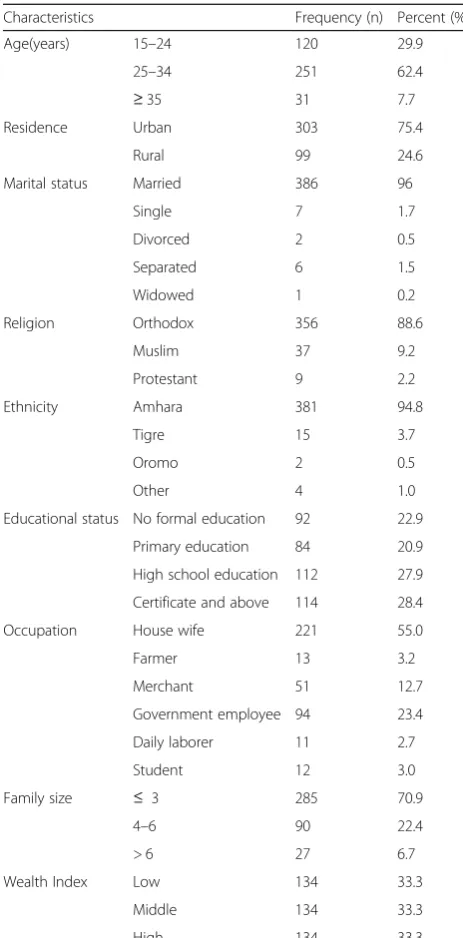
Table 1 summarizes socio-demographic characteristics
of the study participants. Of the total 409 pregnant women, initially planned for the study, 402 were volun-teered to take part in the study, with a response rate of 98.3%. The vast majority of the respondents were Am-hara in ethnicity (94.8%) and orthodox (88.6%) in reli-gion. The majority of participants (62.4%) were in the
age group 25–34 years with the mean and standard
303 (75.4%), of the respondents, were urban dwellers. The average household size was 3.2 (± 1.6). The median monthly household income was 2000 Ethiopian birr.
Environmental and sanitation factors
Table 2 summarizes environmental and sanitation
char-acteristics of the study participants. Source of drinking water for the greater number, 368(91.5%) of study sub-jects was tap water. The majority of study participants, 383(95.3%) had toilet facilities. The large proportion of participants, 283(73.9%) use pit latrine.
Reproductive health factors
Table3 summarizes reproductive health factors of study
participants. More than half, 224 (55.7%) of the partici-pants were in the third trimester, 117(29.1%) in the sec-ond and 61(15.2%) in the first trimester. The results
revealed a greater majority of the participants,
198(49.3%) had a first pregnancy at a time of data collec-tion. In 33 (8.2%) of the study participants, the birth interval was less than the recommended 24 months. The mean parity was 1.1 (± 1.6), ranging between 0 and 7 pregnancies. The mean MUAC for nulliparas was 24.7
(+/−2.6) cm. The corresponding value for parity
cat-egories of 1–3 and 4 or more was 25.2 (+/−3.1) cm and
23.5 (+/−2.8) cm, respectively.
Dietary intakes of the study participants
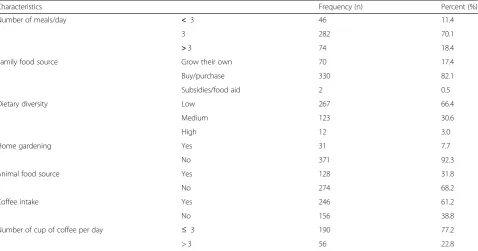
Table 4 summarizes dietary intakes of the study
partici-pants. The vast majority of the study subjects consumed
cereal-based foods (made of teff ) (Fig.1). The commonly
and frequently consumed foods were a starchy staple,
100% and legumes, 273(67.9%). Only one-fourth,
86(21.4%) of study subjects were consumed vitamin A rich fruits and vegetables in the reference period. Two hundred forty-six, (61.2%) of the study participants Table 1Socio-demographic characteristics of the study
participants, Northwest Ethiopia, 2016 (n= 402)
Characteristics Frequency (n) Percent (%)
Age(years) 15–24 120 29.9
25–34 251 62.4
≥35 31 7.7
Residence Urban 303 75.4
Rural 99 24.6
Marital status Married 386 96
Single 7 1.7
Divorced 2 0.5
Separated 6 1.5
Widowed 1 0.2
Religion Orthodox 356 88.6
Muslim 37 9.2
Protestant 9 2.2
Ethnicity Amhara 381 94.8
Tigre 15 3.7
Oromo 2 0.5
Other 4 1.0
Educational status No formal education 92 22.9
Primary education 84 20.9
High school education 112 27.9
Certificate and above 114 28.4
Occupation House wife 221 55.0
Farmer 13 3.2
Merchant 51 12.7
Government employee 94 23.4
Daily laborer 11 2.7
Student 12 3.0
Family size ≤ 3 285 70.9
4–6 90 22.4
> 6 27 6.7
Wealth Index Low 134 33.3
Middle 134 33.3
High 134 33.3
Table 2Environmental and sanitation characteristics of pregnant women attending antenatal care, Northwest Ethiopia, 2016
Characteristics Frequency (n) Percent (%)
Source of drinking water Tab 368 91.5
Well 11 2.7
Spring 23 5.7
Possession of toilet facility Yes 383 95.3
No 19 4.7
Types of latrine Pit latrine 283 73.9
Water flush 97 25.3
Public 3 0.8
Table 3Reproductive health factors among pregnant women attending antenatal care, Northwest Ethiopia, 2016
Characteristics Frequency (n) Percent (%)
Trimester of pregnancy First 61 15.2
Second 117 29.1
Third 224 55.7
Parity 0 198 49.3
1–3 155 38.6
≥4 49 12.2
Birth interval 0(No birth) 198 49.3
< 2 yr 33 8.2
reported that they consumed coffee. A small proportion, 128 (31.8%) of study participants reported that they con-sumed a diet of animal origin prior to the survey. Among animal products, flesh meat was consumed by 94 (23.4%) of the study subjects, whereas egg, milk and milk products and organ meat were consumed by 20 (5%), 25 (6.2%) and 2 (0.5%), respectively. The mean DDS was 3.33 (± 0.77), ranging between 1 and 7. The majority of study participants, 267 (66.4%) had low DDS
(≤3 food groups). The meal frequency was three times a
day for the majority of the study participants 282(70.1%).
Anemia, HIV and diarrhea among the study participants Of all study participants, 17(4.2%) were positive for HIV. Among 21 study participants who were positive for HIV, 6(28.6%) were undernourished. The mean MUAC for HIV positive and negative were 23.1(± 3.8) and 24.8(± 2.8) cm, respectively. A small proportion, 26(6.5%) of the preg-nant women had diarrhea; of whom nearly one-fourth, 6(23.1%) were undernourished. Overall, the prevalence of anemia was 132(32.8%), and was more evident in undernourished pregnant women (25%) than in normal
pregnant women(MUAC≥22 cm).
Table 4Dietary intakes of pregnant women attending antenatal care, Northwest Ethiopia, 2016
Characteristics Frequency (n) Percent (%)
Number of meals/day < 3 46 11.4
3 282 70.1
>3 74 18.4
Family food source Grow their own 70 17.4
Buy/purchase 330 82.1
Subsidies/food aid 2 0.5
Dietary diversity Low 267 66.4
Medium 123 30.6
High 12 3.0
Home gardening Yes 31 7.7
No 371 92.3
Animal food source Yes 128 31.8
No 274 68.2
Coffee intake Yes 246 61.2
No 156 38.8
Number of cup of coffee per day ≤ 3 190 77.2
> 3 56 22.8
94
25.1
10.2
4.7 3.2
0 10 20 30 40 50 60 70 80 90 100
Frequency(%)
Types of staple diets
Teff
Sorghum
Maize
Wheat
Millet
Prevalence and type of intestinal parasites among the study participants
Figure 2 summarizes prevalence and type of intestinal
parasitic infection among the study participants. One hundred twenty-six, (31.3%) of study participants were infected with one or more intestinal parasites. Of whom, 35(27.8%) were undernourished. The most common single and mixed parasites observed were
Entamoeba histolytica 48(38.1%) and Ascaris
lumbri-coides 31(24.6%). Intestinal parasitic infection tends increase among rural dwellers and pregnant women who used other sources of drinking water other than tap water. Of 99 rural dwellers pregnant women, 41(41.4%) were infected with one or more intestinal parasites. Among 11 pregnant women who consumed well water, 7(63.6%) were infected with one or more intestinal parasites. Similarly, among 23 pregnant women who consumed spring water, 12(52.2%) were infected with one or more intestinal parasites.
Prevalence of under nutrition
Undernutrition (MUAC < 22 cm) was observed in 65 of 402 pregnant women studied, yielding a prevalence of
16.2% (95% CI: 12.4–20.1%). The mean MUAC (±SD) of
the study participants was 24.8 cm (± 2.9). The value ranged from 18 to 37 cm. The prevalence of undernutri-tion during the first, second and third trimesters were, 14.8, 16.2 and 16.5%, respectively. The mean MUAC(±SD) for the first, second and third trimesters were, 24.8 (± 3.2), 24.8(± 2.8) and 24.7 (± 2.7) g/dl, respectively.
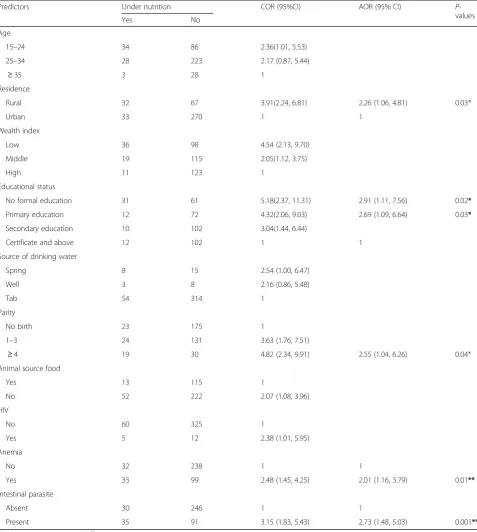
Factors associated with undernutrition
Table5summarizes factors associated with
undernutri-tion among pregnant women. A multivariable analysis
in a form of logistic regression was employed to iden-tify the risk factors of undernutrition among pregnant women. The analyses rest on two outcomes of nutritional status of pregnant women: whether they are
under-nourished (MUAC< 22 cm) or not (MUAC≥22 cm).
In the bivariate analysis, undernutrition was signifi-cantly associated with age, residence, wealth index, educational status, source of drinking water, parity, animal source food, HIV, anemia and intestinal para-site. The multivariable logistic regression analysis re-vealed that residence, maternal educational status, parity, anemia and intestinal parasite were predictors of undernutrition.
Place of residence was significantly associated with
nutritional status of pregnant women (P= 0.03). The
risk of undernutrition was two times, [AOR = 2.26; 95% CI (1.06, 4.81)] higher among rural pregnant women than their urban counterparts.
The study also witnessed significant association be-tween educational level and maternal nutritional sta-tus. The risk of undernutrition for pregnant women with no formal education and primary education was 2.91 and 2.69 times higher, respectively as compared to pregnant women with higher education (certificate and above) [AOR = 2.91; 95% CI (1.11, 7.56)], [AOR = 2.69; 95% CI (1.09, 6.64)].
Significant associations were also observed between nutritional status and parity. The risk of undernutri-tion for pregnant women with grand multiparas was two and half times higher as compared to pregnant women with no parity [AOR = 2.55; 95% (1.04, 6.26)].
Anemia was found to be significantly associated with undernutrition. Pregnant women who were anemic were
38.1
24.6
16.7
5.6 4.8
3.2 2.4 2.4 1.6 0.8
0 5 10 15 20 25 30 35 40 45
F
requenc
y(%)
Types of intestinal parasites
Entanmoeba histolytica
Ascaris lumbricoides
Hookworm species
Hymenolepsis nana
Giardia lamblia
E. histolytica & A. lumbricoides
Tanea species
Hookworm & E. histolytica
Strongyloid stercoralis
Schistosoma mansoni
two times more likely to be undernourished than those with normal hemoglobin level [AOR = 2.01; 95% (1.16, 3.79)].
The intestinal parasite was also found to be significantly associated with undernutrition. Pregnant women who had one or more intestinal parasitic infection were three times
more likely to be malnourished as compared to those who had no intestinal parasitic infection [AOR = 2.73; 95% CI (1.48, 5.03)].
In this study, nutritional status did not show any statis-tical association with regard to dietary diversity, family size, occupation, latrine availability, number of meals per Table 5Factors associated with the undernutrition among pregnant women
Predictors Under nutrition COR (95%CI) AOR (95% CI) P
-values
Yes No
Age
15–24 34 86 2.36(1.01, 5.53)
25–34 28 223 2.17 (0.87, 5.44)
≥35 3 28 1
Residence
Rural 32 67 3.91(2.24, 6.81) 2.26 (1.06, 4.81) 0.03*
Urban 33 270 1 1
Wealth index
Low 36 98 4.54 (2.13, 9.70)
Middle 19 115 2.05(1.12, 3.75)
High 11 123 1
Educational status
No formal education 31 61 5.18(2.37, 11.31) 2.91 (1.11, 7.56) 0.02*
Primary education 12 72 4.32(2.06, 9.03) 2.69 (1.09, 6.64) 0.03*
Secondary education 10 102 3.04(1.44, 6.44)
Certificate and above 12 102 1 1
Source of drinking water
Spring 8 15 2.54 (1.00, 6.47)
Well 3 8 2.16 (0.86, 5.48)
Tab 54 314 1
Parity
No birth 23 175 1
1–3 24 131 3.63 (1.76, 7.51)
≥4 19 30 4.82 (2.34, 9.91) 2.55 (1.04, 6.26) 0.04*
Animal source food
Yes 13 115 1
No 52 222 2.07 (1.08, 3.96)
HIV
No 60 325 1
Yes 5 12 2.38 (1.01, 5.95)
Anemia
No 32 238 1 1
Yes 33 99 2.48 (1.45, 4.25) 2.01 (1.16, 3.79) 0.01**
Intestinal parasite
Absent 30 246 1 1
Present 35 91 3.15 (1.83, 5.43) 2.73 (1.48, 5.03) 0.001**
*
P-value is significant at < 0.05,**
day, coffee intake, staple diets, home gardening and family food source.
Discussion
This study assessed the prevalence and determinants of undernutrition among pregnant women attending ante-natal care. The current study witnessed the public health significance of undernutrition in the study area. Findings of the study showed that, 16.2% of pregnant women were undernourished. In Ethiopia, few studies deter-mined the prevalence of undernutrition in pregnant
women and came up with figures 9.2% [29], 19.1% [17],
31.4% [30] and 34.0% [31]. The studies consistently wit-nessed the public health significance of undernutrition in the country. The current study showed that preva-lence of undernutrition among pregnant in the country is decreasing as compared to earlier studies. The prob-able reason for this variation could be the interventions on nutrition, maternal health and other women
empow-ering programs by the government and other
non-governmental organizations in the country. More-over, the variation may be due to geographical variation, smaller land holding, the recurrent food insecurity and the seasonal difference in data collection. Further, the prevalence may have overestimated in earlier studies as only adolescent pregnant women were included in the study.
Women living in rural areas are more undernourished than their urban counterparts. Similar results have been reported from earlier studies [3,6, 32, 33]. The disparity may be due to less developed infrastructures, low nutri-tional awareness, low access to health care, safe water, and sanitation facilities, traditional ways of farming as only means of surviving and cultural and religious influ-ences in rural areas. In addition, lower nutritional status among rural pregnant women could be explained partly by the fact that in rural areas women are more vulner-able to early marriage and childbearing than women in
urban areas [6]. Hence, in addition to their own health
needs, they need an adequate dietary intake for preg-nancy and child growth. Further, the higher levels of labor or workload among rural pregnant women may contribute to poor nutritional status among pregnant women in rural areas, as overexertion is a predisposing factor to maternal nutritional depletion [34].
The study findings indicate a negative relationship be-tween the educational status of the pregnant women and undernutrition, with decreasing educational levels from certificate and above to no formal education, the level of undernutrition tends to increase. Previous studies also
have documented similar findings [30–32, 35]. The
probable reason could be pregnant women who are liter-ate may have more exposure to media, which influence their behaviour in matters related to their own feeding
and health [36]. Unawareness of illiterate women about
their own health and nutritional status could be another reason associated with their poor nutritional status. Moreover, the low educational level of women could be associated with little or no decision-making power in the household about food distribution, purchase of household consumption items and financial issues which may contribute to their low nutritional status. However, in a study conducted in Iran, there was no statistically
significant association between pregnant women’s
educa-tion level and nutrieduca-tional status [37]. The variation can
be due to the difference in socioeconomic status and nu-tritional care prior to and during pregnancy.
Another finding that affects pregnant women’s
nutri-tional status is parity. The odds of undernutrition were observed to rise as parity advances. Previous studies also
reported the same [29,31, 32]. The study witnessed the
deleterious effect of too many births on nutritional sta-tus. The finding is consistent with the knowledge that repeated reproductive cycles deplete maternal nutrition store. Moreover, higher-level parity obligates women to take care of their children rather than protecting their own health and nutritional status, given limited house-hold resources.
The current study finding witnessed a significant posi-tive association between anemia and undernutrition. The proportion of undernutrition was significantly more among anemic pregnant women compared to normal hemoglobin level pregnant women. This finding is in line with studies conducted in Ethiopia [38], Kenya [39]
and India [40], which indicated that the risk of anemia
tends to increase among undernourished pregnant women. This might be due to the fact that undernour-ished pregnant women have a higher risk of being defi-cient in micronutrients and therefore more likely to be anemic. As the study is cross-sectional, it is not viable to
exclude “the chicken or the egg” causality dilemma.
However, as protein is known to take part in multiple metabolic pathways, it might have a causal role in anemia. This relation between undernutrition and anemia might be due alterations in spleen and bone marrow erythropoiesis, reduction in reticulocyte as a re-sult of a protein-energy deficiency in undernourished
pregnant women [41].
bleeding caused by the parasite may contribute to poor nutritional status [42–44].
Major strength of this study was the random selection of the study participants. The major limitation was the cross-sectional nature of its design as we can’t establish causal relationships between the independent variables and nutritional status of the pregnant women. Secondly, the study was institution based and the study subjects may not represent the general population. Third, the last date of the menstrual period and/or fundal height with a subsequent urine test, were used to diagnose pregnancy, which may not accurately confirm pregnancy.
Recommendation
A national level study should be conducted in Ethiopia. The problem must be combated through an implemen-tation of strategies like rural livelihood promotion, socio-economic empowerment of women and expansion
of women’s education, particularly in rural areas.
Nutri-tional care should be integrated into maternity services. We also suggest sustained nutrition education to en-hance good nutritional awareness and practice of preg-nant women. Expansion of family planning services will also have affirmative input. Prevention and control of in-testinal parasite infection through improving access to safe and adequate water supply; sanitation and hygiene practices should be considered. Screening of pregnant women for intestinal parasitic infections, universal
deworming programs, and expansion of prenatal
iron-folate supplementation should also be looked for.
Conclusion
The study findings provide evidence for the public health significance of undernutrition among pregnant in the study area. The important risk factors/ predictors of undernutrition (MUAC < 22 cm) were living in rural areas, low educational status, history of too many births, anemia and intestinal parasitic infection.
Abbreviations
ANC:Antenatal care; DD: Dietary diversity; DDS: Dietary diversity score;
EDHS: Ethiopian Demographic and Health Survey; FANTA: Food and Nutrition Technical Assistance; FAO: Food and Agriculture Organization of the United Nations; MUAC: Mid upper arm circumference; SD: Standard deviation
Acknowledgements
We would like to thank the University of Gondar Hospital staffs for their full cooperation and vital assistance during data collection and conducting the laboratory analysis. Special thanks go to entire study subjects for their full participation in the study. We acknowledge University of Gondar and Save the children for funding the study.
Funding
This study was supported by the University of Gondar and Save the children for data collection material and reagents. However, the they had no role in a decision to publish or preparation of the manuscript.
Availability of data and materials
The data sets supporting the conclusions of this article are included within the manuscript.
Authors’contributions
GK participated in study protocol development, data collection, analysis, write-up and drafting of the manuscript. AA, FF, and SE assisted in data collection and reviewing papers. All authors read and approved the final manuscript.
Ethics approval and consent to participate
Ethical approval was obtained from an ethical review committee of the institute of public health, College of Medicine and Health Sciences, University of Gondar prior to data collection. Permission was taken from the University of Gondar Hospital administrators, and written informed consent was obtained from each study participants prior to participation in the study after the nature of the study was fully explained to the study participants. Participants were told that they had full right to participate or not, and they were also informed that all the data obtained from them would be kept confidential using codes instead of any personal identifiers. Women who had intestinal parasites and anemia were treated accordingly. Those participants identified as undernourished were given nutritional counseling and Ready Use Therapeutic Food (RUTF) in collaboration with the clinicians working in an ART clinic at Gondar hospital.
Consent for publication
Not applicable.
Competing interests
We, the authors, have no any competing interests.
Publisher’s Note
Springer Nature remains neutral with regard to jurisdictional claims in published maps and institutional affiliations.
Author details
1Department of Public Health, College of Medicine and Health Science,
Debre Markos University, Debre Markos, Ethiopia.2Department of Nursing, College of Medicine and Health Science, Debre Markos University, Debre Markos, Ethiopia.3School of Biomedical and Laboratory Sciences, College of Medicine and Health Science, University of Gondar, Gondar, Ethiopia.
Received: 8 February 2018 Accepted: 8 June 2018
References
1. Piot P, Semba R and Bloem M. Nutrition and health in developing countries.
Totowa: Springer Science and Business Media; 2008.
2. Adebowale S, Adepoju O, Okareh T. Social epidemiology of adverse
nutritional status outcomes among women in Nigeria: NDHS, 2008. Pak J
Nutr. 2011;10(9):888–98.
3. Uthman O, Aremu O. Malnutrition among women in sub-Saharan Africa:
rural-urban disparity. Rural Remote Health. 2008;8(2):931.
4. Black R, Allen L, Bhutta Z, Caulfield L, Onis M. Maternal and child
undernutrition: global and regional exposures and health consequences.
Lancet. 2008;371(9608):243–60.
5. Central Statistical Agency (Ethiopia) and ORC Macro. Ethiopia Demographic
and Health Survey. Addis Ababa and Calverton: Central Statistical Agency and ORC Macro; 2001.
6. Central Statistical Agency (Ethiopia) and ORC Macro. Ethiopia Demographic
and Health Survey. Addis Ababa and Calverton: Central Statistical Agency and ORC Macro; 2006.
7. Central Statistical Agency (Ethiopia) and ICF International. Ethiopia
Demographic and Health Survey. Addis Ababa and Calverton: Central Statistical Agency (Ethiopia) and ICF International; 2012.
8. Macro International. Ethiopia Atlas of Key Demographic and Health
Indicators. Calverton: Macro International; 2008.
9. Landis S, Lokomba V, Ananth C. Impact of maternal malaria and
10. Goyal R, Mudey A, Banginwar A. Intra-uterine growth restriction (IUGR) among teenage and elderly pregnant women in Vidharba region of
Maharashtra, India. Int J Cur Bio Med Sci. 2012;2(1):199–202.
11. Blössner M, Onis M, Prüss-Üstün A. Quantifying the health impact at
national and local levels. Geneva: WHO; 2005.
12. Teller C and Yimer G. Levels and determinants of malnutrition in
adolescent and adult women in Southern Ethiopia. Ethiop J Health
Develop. 2015;14(1):57–66.
13. Girma W, Genebo T. Determinants of nutritional status of women and
children in Ethiopia. 2002.
14. Myatt M, Duffield A, Seal A, Pasteur F. The effect of body shape on
weight-for-height and mid-upper arm circumference based case definitions of
acute malnutrition in Ethiopian children. Ann Human Biol. 2009;36(1):5–20.
15. Garza C, Rasmussen KM. Pregnancy and lactation. In: Garrow JS, James WPT,
Ralph A, editors. Human Nutrition and Dietetics. Edinburgh: Churchill Livingstone, London. 2000: p. 437-48.
16. Information and Statistics Office. Information and statistics office. Gondar:
University of Gondar Hospital; 2015.
17. Kedir H, Berhane Y, Worku A. Magnitude and determinants of malnutrition
among pregnant women in eastern Ethiopia: evidence from rural, community-based setting. Matern Child Nutrit. 2016;12(1):51-63.
18. Swindale A and Bilinsky P. Household dietary diversity score (HDDS) for
measurement of household food access: indicator guide. Washington, DC: Food and Nutrition Technical Assistance Project, Academy for Educational Development; 2006.
19. Kennedy G, Ballard T, Dop MC. Guidelines for measuring household and
individual dietary diversity. Rome: FAO; 2011.
20. Cogill B. Anthropometric indicators measurement guide. 2003.
21. Ververs M, Antierens A, Sackl A. Which anthropometric indicators identify a
pregnant woman as acutely malnourished and predict adverse birth outcomes in the humanitarian context? PLOS Currents Disasters; 2013.
22. López L, Calvo E, Poy M. Changes in skinfolds and mid-upper arm
circumference during pregnancy in Argentine women. Matern Child Nutrit.
2011;7(3):253–62.
23. Ferro-Luzzi A, James W. Adult malnutrition: simple assessment techniques
for use in emergencies. Brit J Nutrit. 1996;75(1):3–10.
24. Woteki CE, and R Earl. Iron deficiency anemia: recommended guidelines for
the prevention, detection, and management among US children and women of childbearing age. Washington, D.C.: National Academies Press;1994.
25. Nestel P. Adjusting hemoglobin values in program surveys. Washington, DC:
International Nutritional Anemia Consultative Group, International Life Sciences Institute; 2002.
26. Ridley D, Hawgood B. The value of formol-ether concentration of faecal
cysts and ova. J Clin Pathol. 1956;9(1):74.
27. Casemore D, Armstrong M, Sands R. Laboratory diagnosis of
cryptosporidiosis. J Clin Pathol. 1985;38(12):1337–41.
28. World Health Organization. Bench aids for the diagnosis of intestinal
parasites. Geneva: World Health Organization; 1994.
29. Kuche D, Singh P, Moges D, Belachew T. Nutritional Status and Associated
Factors among Pregnant Women in Wondo Genet District, Southern Ethiopia. JFSE. 2015;5:85-94.
30. Regassa N, Stoecker BJ. Contextual risk factors for maternal malnutrition in a
food-insecure zone in southern Ethiopia. J Biosoc Sci. 2012;44(5):537–48.
31. Belete Y, Negga B, Firehiwot M. Under nutrition and associated factors
among adolescent pregnant women in Shashemenne District, West Arsi Zone, Ethiopia: a community-based. J Nutrit Food Sci. 2016;6(1):1-7.
32. Okwu GN, Ukoha AI, Nwachukwu N, Agha NC. Studies on the Predisposing
Factors of Protein Energy Malnutrition Among Pregnant Women in a
Nigerian Community. Online J Health Allied Scs. 2008;6(3):1–9.
33. Bitew, F.H. and D.S. Telake, Undernutrition among women in Ethiopia:
rural-urban disparity. 2010.
34. Winikoff B, Castle M. Defining maternal depletion syndrome. Am J Public
Health. 1993;83(7):1052.
35. Nucci LB, et al. Nutritional status of pregnant women: prevalence and
associated pregnancy outcomes. Rev Saude Publica. 2001;35(6):502–7.
36. Begum S, Sen B. Maternal Health, Child Well-Being and chronic poverty:
does Women's agency matter? The Bangladesh Development Studies; 2009.
p. 69–93.
37. Abasizadeh S, Hemati Z, Deres F. Prevalence of malnutrition during
pregnancy and associated factors in women of Ardal County in 2012–2013.
Int J Epidemiol Res. 2016;3(1):19–25.
38. Gedefaw L, Ayele A, Asres Y, Mossie A. Anaemia and associated factors
among pregnant women attending antenatal care clinic in Walayita Sodo town, Southern Ethiopia. Ethiop J Health Sci. 2015;25(2):155-64.
39. Okubatsion Tekeste Okube* WM, Odhiambo E, Wakasiaka Sabina MH.
Prevalence and factors associated with Anaemia among pregnant women attending antenatal Clinic in the Second and Third Trimesters at Pumwani
maternity hospital, Kenya. Open J Obstet Gynecol. 2016;6:16–27.
40. Mondal B, Tripathy V, Gupta R. Risk factors of Anemia during pregnancy
among the Garo of Meghalaya, India. J Hum Ecol. 2006;14:27-32.
41. Borelli P, et al. Reduction of erythroid progenitors in protein–energy
malnutrition. Br J Nutr. 2007;97(2):307–14.
42. Arimond M, Daelmans B, Dewey K, Morris S. Maternal and Child
Undernutrition 5 Effective international action against undernutrition: why has it proven so difficult and what can be done to accelerate progress?
Commentary. Lancet. 2008;371(9612):608–21.
43. Crompton D, et al. Hookworm infection, nutritional status and productivity.
In: Hookworm disease-current status and new directions; 1990. p. 231–64.
44. Jardim-Botelho A, et al. Age patterns in undernutrition and helminth
infection in a rural area of Brazil: associations with ascariasis and hookworm.