R E S E A R C H A R T I C L E
Open Access
Immune monitoring using the predictive power
of immune profiles
Michael P Gustafson
1, Yi Lin
2, Betsy LaPlant
3, Courtney J Liwski
1, Mary L Maas
1, Stacy C League
4, Philippe R Bauer
5,
Roshini S Abraham
4, Matthew K Tollefson
6, Eugene D Kwon
6, Dennis A Gastineau
1,2and Allan B Dietz
1*Abstract
Background:We have developed a novel approach to categorize immunity in patients that uses a combination of whole blood flow cytometry and hierarchical clustering.
Methods:Our approach was based on determining the number (cells/μl) of the major leukocyte subsets in unfractionated, whole blood using quantitative flow cytometry. These measurements were performed in 40 healthy volunteers and 120 patients with glioblastoma, renal cell carcinoma, non-Hodgkin lymphoma, ovarian cancer or acute lung injury. After normalization, we used unsupervised hierarchical clustering to sort individuals by similarity into discreet groups we call immune profiles.
Results:Five immune profiles were identified. Four of the diseases tested had patients distributed across at least four of the profiles. Cancer patients found in immune profiles dominated by healthy volunteers showed improved survival (p < 0.01). Clustering objectively identified relationships between immune markers. We found a positive correlation between the number of granulocytes and immunosuppressive CD14+HLA-DRlo/negmonocytes and no correlation between CD14+HLA-DRlo/negmonocytes and Lin-CD33+HLA-DR-myeloid derived suppressor cells. Clustering analysis identified a potential biomarker predictive of survival across cancer types consisting of the ratio of CD4+T cells/μl to CD14+HLA-DRlo/negmonocytes/μL of blood.
Conclusions:Comprehensive multi-factorial immune analysis resulting in immune profiles were prognostic, uncovered relationships among immune markers and identified a potential biomarker for the prognosis of cancer. Immune profiles may be useful to streamline evaluation of immune modulating therapies and continue to identify immune based biomarkers.
Keywords:Immunity, CD14, Biomarker, Monocytes, Myeloid suppressor, Treg, CD4, Survival, Cancer, Human
Background
This work arose from frustration in the lack of consist-ent correlates between changes in the immune status of a patient and clinical outcome in immunotherapy clin-ical trials. We noted on several occasions in our own work that the typical approach to describing immunity was not adequate. For example, describing regulatory T cells (Tregs) in terms of its relationship to a parent population (such as Tregs as a percent of CD4+ cells) or grandparent population (such as lymphocytes) did not take into ac-count if the patient was lymphopenic. This approach also
ignored relationships between disparate lineages of the im-mune system. Every leukocyte can, at some level, interact with virtually all other leukocytes. If immunity is funda-mentally based on the likelihood of different leukocytes to interact, then the frequency of each within a volume of blood is critical to predicting the nature and duration of an immune response.
Consequently, more global or systemic approaches are needed in order to understand the connections and interplay between various immune cells in humans [1]. Indeed, significant efforts are underway to measure the immunological changes in complex diseases [2]. Systems approaches to human immunity have included gene ex-pression arrays [3], cytokine arrays [4], immunohisto-chemistry [5], or multiple phenotype analysis [6,7]. In * Correspondence:dietz.allan@mayo.edu
1Human Cellular Therapy Laboratory, Division of Transfusion Medicine,
Department of Laboratory Medicine and Pathology, Mayo Clinic, 200 First Street, Rochester, MN, USA
Full list of author information is available at the end of the article
this study, flow cytometry of whole blood was used to
determine the frequency/μl in blood of defined immune
markers (i.e. the frequency of Lineage-HLA-DR-CD33+ myeloid derived suppressor cells). Determining the num-ber of cells for any immune marker per unit volume has two distinct advantages: it allows direct quantification of
immune markers (cells/μl), and eliminates processing
steps such as density gradient separation that may effect the analysis. More importantly, using quantitative ana-lyses allows one to determine the relationships between all members of the immune system. We considered the combination of all immune markers that we measured within a patient as the patients’immune phenotype.
To identify patients’ immune phenotypes common
within a population, we calculated the immune pheno-types within the peripheral blood of healthy volunteers, in patients with malignant disease, and in patients with acute lung injury. Acute lung injury was used because it is a known immune suppressive condition associated with poor outcome. Using hierarchical clustering, we identified individuals with common immune phenotypes. These common immune phenotypes we have termed immune profiles. We have identified profiles within spe-cific diseases as well as immune profiles shared across malignancies. Patients with an immune phenotype found in an immune profile shared by healthy volunteers sur-vived longer independent of the underlying disease. Identification of immune profiles allowed discovery of novel relationships between immune cells. We report here a novel methodology to comprehensively characterize hu-man immunity.
Methods
Patients and healthy volunteers
Samples were collected under approval of the Mayo Clinic Institutional Review Board. Specific enrollment criteria and previous results from typing peripheral blood for some glioblastoma (GBM) patients [8], non-Hodgkin lymphoma (NHL) patients [9], and healthy vol-unteers have been previously reported [8,9] and were used for reanalysis in this study. Briefly, GBM patient samples were collected prior to surgery with or without concurrent steroids. Non-Hodgkin lymphoma (NHL) pa-tients were newly diagnosed or recently relapsed papa-tients off all chemotherapy for at least eight weeks. Patients with metastatic renal cell carcinoma (RCC) had newly diagnosed or recent relapsed disease and had samples taken before cytoreductive nephrectomy. Ovarian cancer patients (OVA) were newly diagnosed or relapsed with no chemotherapy for the prior 8 weeks. Cancer patient demographics can be found in Additional file 1: Table S1. Acute lung injury (ALI) patients who presented with at least one risk factor for acute lung injury/acute re-spiratory distress syndrome [10] within 12 hours of
admission and/or recognition of the diagnosis were se-lected. Inclusion criteria are from the American-European Consensus Conference [11] and consists of acute onset of hypoxemia (PaO2/FiO2≤300, acute lung
injury; ≤200, acute respiratory distress syndrome) and
diffuse radiologic infiltrates in the absence of left atrial hypertension. Risk factors include pneumonia, sepsis, pan-creatitis, shock, aspiration, high risk surgery, and high risk trauma [12]. The age of the healthy volunteers was not dif-ferent from each group except for RCC (Additional file 2: Figure S1).
Flow cytometry of whole blood
Peripheral blood was used as the source for antibody staining as previously described [8,13]. Immune markers identified included granulocytes, lymphocytes, monocytes (identified by forward and side scatter), CD3+ T cells, CD19+ B cells, (CD56+CD16+) NK cells, CD4+ T cells, regulatory T cells (CD4+CD25+CD127lo), CD86+ total
monocytes and CD14+HLA-DRlo/neg immunosuppressive
monocytes. Antibody reagents are listed in Additional file
3: Table S2. BD TruCount™ tubes (BD Biosciences, San
Jose, CA) were used to collect cell counts/μl of blood for T, B and NK cells. This 4-color assay test does not require the exclusion of dead cells. The remaining markers were measured as a percent of these cells by adding fluorochrome-conjugated antibodies directly to 50-100μl of whole blood and incubated for 15-20 minutes at room temperature in the dark. Red blood cells were lysed with BD FacsLysis Solution per manufacturer’s instructions. Cells were centrifuged, washed with phosphate buffered saline, and fixed in 4% para-formaldehyde. Data was
ac-quired on a BD FACSCalibur™ flow cytometer calibrated
the day of use and analyzed with Cell Quest, Multiset (BD), and/or Flowjo (Ashland, OR) software. The cell counts of granulocytes, lymphocytes, and monocytes were combined in each profile and the average was plot-ted as pie graphs to represent the total population of cir-culating immune cells. The cell counts of CD4+, CD8+, B,
NK, cells, regulatory T cells, and CD14+ HLA-DR+ and
HLA-DRlo monocytes were combined and the average
plotted as a pie graph to represent the total circulating mononuclear cells. CD8 cells were reported as the
differ-ence of CD3 and CD4 cells. CD14+HLA-DR+and
HLA-DRlo/neg monocytes were calculated from the percentage of CD14+monocytes of total monocytes cell count (by for-ward/side scatter) and multiplied by the percentage of HLA-DR+and HLA-DRlo/negcells.
Multiparameter analysis and hierarchical clustering
Each immune marker for each individual (HV and pa-tients) was then normalized by dividing the individual value by the mean value of healthy volunteers of that marker. The marker ratios for each volunteer and pa-tient were imported into Partek Genomics Suite 6.5 soft-ware (Partek Inc., St. Louis, MO) and log-transformed for hierarchical clustering. Hierarchical analysis was performed by unsupervised agglomerative Euclidean average linkage clustering. Principal component analysis was performed using the Scatter plot view in the Partek program. Immune phenotypes as defined in this paper were the number and composition of circulating white blood cells within an individual. An immune profile was a group of immune phenotypes (containing a minimum of seven members) with as few dendrogram branches as possible. Additionally, all diseased members within a pro-file were compared to diseased members of other propro-files (unless indicated) to determine profile differences.
Statistical analyses
Values for subgroups of data were tested for statistical significance using the two-tailed non-parametric Mann-Whitney test for unpaired samples, the non-parametric Spearman correlation test for correlative analyses, and the Fisher’s 2 × 2 or 3 × 3 exact test for distribution be-tween profiles. Cox models were used to identify prog-nostic factors for overall survival, where the models were adjusted for age and stratified by disease. The
method of Contal and O’Quigley was used to determine
a best cut-point for the CD4+/CD14+HLA-DRlo/neg
monocyte ratio [14]. Overall survival was evaluated using standard Kaplan-Meier methods. All statistical analyses and graphs were performed using Prism, ver-sion 5.0 software (GraphPad Software, San Diego, CA) and SAS software (SAS Institute Inc., Cary, NC).
Results
Identification of distinct immune profiles within diseases
We assessed the number and relative composition of ten immune markers in peripheral blood of HV and patients. These markers provide a comprehensive overview of the immune system with unambiguous gating strategies or have clearly defined functions related to immune sup-pression [8,15]. To cluster potentially similar immune phenotypes, cell counts were measured or calculated, normalized to that of healthy volunteers, and analyzed using hierarchical clustering and principal component analysis.
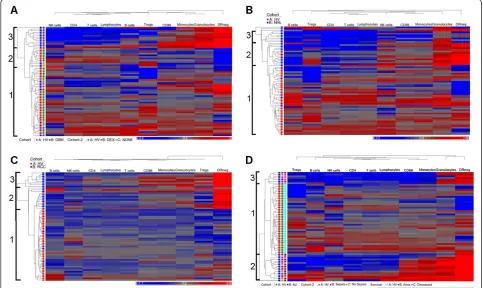
We clustered immune phenotypes within individual malignancies using HV as a control group for clustering. We performed unsupervised hierarchical clustering on 27 GBM patients with 40 HV (Figure 1A). Three clusters of patients with similar immune systems (profiles) were identified. Profile 1 contained 32 HV, 5 dexamethasone
(DEX) treated patients, and 5 untreated GBM patients; Profile 2 contained 8 HV and 4 untreated patients and Profile 3 contained only 13 DEX treated GBM patients (p = <0.0001; Fisher’s 3 × 3 exact test). The segregation of these patients based on DEX treatment agreed with our conventionally analyzed immune markers of these pa-tients [8]. Thus, hierarchical clustering identified previ-ously known informative subgroups.
We analyzed patients with NHL, RCC, and OVA in a similar manner with the same set of healthy volunteers. We assigned three profiles in NHL and RCC patients and in each case, the majority of patients clustered in profiles separate from those with the HV profile (Profile 1) (Figure 1B & 1C). Alternatively, the OVA patients clustered across profiles with within the healthy volun-teers, (Additional file 4: Figure S2).
We analyzed the immune phenotypes of ALI. Many critically ill ALI patients have an initially strong pro-inflammatory response but can quickly fall into a prolonged anti-inflammatory state called immune par-alysis [16,17]. We felt that this patient population would test this approach in a non-malignant condition. There were three clearly identifiable profiles. Profile 1 contained all HV and 2 ALI patients, Profile 2 contained 7 ALI pa-tients (5 septic), and Profile 3 contained 16 ALI papa-tients (11 septic) (Figure 1D). Profiles 2 and 3 did not show differ-ences in the distribution of septic patients. However, pa-tients in Profile 2 exhibited a lower survival rate than profiles 1 and 3 in that 71% of patients in profile 2 died from their condition, where 19% of patients in Profiles 1 and 3 died (p = 0.026; Additional file 5: Figure S3). Together this data suggests that hierarchical clustering can identify unique immune profiles for each disease group, profiles that correlate with overall immune status, and clinical outcome.
Identification of distinct immune profiles across several diseases
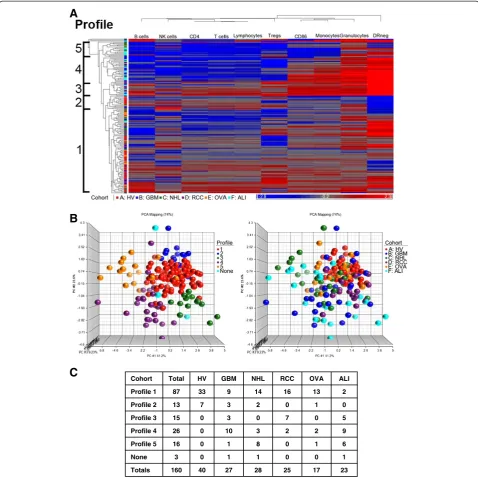
We noted that assigned profiles differed regarding the underlying immune characteristics. (i.e. Profile 2 in GBM does not share the same immune characteristics as Profile 2 in NHL or RCC). The power of hierarchical clustering to informatively segregate immune pheno-types is dependent on the number of the individuals used in the analysis. To identify immune profiles that represent a common immune status, we repeated these assays in an analysis that combined all healthy volun-teers and patients.
Figure 2C. All HV were clustered within two immune profiles. The distribution of subjects among immune profiles was different for each pathology. Thus, distinct profiles of immunity are shared across diseases with dis-ease specific profile distribution.
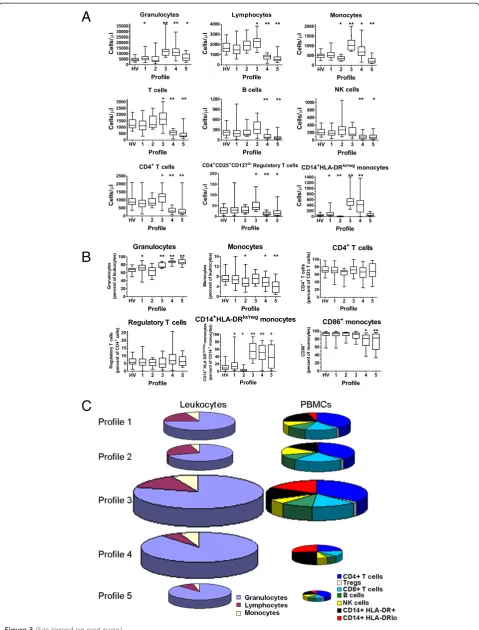
To confirm the uniqueness of each immune profile, we compared the values of each marker to the values of the markers from other profiles or to only the pooled healthy volunteers (Figure 3A and Additional file 6: Table S3). The values of the markers from patients within profiles 1 and 2 (where HV typically segregate) were most similar to the HV pooled group. When com-pared to the pooled HV, Profile 1 had fewer lymphocytes
and elevated CD14+HLA-DRlo/neg monocytes; profile 2
had fewer monocytes and fewer CD14+HLA-DRlo/neg
monocytes when compared to the pooled HV profile. Profile 3 had elevated granulocytes, monocytes, and lym-phocytes (mainly the T cell compartment), elevated
regulatory T cells and CD14 + HLA-DRlo/neg monocytes.
Profile 4 had elevated granulocytes and monocytes but decreased lymphocytes (including T, B, and NK cells), decreased CD4+ T cells and elevated CD14 + HLA-DRlo/neg monocytes. Abnormally low monocytes and lymphocytes including CD4+ T cells were present in patients in Profile 5. These data confirm that the profiles, as determined by hierarchical clustering, correspond to unique immune characteristics despite the disease of the patients. In addition, while we observed specific immune differences in each of the disease groups as outlined in Additional file 7: Table S4, when these profiles were analyzed to-gether, common patterns of immune characteristics were identified independent of disease group.
or the pooled healthy volunteers (Figure 3B). This ana-lysis confirmed that the profiles were identifying subjects with similar immune statuses representing both absolute and relative differences.
Our data allowed the reconstruction of the average leukocyte composition of blood existing within a profile for the entire leukocyte compartment and peripheral blood mononuclear cells (PBMC; Figure 3C). The size of
the pie chart reflects the relative quantity of cells per fixed unit of blood relative to Profile 1. For example, Profile 3 had almost twice as many total leukocytes as Profile 1 (p < 0.0001 and Additional file 8: Figure S4) and Profile 4 had over 1.5 times that of Profile 1 (p < 0.0001 and Additional file 8: Figure S4). The direction of the abso-lute change in total cells/μl was similar in all profiles ex-cept profile 4 where the leukocyte population increased
23 17 25 28 27 40 160 Totals
1 0 0 1 1 0 3 None
6 1 0 8 1 0 16 Profile 5
9 2 2 3 10 0 26 Profile 4
5 0 7 0 3 0 15 Profile 3
0 1 0 2 3 7 13 Profile 2
2 13 16 14 9 33 87 Profile 1
ALI OVA RCC NHL GBM HV Total Cohort
A
B
C
A
B
C
while the PBMC population decreased. The magnitude of the difference also differed in the PBMC pools with Profile 3 having 1.5 times the amount of PBMCs than Profile 1 (p < 0.0001 and Additional file 8: Figure S4) while Profile 5 had less than half of PBMCs than Profile 1 (p < 0.0001 and Additional file 8: Figure S4). These re-sults suggest that there exists peripheral blood immune profiles shared across disease states and that these pro-files consist of changes in the absolute and relative quan-tities of individual white blood cells.
Immune profiles correlate with patient outcome
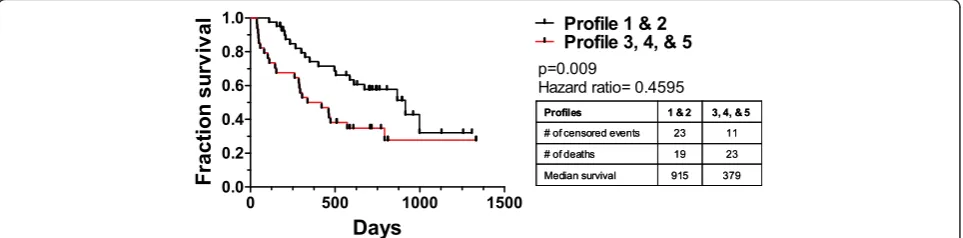
In previous studies, we have shown single immune markers with prognostic effects in single diseases [9,18]. Here, we have shown that immune profiles were predict-ive of survival in ALI (Additional file 5: Figure S3). We used those diseases with survival data (GBM, NHL, and RCC patients) to see if immune profile predicted sur-vival across cancer diagnosis. We categorized patients by immune profile adjusting for age and cancer diagnosis. We grouped profiles most closely resembling normal immune system and compared them to those that do not (Figure 4). The median overall survival of patients in profile 1 and 2 (915 days, n = 42) was almost two and a half times as long as those in the other immune profiles (379 days; n = 34, p = 0.009). Similar analysis within dis-ease groups did not identify survival associated profiles
(Additional file 5: Figure S3). However, the studies suf-fered from insufficient sample size. The power of this approach will improve as the sample size increases. The approach presented here has the potential to segregate patients based solely on an unbiased immune status and identify those with the worst prognosis independent of underlying disease.
Identification of related immune markers using hierarchical clustering
In addition to clustering individuals into immune pro-files, hierarchical clustering identifies immune markers related by similar presence across immune profiles. A subset of our patients had been typed with 23 immune markers. We repeated our previous analysis to search for related expression. Some relationships observed were
expected including the presence of CD4+ T cells
segre-gating with CD28+CD4+ T cells or CD14+CD16-
mono-cytes with CD86+ monocytes (Figure 5A). However,
some were novel such as granulocytes with CD14+
HLA-DRlo/neg or Tregs segregating independently from CD4+
cells. Lineage-HLA-DR-CD33+ myeloid derived suppres-sor cells (MDSCs) clustered independently of both granulocytes and monocytes, suggesting independent regulation. Thus, this analysis produced correlative evi-dence of similar or disparate regulation of certain leuko-cytes in humans.
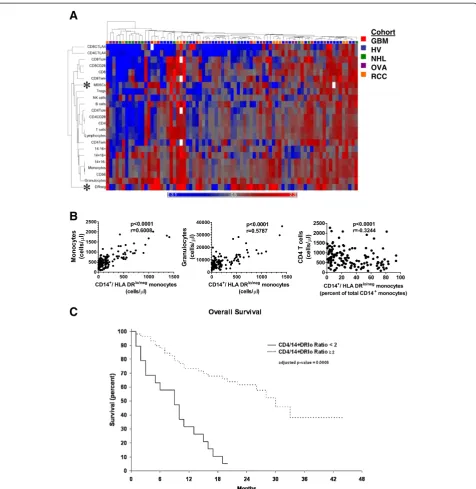
Figure 4Survival of cancer patients categorized by immune profiles.Individual patients with GBM, NHL, or RCC with survival data were assigned a profile from Figure 2. Patients were pooled into profile groups independent of underlying disease. Profiles 1 and 2 were grouped as they represent the only profiles seen in healthy volunteers and compared to the survival of patients with profiles of 3, 4, and 5. P values were calculated by the Mantel-Cox log rank test while adjusting for the contributions of age and disease.
(See figure on previous page.)
A marker clustering largely by itself was the CD14+ HLA-DRlo/negphenotype. Previous work identified CD14+ HLA-DRlo/negmonocytes as a predictor of poor prognosis and powerful mediators of immune suppression in GBM
[8], NHL [9], chronic lymphocytic leukemia [18] melan-oma [19], and renal cell cancer [20]. These cells are a sub-set of monocytes that express low or no HLA-DR (See Additional file 9: Figure S5 for a representative gating
A
B
C
Cohort GBM HV NHL OVA RCC
strategy). This phenotype had one of the largest degrees of change in both relative and absolute terms in our analysis (Figure S3 and Additional file 7: Table S4). To investigate if this hierarchical clustering could identify interesting im-mune marker correlations within the imim-mune system we performed correlation analysis with two closely related marker and one marker segregating at a distant to the CD14+HLA-DRlo/negphenotype. CD14+HLA-DRlo/neg mono-cyte cell counts positively correlated with total monomono-cyte and granulocyte counts, markers that closely segregated to
the CD14+HLA-DRlo/neg (Figure 5B). We had previously
found that CD4+ T cell counts were inversely correlated
to the percentage of CD14+HLA-DRlo/neg monocytes (of
total CD14+ monocytes) in GBM patients. Here, in a lar-ger cohort of subjects including both volunteers and
can-cer patients, CD4+ cells segregated distally from the
CD14+HLA-DRlo/negphenotype and were inversely
corre-lated to the percentage of CD14+HLA-DRlo/neg
mono-cytes (p < 0.001; Spearman r = -0.3244). The data suggest
that CD14+HLA-DRlo/neg monocytes are independently
regulated are at odds with CD4+ T cells, and are import-ant to the characterization of the overall status of the im-mune system. The analysis also identified key inverted relationships that might lead to improved understanding the relationships between leukocytes within the immune system.
The CD4+/CD14+HLA-DRlo/negratio is a prognostic biomarker in cancer patients
We chose the inverted relationship between CD14+
HLA-DRlo/neg and CD4+ cells identified above to deter-mine if selected but disparate informative markers could describe immune status. Although lymphocytes counts have proven to be useful prognostic markers in some cancer populations [21,22] analysis of the individual markers have rarely identified a survival difference. We calculated the ratio of the number of CD4+T cells to the number of CD14+HLA-DRlo/negmonocytes (cells/μl). The
40 healthy volunteers had a mean CD4+/CD14+
HLA-DRlo/neg ratio of 39.8 (median 22.5) with a minimum of 3.9. The GBM, NHL, and RCC patients were subgrouped into those with high or low ratio, with a cut-point ratio of 2.0. We analyzed the overall survival of GBM, NHL, and RCC patients with high and low ratio using multivariate analysis to control for age and disease type. The median overall survival for patients with a ratio above 2.0 was 30 months (n = 68) compared to 9 months for patients with a low ratio (n = 39; p = 0.006 by multivariate analysis) (Figure 5C). This ratio is potentially a strong predictive biomarker for risk stratification and prognosis.
Discussion
We have presented a novel approach to comprehensively describe the immune system based on whole blood flow
cytometry of patients with a diverse pathology,
deter-mining the number of cells/μl for the major leukocyte
components and hierarchical clustering of the generated data. The power of bioinformatics to cluster by similarity is related to the number of samples included in the ana-lysis, the disease stratification and how consistent the in-dividuals are within a profile. We acknowledge that the data presented here needs to be followed by expanded sampling of more disease states and healthy volunteers. However, the technical approach used (whole blood flow cytometry with cell quantitation), combined with a con-sensus antibody and gating strategy, could be used to es-tablish a comprehensive analysis of peripheral blood immunity with thousands of patients and healthy volun-teers to extract novel relationships between immunity and disease. The strength of our study results from 1) direct staining of fresh un-manipulated whole blood, 2) the use of an unbiased approach looking at multiple im-mune markers, 3) reporting cell populations as cell counts (cells/μl) to enumerate populations more accur-ately, and 4) a data set of healthy volunteer to determine the degree of change of immune markers. By combining these principles with standard gating strategies and pa-tient health annotation, a large multi-institutional data-base could be established to provide a powerful resource for understanding human immunology.
Our description of different diseases sharing immune profiles has direct implications on the development and evaluation of immune modulating drugs. Patients likely have one of several distinct immune profiles influenced by their underlying disease, yet with a distinct response to immune modulating drugs correlating more to their immune profile than to the underlying disease. There-fore, it may be more informative to develop immune modulating drugs based on immune profiles rather than disease pathology.
well as characterization of other disease states (auto-immunity, wound repair, etc) will be required to fully test this concept. We don’t know if these states repre-sent an active pathology within the disease or if they are biomarkers secondary to the pathology. Like any new method to identify biomarkers, this system will require testing to validate this approach.
Lastly, this work is limited to the immune markers used to describe the system. Further work is needed to characterize the markers that impact the clustering of the immune profiles. Likewise, addition of chemokines, cytokines or other global measures of immunity could add to this analysis. Like all clustering approaches, a few of the markers play a large role in identification of the
profiles. The CD14+HLA-DRlo/negimmune marker
segre-gated independently and inversely from CD4+ T cells. The inverse relationship between these two cells types has not been explicitly described before and these results suggest
that the CD4/CD14+HLA-DRlo/neg monocyte ratio is an
important biomarker for cancer prognosis. Further valid-ation in future prospective clinical trials will be required. The advantages of viewing the whole immune system, the identification of shared immunity across diagnosis, and the potential for the discovery of novel relationships within the immune system should drive studies to de-scribe the number and function of immune profiles.
Conclusions
We have developed a method to comprehensively describe peripheral blood immunity using whole blood quantitative flow cytometery combined with bioinformatics. This ap-proach provided a fresh perspective of immunity, allowing reconstruction of the absolute and relative distribution of leuckocytes. Organizing patients according to their under-lying immune similarities (immune profiles) was prognos-tic independent of their underlying disease. Clustering identified relationships between luekcocytes populations supporting hypothesis development around these popula-tions. For example, Lineage-HLA-DR-CD33+ myeloid de-rived suppressor cells (MDSCs) clustered independently of
granulocytes, monocytes and CD14+HLA-DRneg cells
suggesting independent regulation. Clustering was used to identify a novel prognostic biomarker using CD14
+
HLA-DR-and CD4+cells. We believe that
comprehen-sive immune profiling as described has the potential to rapidly accelerate the development of immune modula-tory therapies.
Additional files
Additional file 1: Table S1.Patient demographics.
Additional file 2: Figure S1.Age of healthy volunteers and patients. Box and whisker plots show the mean, 25thand 75thpercentile, and the range of ages for each cohort. HV- healthy volunteers;
GBM-glioblastoma multiforme; NHL-non Hodgkin’s lymphoma; RCC-renal cell carcinoma; OVA-ovarian cancer; ALI- acute lung injury. Asterisk indicates = p < 0.05 vs. HV.
Additional file 3: Table S2.Antibodies and reagents used for flow cytometry.
Additional file 4: Figure S2.Hierarchical clustering of ovarian cancer patients. OVA patients were subject to profiling analysis as in Figure 1. Identification of major clusters is indicated at left. A row represents one subject and a column represents one of ten markers measured. The horizontal bar below each plot indicates immune markers decreased (blue) or increased (red) over the mean of the healthy volunteer cohort. (n = 17 OVA and n = 40 HV).
Additional file 5: Figure S3.Survival of patients categorized by immune profile. GBM, NHL, RCC, or ALI patients were categorized to a profile in Figure 1. For each disease, cohorts of patients sharing a profile were plotted for their survival. Note: only profiles with more than three individuals were plotted.
Additional file 6: Table S3.P values of the differences in phenotype expression between each immune profile.
Additional file 7: Table S4.Frequency of phenotypes for each pathology in this study.
Additional file 8: Figure S4.Immune profile dependent differences in the number of leukocytes and mononuclear cells perμL of blood. Numerical representation of pie charts represented in Figure 3C. Box and whisker plots show the mean, 25thand 75thpercentile, and the range of cell counts for each cohort. Differences (p < 0.0001) compared to profile 1 are indicated by ** above the profile.
Additional file 9: Figure S5.Gating strategy for CD14+HLA-DRlo/neg monocytes. After preparing the samples for CD14 and HLA-DR whole blood flow cytometry, a gate was placed on the intermediate side scatter and forward scatter cell population. A second gate on cells with low forward scatter and CD14+ was placed. A bivariate plot of CD14 vs. HLA-DR was created. The fraction of the cells in the HLA-DRlo/negis recorded. A representative plot from a normal healthy volunteer and patient are shown.
Abbreviations
GBM:Glioblastoma multiforma; NHL: Non-Hodgkin’s lymphoma; RCC: Renal cell carcinoma; Treg: Regulatory T cells; OVA: Ovarian cancer patients; ALI: Acute lung injury; T: T lymphocytes; B: B lymphocytes; NK: Natural killer cells; HV: Healthy volunteers; DEX: Dexamethasone; PBMC: Peripheral blood mononuclear cells.
Competing interests
MP Gustafson, Y Lin, and AB Dietz have applied for a patent regarding this technology. No other authors have a conflict or competing interest in this manuscript.
Authors’contributions
MPG designed study, performed research, analyzed data and wrote manuscript, YL collected data, analyzed data and edited the paper, BLP performed statistical analysis, CJL collected the data, MLM, collected and audited the data, SCL provided critical insight into gating and whole blood flow expertise, PRB provided patient access and diagnosis, RSA provided critical flow cytometry expertise and edited the paper, MKT provided collected data and provided patient access, EDK provided patient access, edited the paper, DAG wrote and edited the paper, and ABD designed the research, and wrote and edited the paper. All authors read and approved the final manuscript.
Acknowledgments
in part by the Predolin Foundation, and a grant from the Department of Lab Medicine and Pathology, Mayo Clinic. We would like to thank the patients and healthy volunteers for participating in the study.
Author details 1
Human Cellular Therapy Laboratory, Division of Transfusion Medicine, Department of Laboratory Medicine and Pathology, Mayo Clinic, 200 First Street, Rochester, MN, USA.2Division of Hematology, Department of Medicine, Mayo Clinic, 200 First Street, Rochester, MN, USA.3Biomedical Statistics and Informatics, Mayo Clinic, 200 First Street, Rochester, MN, USA. 4Cellular and Molecular Immunology, Department of Laboratory Medicine
and Pathology, Mayo Clinic, 200 First Street, Rochester, MN, USA.5Pulmonary and Critical Care Medicine, Mayo Clinic, 200 First Street, Rochester, MN, USA. 6
Department of Urology, Mayo Clinic, 200 First Street, Rochester, MN, USA.
Received: 19 December 2012 Accepted: 15 April 2013 Published: 27 June 2013
References
1. Davis MM:A prescription for human immunology.Immunity2008,29:835–838. 2. Maecker HT, McCoy JP, Nussenblatt R:Standardizing immunophenotyping for the human immunology project.Nat Rev Immunol2012,12:191–200. 3. Palmer C, Diehn M, Alizadeh AA, Brown PO:Cell-type specific gene
expression profiles of leukocytes in human peripheral blood.
BMC Genomics2006,16:115.
4. de Jager W, Bourcier K, Rijkers GT, Prakken BJ, Seyfert-Margolis V:
Prerequisites for cytokine measurements in clinical trials with multiplex immunoassays.BMC Immunol2009,10:52.
5. Kohrt HE, Nouri N, Nowels K, Johnson D, Holmes S, Lee P:Profile of immune cells in axillary lymph nodes predicts disease-free survival in breast cancer.PLoS Med2005,2:e284.
6. Autissier P, Soulas C, Burdo TH, Williams KC:Evaluation of a 12-color flow cytometry panel to study lymphocyte, monocyte, and dendritic cell subsets in humans.Cytometry A2010,77:410–419.
7. Longo DM, Louie B, Putta S,et al:Single-cell network profiling of peripheral blood mononuclear cells from healthy donors reveals age-and race-associated differences in immune signaling pathway activation.
J Immunol2012,188:1717–1725.
8. Gustafson MP, Lin Y, New KC, Bulur PA, O'Neill BP, Dietz AB:Systemic immune suppression in glioblastoma: the interplay between CD14 + HLA-DRlo/neg monocytes, tumor factors, and dexamethasone.
Neuro Oncol2010,12:631–644.
9. Lin Y, Gustafson MP, Bulur PA, Gastineau DA, Witzig TE, Dietz AB:
Immunosuppressive CD14 + HLA-DR(low)/- monocytes in B-cell non-Hodgkin lymphoma.Blood2011,117:872–881.
10. Iscimen R, Cartin-Ceba R, Yilmaz M,et al:Risk factors for the development of acute lung injury in patients with septic shock: an observational cohort study.Crit Care Med2008,36:1518–1522.
11. Bernard GR, Artigas A, Brigham KL,et al:Report of the American-European consensus conference on ARDS: definitions, mechanisms, relevant outcomes and clinical trial coordination. The Consensus Committee.
Am J Crit Care Med1994,20:225–232.
12. Bauer PR, Kashyap R, Abraham RS, Peikert T, Gajic O:Accuracy of waste blood measurement in critically ill patients.Intensive Care Med2011,
37:721–722.
13. Appay V, Reynard S, Voelter V, Romero P, Speiser DE, Leyvraz S: Immuno-monitoring of CD8+ T cells in whole blood versus PBMC samples.
J Immunol Methods2006,309:192–199.
14. Contal C, O'Quigley J:An application of changepoint methods in studying the effect of age on survival in breast cancer.Comput Stat Data Anal1999,30:253–270.
15. Banham AH:Cell-surface IL-7 receptor expression facilitates the purification of FOXP3(+) regulatory T cells.Trends Immunol2006,
27:541–544.
16. Rittirsch D, Flierl MA, Ward PA:Harmful molecular mechanisms in sepsis.
Nat Rev Immunol2008,8:776–787.
17. Moore FA, Sauaia A, Moore EE, Haenel JB, Burch JM, Lezotte DC:Postinjury multiple organ failure: a bimodal phenomenon.J Trauma1996,
40(4):501–510.
18. Gustafson MP, Abraham RS, Lin Y,et al:Association of an increased frequency of CD14(+) HLA-DR(lo/neg) monocytes with decreased time
to progression in chronic lymphocytic leukaemia (CLL).Br J Haematol 2012,156:674–676.
19. Filipazzi P, Valenti R, Huber V,et al:Identification of a new subset of myeloid suppressor cells in pheripheral blood of melanoma patients with modulation by a granulocyte-macrophage colony-stimulation factor-based antitumor vaccine.J Clin Oncol2007,25:2546–2553. 20. Walter S, Weinschenk T, Stenzl A,et al:Multipeptide immune response to
cancer vaccine IMA901 after single-dose cyclophosphamide associates with longer patient survival.Nat Med2012,18:1254–1261.
21. Porrata LF, Inwards DJ, Ansell SM,et al:Early lymphocyte recovery predicts superior survival after autologous stem cell transplantation in non-Hodgkin lymphoma: a prospective study.Biol Blood Marrow Transplant 2008,14:807–816.
22. Ege H, Gertz MA, Markovic SN,et al:Prediction of survival using absolute lymphocyte count for newly diagnosed patients with multiple myeloma: a retrospective study.Br J Haematol2008,141:792–798.
23. Coventry BJ, Ashdown ML, Quinn MA, Markovic SN, Yatomi-Clarke SL, Robinson AP:CRP identifies homeostatic immune oscillations in cancer patients: a potential treatment targeting tool?J Transl Med2009,7:102. 24. Gfeller D, De Los Rios P, Caflisch A, Rao F:Complex network analysis of
free-energy landscapes.Proc Nat Acad Sci USA2007,104:1817–1822. 25. Xiao W, Mindrinos MN, Seok J,et al:A genomic storm in critically injured
humans.J Exp Med2011,208:2581–2590.
doi:10.1186/2051-1426-1-7
Cite this article as:Gustafsonet al.:Immune monitoring using the predictive power of immune profiles.Journal for ImmunoTherapy of Cancer20131:7.
Submit your next manuscript to BioMed Central and take full advantage of:
• Convenient online submission
• Thorough peer review
• No space constraints or color figure charges
• Immediate publication on acceptance
• Inclusion in PubMed, CAS, Scopus and Google Scholar
• Research which is freely available for redistribution