R ES EAR CH
Open Access
Gene expression analysis in response to osmotic
stimuli in the intervertebral disc with DNA
microarray
Wenzhi Zhang, Xu Li
*, Xifu Shang, Qichun Zhao, Yefeng Hu, Xiang Xu, Rui He, Liqun Duan and Feng Zhang
Abstract
Background:Intervertebral disc (IVD) cells experience a broad range of physicochemical stimuli under physiologic conditions, including alterations in their osmotic environment. At present, the molecular mechanisms underlying osmotic regulation in IVD cells are poorly understood. This study aims to screen genes affected by changes in osmotic pressure in cells of subjects aged 29 to 63 years old, with top-scoring pair (TSP) method.
Methods:Gene expression data set GSE1648 was downloaded from Gene Expression Omnibus database, including four hyper-osmotic stimuli samples, four iso-osmotic stimuli samples, and three hypo-osmotic stimuli samples. A novel, simple method, referred to as the TSP, was used in this study. Through this method, there was no need to perform data normalization and transformation before data analysis.
Results:A total of five pairs of genes ((CYP2A6,FNTB), (PRPF8,TARDBP), (RPS5,OAZ1), (SLC25A3, NPM1) and (CBX3,
SRSF9)) were selected based on the TSP method. We inferred that all these genes might play important roles in response to osmotic stimuli and age in IVD cells. Additionally, hyper-osmotic and iso-osmotic stimuli conditions were adverse factors for IVD cells.
Conclusions:We anticipate that our results will provide new thoughts and methods for the study of IVD disease. Keywords:Intervertebral disc, Top-scoring pair, Osmotic pressure, Osmotic stimuli
Background
Intervertebral disc (IVD) disease is a frequent surgical disease characterized by a series of deleterious changes in cellularity that lead to loss of extracellular matrix structure, altered biomechanical loading, and symptomatic pain [1]. Although studies of biological therapeutics for IVD disease have been ongoing over a decade, few treatments have progressed to clinical testing and none is current commercially available [2-4]. This may be, primarily, due to a limited understanding of disease etiology. Therefore, further work is needed to explore its pathogenesis from early to later stages.
The IVD, an avascular and lymphatic tissue, is composed of different zones, including the annulus fibrosus, the nucleus pulposus, and the transition zone [5]. The IVD cells can secrete a complex extracellular matrix containing
lots of water and negatively charged proteoglycans, which confer a net negative charge on the tissue and give the tissue a higher extracellular osmolarity than other tissues [6,7]. Previous studies have shown that IVD cells respond strongly to changes in the osmotic environment by altering mRNA expression [8]. In particular, the genes encoding proteins related to ion transport, cytoskeletal organization, growth factors, and cytokines have been demonstrated to show different regulation response to osmotic conditions in IVD cells [6,9,10]. Meanwhile, both hyper- and hypo-osmotic conditions can induce changes of cell volume and calcium signaling in IVD cells [11,12]. However, the molecular mechanisms involved in the response of IVD cells to osmotic pressure are still not clearly understood.
In the present study, gene expression profile data of IVD cells exposed to iso-osmotic, hyper-osmotic, and hypo-osmotic conditions were downloaded. Top scoring pair (TSP) is a novel, simple statistical method that can * Correspondence:[email protected]
Department of Orthopaedics, Anhui Provincial Hospital, No. 17, Road Lujiang, Hefei 230001, China
© 2013 Zhang et al.; licensee BioMed Central Ltd. This is an open access article distributed under the terms of the Creative Commons Attribution License (http://creativecommons.org/licenses/by/2.0), which permits unrestricted use, distribution, and reproduction in any medium, provided the original work is properly cited.
etiology. Therefore, further work is needed to explore its pathogenesis from early to later stages.
The IVD, an avascular and lymphatic tissue, is composed of different zones, including the annulus fibrosus, the nucleus pulposus, and the transition zone [5]. The IVD treatments have progressed to clinical testing and none is current commercially available [2-4]. This may be, primarily, due to a limited u
etiology. Therefore, further work is needed to explore its pathogenesis from early to later stages.
pain [1]. Although studies of biological therapeutics for IVD disease have been ongoing over a decade, few treatments have progressed to clinical testing and none is current commercially available [2-4]. This may be, in cellularity that lead to loss of extracellular matrix structure, altered biomechanical loading, and symptomatic pain [1]. Although studies of biological therapeutics for IVD disease have been ongoing over a decade, few treatments have progressed to clinical testing and none Intervertebral disc (IVD) disease is a frequent surgical disease characterized by a series of deleterious changes in cellularity that lead to loss of extracellular matrix structure, altered biomechanical loading, and symptomatic
Intervertebral disc, Top-scoring pair, Osmotic pressure, Osmotic stimuli
Intervertebral disc (IVD) disease is a frequent surgical
We anticipate that our results will provide new thoughts and methods for the study of IVD disease. Intervertebral disc, Top-scoring pair, Osmotic pressure, Osmotic stimuli
)) were selected based on the TSP method. We inferred that all these genes might play important roles in response to osmotic stimuli and age in IVD cells. Additionally, hyper-osmotic and iso-osmotic stimuli conditions
We anticipate that our results will provide new thoughts and methods for the study of IVD disease. perform data normalization and transformation before data analysis.
PRPF8 TARDBP
)) were selected based on the TSP method. We inferred that all these genes might play important roles in response to osmotic stimuli and age in IVD cells. Additionally, hyper-osmotic and iso-osmotic stimuli conditions
Gene expression data set GSE1648 was downloaded from Gene Expression Omnibus database, including four hyper-osmotic stimuli samples, four iso-osmotic stimuli samples, and three hypo-osmotic stimuli samples. A novel, simple method, referred to as the TSP, was used in this study. Through this method, there was no need to conditions, including alterations in their osmotic environment. At present, the molecular mechanisms underlying osmotic regulation in IVD cells are poorly understood. This study aims to screen genes affected by changes in osmotic pressure in cells of subjects aged 29 to 63 years old, with top-scoring pair (TSP) method.
Gene expression data set GSE1648 was downloaded from Gene Expression Omnibus database, including four hyper-osmotic stimuli samples, four iso-osmotic stimuli samples, and three hypo-osmotic stimuli samples. A
Intervertebral disc (IVD) cells experience a broad range of physicochemical stimuli under physiologic conditions, including alterations in their osmotic environment. At present, the molecular mechanisms underlying osmotic regulation in IVD cells are poorly understood. This study aims to screen genes affected by changes in
Intervertebral disc (IVD) cells experience a broad range of physicochemical stimuli under physiologic
classify gene pairs into relevant classes based on their scores [13-15]. In this study, the TSP method was used to screen the pairs of differentially expressed genes in different osmotic stimuli conditions. Our findings might shed new light on the molecular mechanisms of human IVD disease.
Methods
Gene expression data
Expression profiling of GSE1648 [9] was downloaded from Gene Expression Omnibus (GEO, http://www.ncbi.nlm. nih.gov/geo/), based on GPL96 [HG-U133A] Affymetrix Human Genome U133A Array. A total of 11 human IVD tissue samples were collected, including four hyper-osmotic stimuli samples (ages: 63, 62, 50, and 29, respect-ively), four iso-osmotic stimuli samples (ages: 63, 62, 50, and 29, respectively) and three hypo-osmotic stimuli samples (ages: 63, 50, and 29, respectively).
Top-Scoring Pair (TSP)
Recently, gene pair response to environmental changes has been assessed using the TSP method, which is based on pair-wise comparisons of gene expression values within each tissue microarray [16]. Distinction between two clas-ses depended on the gene pairs with the highest ranking value (called “score”). In the current study, the higher score of the gene pairs indicated the stronger correlation between the expression values of gene-pairs and tissues.
Algorithm overview of the TSP method
Detailed information about the TSP method was de-scribed by Geman et al. [16]. Here, we give a brief and intuitive description of this method. A gene expression profile consists of G genes and N samples (i.e., hypo-osmotic) participating in the training micro-array dataset. The data is represented as a G × N matrix, in which the expression value of gth gene from the nth sample is de-noted as“Xgn”. Each column represents a gene expression profile of G genes and each row represents observations of a particular gene over N samples. Each sample has a class label of either 1 or 2. For the simplicity of calcula-tions, it is assumed that there are only two classes, and we assume that samples 1 to N1 (N1 < N) are labeled as class 1 (e.g., hyper-osmotic) and samples (N1 + 1) to N are labeled as class 2 (e.g., iso-osmotic). For each pair of genes (i, j), two probabilities are calculated aspij(1) andpij(2):
pijð Þ ¼1 1 N1
XN1
n¼1
I X
in<Xjn
ð Þ;
pijð Þ ¼2 1 N−N1
XN
n¼N1þ1 I X
in<Xjn
ð Þ
I(Xin < Xjn)is the indicator function defined as:
IðXin<XjnÞ¼
1; if Xð in<XjnÞ
0; if Xð in>XjnÞn¼1;2…N:
TSP is a rank-based method, so for each pair of genes (i, j), the“score”denoted asΔijis calculated as follows:
Δij¼pijð Þ1 −pijð Þ2
In other words, pij(1) (or pij(2), respectively) is the estimated probability of observing Xiless than Xjin class 1 (or class 2). Δijis the absolute value of the difference betweenpij(1) andpij(2) and represents the difference of pairs of genes (i, j) between class 1 and class 2. In this study, the larger theΔij(close to 1), the greater the differ-ence of pairs of genes (i, j) between class 1 and class 2, indicating that pairs of genes (i, j) may be related to the tissues. Meanwhile, Δij >0.6 was set as cut-off criteria. In addition, the TSP method focuses on gene-pair (i, j) matching between two classes.
In the present study, we divided the samples into three groups: osmotic vs. hypo-osmotic group, hyper-osmotic vs. iso-hyper-osmotic group, and iso-hyper-osmotic vs. hypo-osmotic group.
Osmotic pressure,age, and related genes
To reduce the false positive rate, we analyzed the potential relationship between age and osmotic pressure based on theΔijscore. All pairs of genes with the largest score (Δij= 0.75) and that repeatedly appeared in the three groups (≥2) were selected. Then, the expression level of gene pairs from hyper-osmotic stimuli samples with the ages of 63, 62, 50, and 29 was analyzed, respectively, as was the expression of iso-osmotic stimuli samples (ages: 63, 62, 50, and 29, respectively) and hypo-osmotic stimuli samples (ages: 63, 50, and 29, respectively), in order to present a tendency of gene expression along with age.
Results
Osmotic pressure and related genes
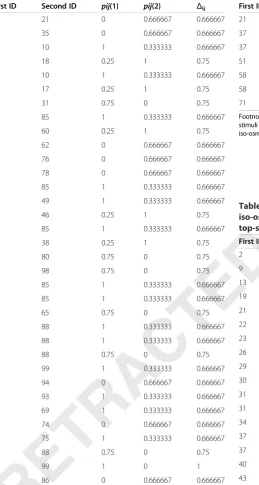
Based on the TSP method, a total of 65 gene pairs were selected from the three groups, including 34 gene pairs in the hyper-osmotic vs. hypo-osmotic group (Table 1), 7 in hyper-osmotic vs. iso-osmotic group (Table 2), and 24 in iso-osmotic vs. hypo-osmotic group (Table 3). For the hyper-osmotic vs. hypo-osmotic group (Table 1), a total of 34 gene pairs were obtained with Δij >0.6, in-cluding a gene pair with Δij= 1, 11 gene pairs with Δij=
0.75, and 22 gene pairs with Δij = 0.666667. For the
hyper-osmotic vs. iso-osmotic group (Table 2), a total of 7 gene pairs were obtained with Δij >0.6 and the Δij were all = 0.75. For the iso-osmotic vs. hypo-osmotic group (Table 3), a total of 24 gene pairs were obtained atΔij>0.6, including a gene pair withΔij= 1, 7 withΔij= 0.75, and 16 withΔij= 0.666667.
tions, it is assumed that there are only two classes, and we assume that samples 1 to N1 (N1 < N) are labeled as class 1 (e.g., hyper-osmotic) and samples (N1 + 1) to N are labeled as class 2 (e.g., iso-osmotic). For each pair of genes (i, j), two probabilities are calculated as
profile of G genes and each row represents observations of a particular gene over N samples. Each sample has a class label of either 1 or 2. For the simplicity of calcula-tions, it is assumed that there are only two classes, and we assume that samples 1 to N1 (N1 < N) are labeled as class 1 (e.g., hyper-osmotic) and samples (N1 + 1) to N are expression value of g
. Each column represents a gene expression profile of G genes and each row represents observations of a particular gene over N samples. Each sample has a class label of either 1 or 2. For the simplicity of calcula-osmotic) participating in the training micro-array dataset. The data is represented as a G × N matrix, in which the expression value of gth gene from the n
. Each column represents a gene expression profile of G genes and each row represents observations is method. A gene expression profile consists of G genes and N samples (i.e., hypo-osmotic) participating in the training micro-array dataset. The data is represented as a G × N matrix, in which the
gene from the n
Detailed information about the TSP method was de-scribed by Geman et al. [16]. Here, we give a brief and is method. A gene expression profile consists of G genes and N samples (i.e., hypo-score of the gene pairs indicated the stronger correlation between the expression values of gene-pairs and tissues.
Detailed information about the TSP method was de-ses depended on the gene pairs with the highest ranking ). In the current study, the higher score of the gene pairs indicated the stronger correlation between the expression values of gene-pairs and tissues.
relationship between age and osmotic pressure based on the
each tissue microarray [16]. Distinction between two clas-ses depended on the gene pairs with the highest ranking
osmotic group.
Osmotic pressure
To reduce the false positive rate, we analyzed the potential relationship between age and osmotic pressure based In the present study, we divided the samples into three groups: osmotic vs. hypo-osmotic group, hyper-osmotic vs. iso-hyper-osmotic group, and iso-hyper-osmotic vs. hypo-osmotic group.
tissues. Meanwhile, Δ
In addition, the TSP method focuses on gene-pair (i, j) matching between two classes.
In the present study, we divided the samples into three groups: osmotic vs. hypo-osmotic group, hyper-(close to 1), the greater the differ-ence of pairs of genes (i, j) between class 1 and class 2, indicating that pairs of genes (i, j) may be related to the >0.6 was set as cut-off criteria. In addition, the TSP method focuses on gene-pair (i, j) of pairs of genes (i, j) between class 1 and class 2. In this (close to 1), the greater the differ-ence of pairs of genes (i, j) between class 1 and class 2, indicating that pairs of genes (i, j) may be related to the is the absolute value of the difference (2) and represents the difference of pairs of genes (i, j) between class 1 and class 2. In this (2) and represents the difference of pairs of genes (i, j) between class 1 and class 2. In this (close to 1), the greater the differ-ence of pairs of genes (i, j) between class 1 and class 2,
less than X
Age and related genes
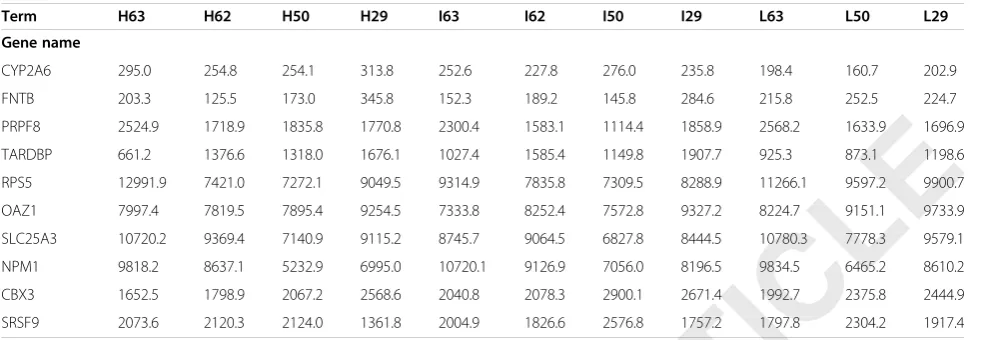
As shown in Table 4, a total of five gene pairs might have potential relationships between age and osmotic
pressure, including (CYP2A6,FNTB), (PRPF8,TARDBP),
(RPS5,OAZ1), (SLC25A3,NPM1), and (CBX3,SRSF9).
For the (CYP2A6, FNTB) pair, at the ages of 50–63,
the gene expression value of CYP2A6 was more than
Table 1 The screening results of pairs of genes in hyper-osmotic vs. hypo-osmotic group based on the top-scoring pair method
First ID Second ID pij(1) pij(2) Δij
1 21 0 0.666667 0.666667
1 35 0 0.666667 0.666667
5 10 1 0.333333 0.666667
8 18 0.25 1 0.75
9 10 1 0.333333 0.666667
13 17 0.25 1 0.75
23 31 0.75 0 0.75
23 85 1 0.333333 0.666667
29 60 0.25 1 0.75
29 62 0 0.666667 0.666667
29 76 0 0.666667 0.666667
30 78 0 0.666667 0.666667
31 85 1 0.333333 0.666667
32 49 1 0.333333 0.666667
33 46 0.25 1 0.75
34 85 1 0.333333 0.666667
37 38 0.25 1 0.75
40 80 0.75 0 0.75
45 98 0.75 0 0.75
51 85 1 0.333333 0.666667
57 85 1 0.333333 0.666667
58 65 0.75 0 0.75
58 88 1 0.333333 0.666667
61 88 1 0.333333 0.666667
62 88 0.75 0 0.75
62 99 1 0.333333 0.666667
63 94 0 0.666667 0.666667
65 93 1 0.333333 0.666667
67 69 1 0.333333 0.666667
68 74 0 0.666667 0.666667
72 75 1 0.333333 0.666667
76 88 0.75 0 0.75
76 99 1 0 1
80 86 0 0.666667 0.666667
Footnote: First ID represents genes in intervertebral disc cells with hyper-osmotic stimuli. Second ID represents genes in intervertebral disc cells with
hypo-osmotic stimuli.
Table 2 The screening results of pairs of genes in hyper-osmotic vs. iso-osmotic group based on the top-scoring pair method
First ID Second ID pij(1) pij(2) Δij
21 41 0 0.75 0.75
37 51 0.75 0 0.75
37 85 1 0.25 0.75
51 84 0 0.75 0.75
58 65 0.75 0 0.75
58 68 0.75 0 0.75
71 92 0.75 0 0.75
Footnote: First ID represents genes in intervertebral disc cells with hyper-osmotic stimuli conditions. Second ID represents genes in intervertebral disc cells with iso-osmotic stimuli conditions.
Table 3 The screening results of pairs of genes in iso-osmotic vs. hypo-osmotic group based on the top-scoring pair method
First ID Second ID pij(1) pij(2) Δij
2 8 1 0.333333 0.666667
9 10 1 0.333333 0.666667
13 17 0.25 1 0.75
19 41 1 0.333333 0.666667
21 41 0.75 0 0.75
22 54 1 0.333333 0.666667
23 85 1 0.333333 0.666667
26 36 1 0.333333 0.666667
29 62 0 0.666667 0.666667
30 78 0 0.666667 0.666667
31 84 1 0.333333 0.666667
31 85 1 0.333333 0.666667
34 45 0 0.666667 0.666667
37 45 0 1 1
37 51 0 0.666667 0.666667
40 84 1 0.333333 0.666667
43 45 0 0.666667 0.666667
45 98 0.75 0 0.75
49 66 0 0.666667 0.666667
49 96 0.25 1 0.75
51 84 0.75 0 0.75
58 76 0.25 1 0.75
70 71 1 0.333333 0.666667
71 97 0.25 1 0.75
Footnote: First ID represents genes in intervertebral disc cells with iso-osmotic stimuli. Second ID represents genes in intervertebral disc cells with hyper-osmotic stimuli.
76 99 1 0 1
80 86 0 0.666667 0.666667
Footnote: First ID represents genes in intervertebral disc cells with hyper-osmotic stimuli. Second ID represents genes in intervertebral disc cells with
hypo-osmotic stimuli.
72 75 1 0.333333 0.666667
76 88 0.75 0 0.75
76 99 1 0 1
80 86 0 0.666667 0.666667
67 69 1 0.333333 0.666667
68 74 0 0.666667 0.666667
72 75 1 0.333333 0.666667
63 94 0 0.666667 0.666667
65 93 1 0.333333 0.666667
67 69 1 0.333333 0.666667
68 74 0 0.666667 0.666667
62 88 0.75 0 0.75
62 99 1 0.333333 0.666667
63 94 0 0.666667 0.666667
65 93 1 0.333333 0.666667
58 88 1 0.333333 0.666667
61 88 1 0.333333 0.666667
62 88 0.75 0 0.75
51 85 1 0.333333 0.666667
57 85 1 0.333333 0.666667
58 65 0.75 0 0.75
58 88 1 0.333333 0.666667
45 98 0.75 0 0.75
51 85 1 0.333333 0.666667
57 85 1 0.333333 0.666667
13 17 0.25 1 0.75
19 41 1 0.333333 0.666667
First ID Second ID
2 8 1 0.333333 0.666667
9 10 1 0.333333 0.666667
13 17 0.25 1 0.75
Table 3 The screening results of pairs of genes in iso-osmotic vs. hypo-osmotic group based on the top-scoring pair method
First ID Second ID
Table 3 The screening results of pairs of genes in
stimuli conditions. Second ID represents genes in intervertebral disc cells with Footnote: First ID represents genes in intervertebral disc cells with hyper-osmotic stimuli conditions. Second ID represents genes in intervertebral disc cells with
71 92 0.75 0 0.75
Footnote: First ID represents genes in intervertebral disc cells with hyper-osmotic stimuli conditions. Second ID represents genes in intervertebral disc cells with
58 65 0.75 0 0.75
58 68 0.75 0 0.75
71 92 0.75 0 0.75
37 51 0.75 0 0.75
37 85 1 0.25 0.75
51 84 0 0.75 0.75
that of FNTB in both hyper-osmotic and iso-osmotic stimuli samples, and the situation was reversed in the hypo-osmotic stimuli samples. However, at age 29, the gene expression value of CYP2A6 was always less than that ofFNTB.
For the (PRPF8,TARDBP) pair, at the ages of 29–63, the expression value ofPRPF8was more than that ofTARDBP in both hyper-osmotic and hypo-osmotic stimuli samples. In iso-osmotic stimuli samples, the expression level of PRPF8was similar to that ofTARDBP.
For the (RPS5, OAZ1) pair, at the ages of 29–62, the expression level of RPS5 was always lower than that of OAZ1 in both hyper-osmotic and iso-osmotic stimuli samples; however, the situation was reversed at the age of 63. Meanwhile, in hypo-osmotic stimuli samples, the expression level of RPS5 was always higher than that ofOAZ1.
For the (SLC25A3, NPM1) pair, the gene expression values were reversed in different osmotic pressure. At the ages of 29–63, the gene expression value of SLC25A3 was always larger than that of NPM1 in both hyper-osmotic and hypo-osmotic stimuli samples. Meanwhile, the situation was reversed in the iso-osmotic stimuli samples except at the age of 29.
For the (CBX3, SRSF9) pair, at the ages of 29–63, the gene expression value of CBX3 was always larger than that of SRSF9 in both iso-osmotic and hypo-osmotic stimuli samples. However, in the hyper-osmotic stimuli samples, the gene expression value of CBX3 was more than that ofSRSF9at the age of 29 and the situation was reversed at the age of 50–63.
All these results indicated that the expression level of these gene pairs ((CYP2A6, FNTB), (PRPF8,TARDBP), (RPS5,OAZ1), (SLC25A3,NPM1) and (CBX3,SRSF9)) at different osmotic pressures did not change at an early age, but was reversed in old age.
Discussion
In the current study, it was shown that five gene pairs might be involved in the potential interaction between osmotic pressure and age, (CYP2A6, FNTB), (PRPF8, TARDBP), (RPS5,OAZ1), (SLC25A3,NPM1) and (CBX3, SRSF9). The expression level of the five gene pairs was not influenced by the changes in osmotic pressure at an early age, but was influenced in old age. These results suggest that these gene pairs may be associated with the regulation mechanism of the senescence of IVD tissue and that the IVD tissue of aged people may be sensitive to the changes in osmotic pressure as a result of wearing and aging.
Cytochrome P450 2A6 (CYP2A6) is a member of the cytochrome P450 (CYP) mixed-function oxidase system, which is involved in the oxidation of nicotine and cotinine, and the metabolism of several pharmaceuticals, carcino-gens, and coumarin-type alkaloids [17-20]. It has been reported that CYPmay be involved in the activation of caspase 12 that acts directly on the cell and mediates the effector caspase 3 resulting in apoptosis [21]. The FNTB gene encodes the protein farnesyltransferase subunit beta which plays an important role in protein farnesylation, regulation of cell proliferation, microtubule complex, and protein farnesyltransferase complex [22,23]. In addition, we found the expression value of theFNTBgene was less than that of theCYP2A6gene both in hyper-osmotic and iso-osmotic conditions at an old age. Therefore, we inferred that theFNTBgene and theCYP2A6gene may play oppos-ite roles in IVD cells and that the hyper-osmotic conditions at an old age may be a negative factor for IVD cells.
PRPF8, together withPRPF3 andPRFP31, encodes spli-cing factors and accounts for approximately 15% of families with autosomal dominant retinitis pigmentosa in the UK [24]. No report has revealed an association between the expression ofPRPF8and IVD. Meanwhile,TARDBP,
Table 4 The screening result of osmotic stimuli and age in intervertebral disc cells
Term H63 H62 H50 H29 I63 I62 I50 I29 L63 L50 L29
Gene name
CYP2A6 295.0 254.8 254.1 313.8 252.6 227.8 276.0 235.8 198.4 160.7 202.9
FNTB 203.3 125.5 173.0 345.8 152.3 189.2 145.8 284.6 215.8 252.5 224.7
PRPF8 2524.9 1718.9 1835.8 1770.8 2300.4 1583.1 1114.4 1858.9 2568.2 1633.9 1696.9
TARDBP 661.2 1376.6 1318.0 1676.1 1027.4 1585.4 1149.8 1907.7 925.3 873.1 1198.6
RPS5 12991.9 7421.0 7272.1 9049.5 9314.9 7835.8 7309.5 8288.9 11266.1 9597.2 9900.7
OAZ1 7997.4 7819.5 7895.4 9254.5 7333.8 8252.4 7572.8 9327.2 8224.7 9151.1 9733.9
SLC25A3 10720.2 9369.4 7140.9 9115.2 8745.7 9064.5 6827.8 8444.5 10780.3 7778.3 9579.1
NPM1 9818.2 8637.1 5232.9 6995.0 10720.1 9126.9 7056.0 8196.5 9834.5 6465.2 8610.2
CBX3 1652.5 1798.9 2067.2 2568.6 2040.8 2078.3 2900.1 2671.4 1992.7 2375.8 2444.9
SRSF9 2073.6 2120.3 2124.0 1361.8 2004.9 1826.6 2576.8 1757.2 1797.8 2304.2 1917.4
Footnote: (1) H, I, L represent hyper-osmotic stimuli, iso-osmotic stimuli, and hypo-osmotic stimuli, respectively. (2) The number of H/I/L represents the age. (3) The data in the table is the expression value of each gene in different osmotic stimuli conditions and ages.
stimuli samples except at the age of 29. For the (
gene expression value of that of SRSF9
stimuli samples. However, in the hyper-osmotic stimuli was always larger than that of
both hyper-osmotic and hypo-osmotic stimuli samples. Meanwhile, the situation was reversed in the iso-osmotic stimuli samples except at the age of 29.
CBX3
gene expression value of
values were reversed in different osmotic pressure. At the ages of 29
was always larger than that of
both hyper-osmotic and hypo-osmotic stimuli samples. Meanwhile, the situation was reversed in the iso-osmotic NPM1) pair, the gene expression values were reversed in different osmotic pressure. 63, the gene expression value of was always larger than that of
age of 63. Meanwhile, in hypo-osmotic stimuli samples, RPS5 was always higher than
) pair, the gene expression values were reversed in different osmotic pressure. was always lower than that of in both hyper-osmotic and iso-osmotic stimuli samples; however, the situation was reversed at the age of 63. Meanwhile, in hypo-osmotic stimuli samples, was always higher than In iso-osmotic stimuli samples, the expression level of
) pair, at the ages of 29–62, the was always lower than that of in both hyper-osmotic and iso-osmotic stimuli TARDBP in both hyper-osmotic and hypo-osmotic stimuli samples. In iso-osmotic stimuli samples, the expression level of
62, the
suggest that these gene pairs may be associated with the regulation mechanism of the senescence of IVD tissue 63, the
TARDBP
TARDBP
SRSF9). The expression level of the five gene pairs was not influenced by the changes in osmotic pressure at an early age, but was influenced in old age. These results suggest that these gene pairs may be associated with the In the current study, it was shown that five gene pairs might be involved in the potential interaction between osmotic pressure and age, (
), (RPS5
). The expression level of the five gene pairs was In the current study, it was shown that five gene pairs might be involved in the potential interaction between
(3) The data in the table is the expression value of each gene in different osmotic stimuli conditions and ages.
SRSF9 2073.6 2120.3 2124.0 1361.8 2004.9 1826.6 2576.8 1757.2 1797.8 2304.2 1917.4
Footnote: (1) H, I, L represent hyper-osmotic stimuli, iso-osmotic stimuli, and hypo-osmotic stimuli, respectively. (2) The number of H/I/L repres
CBX3 1652.5 1798.9 2067.2 2568.6 2040.8 2078.3 2900.1 2671.4 1992.7 2375.8 2444.9 SRSF9 2073.6 2120.3 2124.0 1361.8 2004.9 1826.6 2576.8 1757.2 1797.8 2304.2 1917.4
Footnote: (1) H, I, L represent hyper-osmotic stimuli, iso-osmotic stimuli, and hypo-osmotic stimuli, respectively. (2) The number of H/I/L repres
encoding TAR-DNA binding protein (also known as TDP-43 proteins), is one of the principal genes responsible for the adult onset form of amyotrophic lateral sclerosis (ALS), displaying a TDP-43 positive skein-like inclusions in the anterior horn of the spinal cord and inferior olive [25]. It has been suggested that the calpain-dependent cleavage of TDP-43 plays a crucial role in ALS [26]. In
the present study, the expression level of PRPF8 was
larger than that ofTARDBPin both hyper-osmotic and
hypo-osmotic stimuli samples, especially at an old age.
These results suggested a greater susceptibility of PRPF8
thanTARDBPto osmotic stimuli response.
RPS5 encodes ribosomal protein s5 and has been
suggested as one of the most stable reference genes for qPCR analysis of degenerated nucleus pulposus tissue (a fundamental component of IVD degeneration) in dogs
[27].OAZ1encodes ornithine decarboxylase antizyme 1, a
negative regulator of cellular polyamines, and has been suggested as a potential genetic marker of vascular events
[28]. To date, the contribution of OAZ1 to IVD has
not been explored. In our study, the different expression
of RPS5 and OAZ1 genes in hyper-osmotic and
hypo-osmotic stimuli samples suggested different response functions to osmotic conditions in IVD cells.
TheSLC25A3gene encodes a phosphate carrier protein (also named phosphate transport protein, PTP) which is a member of the solute carrier (SLC) family and is located in mitochondria [29]. PTP catalyzes the transport of phosphate groups from the cytosol to the mitochondrial matrix, either by proton co-transport or in exchange for hydroxyl ions [30]. To date, there is no direct evidence of SLC25A3ever regulating osmotic pressure, however,
it has been reported that the expressions ofSLC21A12,
SLC5A3, andSLC16A6are regulated by osmotic conditions in IVD cells, which is consistent with our results [31]. Meanwhile, nucleophosmin (NPM) (also known as nucle-olar phosphoprotein B23 or numatrin) is encoded by the
NPM1gene in humans [32,33]. To date, there is no report
revealing the contribution of NPM to IVD. NPM may be involved in diverse biological functions, such as ribosome biogenesis and transport, genomic stability and DNA repair, endoribonuclease activity, and centrosome duplica-tion during the cell cycle [34-37]. As a result, we inferred
that the changes of expression level of NPM may be
used to explain the changes of IVD cells in sensitivity to os-motic pressure and the phenomenon of disc degeneration in old age [38,39]. In our study, we found the expression
level of theSLC25A3gene to be less than theNPM1gene
only in iso-stimuli conditions in old age. Therefore, we inferred that iso-stimuli conditions might be an adverse factor for IVD cells.
Chromobox protein homolog 3 (HP1 gamma) is encoded
by theCBX3gene and is involved in chromatin remodeling,
DNA-dependent transcription, and negative regulation of
transcription [40,41]. Furthermore, it has been reported that HP1 plays an important role in cell survival, by supporting cell proliferation [33]. Meanwhile,
serine/ar-ginine rich splicing factor 9 (SRSF9), a member of the
serine/arginine-rich protein family, is involved in alter-native pre-mRNA splicing and plays a critical role in the regulation of apoptosis by splicing apoptosis-related genes [42,43]. Therefore, these studies may explain the
lower expression level of the CBX3 gene compared to
that of theSRSF9gene in our study.
To summarize, we inferred that hyper-osmotic and iso-osmotic conditions were adverse environmental factors for IVD cells, which was consistent with a previous study showing that IVD tissues have a higher extracellular osmolality than most other tissues [6,7]. However, it should be pointed out that several limitations were present in our study. The human IVD tissue samples were collected from patients aged 63, 62, 50, and 29 years old. The number of gene expression profiles was limited. Additionally, samples with a wider age range are needed to further analyze and confirm our inferences. Further, no computational procedure is perfect; as a result, potential candidates might be missed. In our study, only five pairs were identified; however, other important gene pairs might also be elucidated through other analysis methods and different samples.
Conclusions
In conclusion, we explored the molecular mechanism of the different responses of IVD cells in hyper-osmotic, iso-osmotic, and hypo-osmotic conditions. Finally, five gene
pairs ((CYP2A6,FNTB), (PRPF8,TARDBP), (RPS5,OAZ1),
(SLC25A3, NPM1) and (CBX3, SRSF9)) were selected based on the TSP method. Our results indicated that the expression level of these genes was reversed in old age in different osmotic stimuli conditions, but the expression level of these genes was not affected at an early age. We believe our results may provide new information on the molecular mechanisms of IVD disease.
Abbreviations
ALS:Amyotrophic lateral sclerosis; GEO: Gene expression omnibus; HP1: Chromobox protein homolog 3; IVD: Intervertebral disc;
NPM: Nucleophosmin; PTP: Phosphate transport protein; SLC: Solute carrier;
SRSF9: Serine/arginine rich splicing factor 9; TSP: Top-scoring pair.
Competing interests
The authors declare that there are no any conflicts of interest.
Authors’contributions
WZZ, XL and XFS conceived and designed the article, collected and analyzed the data and wrote the paper. QCZ, YFH and XX participated in analyzing the data and drafted the manuscript. RH, LQD and FZ analyzed the data. All authors read and approved the final manuscript.
Acknowledgements
This work was supported by the Natural Science Foundation of Anhui Province of China (No. 11040606Q10) and by the Foundation of Anhui Educational Committee (No. KJ2011Z202).
repair, endoribonuclease activity, and centrosome duplica-tion during the cell cycle [34-37]. As a result, we inferred that the changes of expression level of
used to explain the changes of IVD cells in sensitivity to os-motic pressure and the phenomenon of disc degeneration revealing the contribution of NPM to IVD. NPM may be involved in diverse biological functions, such as ribosome biogenesis and transport, genomic stability and DNA repair, endoribonuclease activity, and centrosome duplica-tion during the cell cycle [34-37]. As a result, we inferred that the changes of expression level of
olar phosphoprotein B23 or numatrin) is encoded by the gene in humans [32,33]. To date, there is no report revealing the contribution of NPM to IVD. NPM may be involved in diverse biological functions, such as ribosome biogenesis and transport, genomic stability and DNA in IVD cells, which is consistent with our results [31]. Meanwhile, nucleophosmin (NPM) (also known as nucle-olar phosphoprotein B23 or numatrin) is encoded by the gene in humans [32,33]. To date, there is no report revealing the contribution of NPM to IVD. NPM may be it has been reported that the expressions of
are regulated by osmotic conditions in IVD cells, which is consistent with our results [31]. Meanwhile, nucleophosmin (NPM) (also known as nucle-olar phosphoprotein B23 or numatrin) is encoded by the matrix, either by proton co-transport or in exchange for hydroxyl ions [30]. To date, there is no direct evidence ever regulating osmotic pressure, however,
it has been reported that the expressions ofSLC21A12
are regulated by osmotic conditions is a member of the solute carrier (SLC) family and is located in mitochondria [29]. PTP catalyzes the transport of phosphate groups from the cytosol to the mitochondrial matrix, either by proton co-transport or in exchange for hydroxyl ions [30]. To date, there is no direct evidence gene encodes a phosphate carrier protein (also named phosphate transport protein, PTP) which is a member of the solute carrier (SLC) family and is located in mitochondria [29]. PTP catalyzes the transport of phosphate groups from the cytosol to the mitochondrial
Conclusions
gene encodes a phosphate carrier protein
potential candidates might be missed. In our study, only five pairs were identified; however, other important gene pairs might also be elucidated through other analysis methods and different samples.
Received: 27 June 2013 Accepted: 6 December 2013 Published: 27 December 2013
References
1. Lapointe JM, Summers BA:Intervertebral disk disease with spinal cord penetration in a Yucatan pig.Vet Pathol2012,49:1054–1056.
2. Lee KI, Moon SH, Kim H, Kwon UH, Kim HJ, Park SN, Suh H, Lee HM, Kim HS, Chun HJ, Kwon IK, Jang JW:Tissue engineering of the intervertebral disc with cultured nucleus pulposus cells using atelocollagen scaffold and growth factors.Spine (Phila Pa 1976)2012,37:452–458.
3. Abbott RD, Purmessur D, Monsey RD, Iatridis JC:Regenerative potential of TGFbeta3 + Dex and notochordal cell conditioned media on degenerated human intervertebral disc cells.J Orthop Res2012,30:482–488.
4. Benz K, Stippich C, Fischer L, Mohl K, Weber K, Lang J, Steffen F, Beintner B, Gaissmaier C, Mollenhauer JA:Intervertebral disc cell- and hydrogel-supported and spontaneous intervertebral disc repair in nucleotomized sheep.Eur Spine J2012,21:1758–1768.
5. Li S, Duance VC, Blain EJ:Zonal variations in cytoskeletal element organization, mRNA and protein expression in the intervertebral disc. J Anat2008,213:725–732.
6. Chen J, Baer AE, Paik PY, Yan W, Setton LA:Matrix protein gene expression in intervertebral disc cells subjected to altered osmolarity.Biochem Biophys Res Commun2002,293:932–938.
7. Cheng CC, Uchiyama Y, Hiyama A, Gajghate S, Shapiro IM, Risbud MV:PI3K/ AKT regulates aggrecan gene expression by modulating Sox9 expression and activity in nucleus pulposus cells of the intervertebral disc.J Cell Physiol2009,221:668–676.
8. Wuertz K, Urban JP, Klasen J, Ignatius A, Wilke HJ, Claes L, Neidlinger-Wilke C: Influence of extracellular osmolarity and mechanical stimulation on gene expression of intervertebral disc cells.J Orthop Res2007,25:1513–1522. 9. Boyd LM, Richardson WJ, Chen J, Kraus VB, Tewari A, Setton LA:Osmolarity
regulates gene expression in intervertebral disc cells determined by gene array and real-time quantitative RT-PCR.Ann Biomed Eng2005, 33:1071–1077.
10. Haschtmann D, Stoyanov JV, Ferguson SJ:Influence of diurnal hyperosmotic loading on the metabolism and matrix gene expression of a whole-organ intervertebral disc model.J Orthop Res2006,24:1957–1966.
11. Pritchard S, Guilak F:The role of F-actin in hypo-osmotically induced cell volume change and calcium signaling in anulus fibrosus cells.Ann Biomed Eng2004,32:103–111.
12. Pritchard S, Erickson GR, Guilak F:Hyperosmotically induced volume change and calcium signaling in intervertebral disk cells: the role of the actin cytoskeleton.Biophys J2002,83:2502–2510.
13. Tan AC, Naiman DQ, Xu L, Winslow RL, Geman D:Simple decision rules for classifying human cancers from gene expression profiles.Bioinformatics2005, 21:3896–3904.
14. Geman D, d’Avignon C, Naiman DQ, Winslow RL:Classifying gene expression profiles from pairwise mRNA comparisons.Stat Appl Genet Mol Biol2004,3:19. 15. Xu L, Tan AC, Naiman DQ, Geman D, Winslow RL:Robust prostate cancer marker genes emerge from direct integration of inter-study microarray data.Bioinformatics2005,21:3905–3911.
16. Winslow DGCdADQNRL:Classifying gene expression profiles from pairwise mRNA comparison.Stat Appl Genet Mol Biol2004,3:1071. 17. Farinola N, Piller NB:CYP2A6 polymorphisms: is there a role for
pharmacogenomics in preventing coumarin-induced hepatotoxicity in lymphedema patients?Pharmacogenomics2007,8:151–158.
18. Altarescu G, Rachmilewitz D, Zevin S:Relationship between CYP2A6 genetic polymorphism, as a marker of nicotine metabolism, and ulcerative colitis.Isr Med Assoc J2011,13:87–90.
19. Tamaki Y, Arai T, Sugimura H, Sasaki T, Honda M, Muroi Y, Matsubara Y, Kanno S, Ishikawa M, Hirasawa N, Hiratsuka M:Association between cancer risk and drug-metabolizing enzyme gene (CYP2A6, CYP2A13, CYP4B1, SULT1A1, GSTM1, and GSTT1) polymorphisms in cases of lung cancer in Japan.Drug Metab Pharmacokinet2011,26:516–522.
20. Krishnakumar D, Gurusamy U, Dhandapani K, Surendiran A, Baghel R, Kukreti R, Gangadhar R, Prayaga U, Manjunath S, Adithan C:Genetic polymorphisms of drug-metabolizing phase I enzymes CYP2E1, CYP2A6 and CYP3A5 in South Indian population.Fundam Clin Pharmacol2012,26:295–306.
21. Liu H, Baliga R:Endoplasmic reticulum stress-associated caspase 12 mediates cisplatin-induced LLC-PK1 cell apoptosis.J Am Soc Nephrol 2005,16:1985–1992.
22. Zhou J, Vos CC, Gjyrezi A, Yoshida M, Khuri FR, Tamanoi F, Giannakakou P: The protein farnesyltransferase regulates HDAC6 activity in a microtubule-dependent manner.J Biol Chem2009,284:9648–9655. 23. Bell IM, Gallicchio SN, Abrams M, Beese LS, Beshore DC, Bhimnathwala H,
Bogusky MJ, Buser CA, Culberson JC, Davide J, Ellis-Hutchings M, Fernandes C, Gibbs JB, Graham SL, Hamilton KA, Hartman GD, Heimbrook DC, Homnick CF, Huber HE, Huff JR, Kassahun K, Koblan KS, Kohl NE, Lobell RB, Lynch JJ Jr, Robinson R, Rodrigues AD, Taylor JS, Walsh ES, Williams TM, Zartman CB: 3-Aminopyrrolidinone farnesyltransferase inhibitors: design of macrocyclic compounds with improved pharmacokinetics and excellent cell potency. J Med Chem2002,45:2388–2409.
24. Maubaret CG, Vaclavik V, Mukhopadhyay R, Waseem NH, Churchill A, Holder GE, Moore AT, Bhattacharya SS, Webster AR:Autosomal Dominant retinitis pigmentosa with intrafamilial variability and incomplete penetrance in two families carrying mutations in PRPF8.Invest Ophthalmol Vis Sci2011,52:9304–9309.
25. Seilhean D, Cazeneuve C, Thuriès V, Russaouen O, Millecamps S, Salachas F, Meininger V, LeGuern E, Duyckaerts C:Accumulation of TDP-43 andα-actin in an amyotrophic lateral sclerosis patient with the K17I ANG mutation. Acta Neuropathol2009,118:561–573.
26. Yamashita T, Hideyama T, Hachiga K, Teramoto S, Takano J, Iwata N, Saido TC, Kwak S:A role for calpain-dependent cleavage of TDP-43 in amyotrophic lateral sclerosis pathology.Nat Commun2012,3:1307.
27. Smolders L:New treatment strategies for canine intervertebral disc degeneration, PhD Thesis. Utrecht: Utrecht University; 2013. 28. Dumont J, Zureik M, Bauters C, Grupposo M-C, Cottel D, Montaye M,
Hamon M, Ducimetière P, Amouyel P, Brousseau T:Association of OAZ1 gene polymorphisms with subclinical and clinical vascular events.Arterioscler Thromb Vasc Biol2007,27:2120–2126.
29. Vasta V, Ng SB, Turner EH, Shendure J, Hahn SH:Next generation sequence analysis for mitochondrial disorders.Genome Med2009,1:100.
30. Jabs EW, Thomas PJ, Bernstein M, Coss C, Ferreira GC, Pedersen PL: Chromosomal localization of genes required for the terminal steps of oxidative metabolism: alpha and gamma subunits of ATP synthase and the phosphate carrier.Hum Genet1994,93:600–602.
31. Le Visage C, Kim SW, Tateno K, Sieber AN, Kostuik JP, Leong KW: Interaction of human mesenchymal stem cells with disc cells: changes in extracellular matrix biosynthesis.Spine (Phila Pa 1976)2006, 31:2036–2042.
32. Liu QR, Chan PK:Characterization of seven processed pseudogenes of nucleophosmin/B23 in the human genome.DNA Cell Biol1993,12:149–156. 33. Morris SW, Kirstein MN, Valentine MB, Dittmer K, Shapiro DN, Look AT,
Saltman DL:Fusion of a kinase gene, ALK, to a nucleolar protein gene, NPM, in non-Hodgkin’s lymphoma.Science1995,267:316–317.
34. Kim SC, Sprung R, Chen Y, Xu Y, Ball H, Pei J, Cheng T, Kho Y, Xiao H, Xiao L, Grishin NV, White M, Yang XJ, Zhao Y:Substrate and functional diversity of lysine acetylation revealed by a proteomics survey.Mol Cell2006, 23:607–618.
35. Ma Z, Kanai M, Kawamura K, Kaibuchi K, Ye K, Fukasawa K:Interaction between ROCK II and nucleophosmin/B23 in the regulation of centrosome duplication.Mol Cell Biol2006,26:9016–9034. 36. Maggi LB Jr, Kuchenruether M, Dadey DY, Schwope RM, Grisendi S,
Townsend RR, Pandolfi PP, Weber JD:Nucleophosmin serves as a rate-limiting nuclear export chaperone for the Mammalian ribosome. Mol Cell Biol2008,28:7050–7065.
37. Krause A, Hoffmann I:Polo-like kinase 2-dependent phosphorylation of NPM/B23 on serine 4 triggers centriole duplication.PLoS One2010,5:e9849. 38. Gruber HE, Ingram JA, Leslie K, Hanley EN Jr:Cellular, but not matrix,
immunolocalization of SPARC in the human intervertebral disc: decreasing localization with aging and disc degeneration. Spine (Phila Pa 1976)2004,29:2223–2228.
39. Gruber HE, Ingram JA, Hanley EN Jr:Tenascin in the human intervertebral disc: alterations with aging and disc degeneration.Biotech Histochem 2002,77:37–41.
40. Ye Q, Worman HJ:Interaction between an integral protein of the nuclear envelope inner membrane and human chromodomain proteins homologous to Drosophila HP1.J Biol Chem1996,271:14653–14656. 41. Koike N, Maita H, Taira T, Ariga H, Iguchi-Ariga SM:Identification of
hetero-chromatin protein 1 (HP1) as a phosphorylation target by Pim-1 kinase and the effect of phosphorylation on the transcriptional repression function of HP1(1).FEBS Lett2000,467:17–21.
pharmacogenomics in preventing coumarin-induced hepatotoxicity in lymphedema patients?
18. Altarescu G, Rachmilewitz D, Zevin S:
genetic polymorphism, as a marker of nicotine metabolism, and ulcerative colitis.
19. Tamaki Y, Arai T, Sugimura H, Sasaki T, Honda M, Muroi Y, Matsubara Y, Kanno S, Ishikawa M, Hirasawa N, Hiratsuka M:
16. Winslow DGCdADQNRL: pairwise mRNA comparison.
17. Farinola N, Piller NB:CYP2A6 polymorphisms: is there a role for pharmacogenomics in preventing coumarin-induced hepatotoxicity in lymphedema patients?
18. Altarescu G, Rachmilewitz D, Zevin S: profiles from pairwise mRNA comparisons. 15. Xu L, Tan AC, Naiman DQ, Geman D, Winslow RL:
marker genes emerge from direct integration of inter-study microarray Bioinformatics2005,
16. Winslow DGCdADQNRL:Classifying gene expression profiles from pairwise mRNA comparison.Stat Appl Genet Mol Biol
Avignon C, Naiman DQ, Winslow RL:
profiles from pairwise mRNA comparisons.Stat Appl Genet Mol Biol 15. Xu L, Tan AC, Naiman DQ, Geman D, Winslow RL:
marker genes emerge from direct integration of inter-study microarray 3905–3911.
2502
13. Tan AC, Naiman DQ, Xu L, Winslow RL, Geman D:Simple decision rules for classifying human cancers from gene expression profiles.
Avignon C, Naiman DQ, Winslow RL:Classifying gene expression Stat Appl Genet Mol Biol volume change and calcium signaling in anulus fibrosus cells.
Hyperosmotically induced volume change and calcium signaling in intervertebral disk cells: the role of the
Simple decision rules for Influence of diurnal hyperosmotic loading on the metabolism and matrix gene expression of a whole-organ
1966.
The role of F-actin in hypo-osmotically induced cell Ann Biomed
2005,
Influence of diurnal hyperosmotic
loading on the metabolism and matrix gene expression of a whole-organ 31. Le Visage C, Kim SW, Tateno K, Sieber AN, Kostuik JP, Leong KW: 29. Vasta V, Ng SB, Turner EH, Shendure J, Hahn SH:
analysis for mitochondrial disorders.
30. Jabs EW, Thomas PJ, Bernstein M, Coss C, Ferreira GC, Pedersen PL: Chromosomal localization of genes required for the terminal steps of oxidative metabolism: alpha and gamma subunits of ATP synthase and the phosphate carrier.
28. Dumont J, Zureik M, Bauters C, Grupposo M-C, Cottel D, Montaye M, Hamon M, Ducimetière P, Amouyel P, Brousseau T:
polymorphisms with subclinical and clinical vascular events. Thromb Vasc Biol
29. Vasta V, Ng SB, Turner EH, Shendure J, Hahn SH: analysis for mitochondrial disorders.
A role for calpain-dependent cleavage of TDP-43 in amyotrophic lateral sclerosis pathology.
New treatment strategies for canine intervertebral disc , PhD Thesis. Utrecht: Utrecht University; 2013. 28. Dumont J, Zureik M, Bauters C, Grupposo M-C, Cottel D, Montaye M,
Hamon M, Ducimetière P, Amouyel P, Brousseau T: Meininger V, LeGuern E, Duyckaerts C:
an amyotrophic lateral sclerosis patient with the K17I ANG mutation. 118:561–573.
26. Yamashita T, Hideyama T, Hachiga K, Teramoto S, Takano J, Iwata N, Saido TC, A role for calpain-dependent cleavage of TDP-43 in amyotrophic
Nat Commun
25. Seilhean D, Cazeneuve C, Thuriès V, Russaouen O, Millecamps S, Salachas F, Meininger V, LeGuern E, Duyckaerts C:Accumulation of TDP-43 and an amyotrophic lateral sclerosis patient with the K17I ANG mutation.
26. Yamashita T, Hideyama T, Hachiga K, Teramoto S, Takano J, Iwata N, Saido TC, retinitis pigmentosa with intrafamilial variability and incomplete penetrance in two families carrying mutations in PRPF8.
25. Seilhean D, Cazeneuve C, Thuriès V, Russaouen O, Millecamps S, Salachas F, Accumulation of TDP-43 and an amyotrophic lateral sclerosis patient with the K17I ANG mutation. 24. Maubaret CG, Vaclavik V, Mukhopadhyay R, Waseem NH, Churchill A,
Holder GE, Moore AT, Bhattacharya SS, Webster AR:Autosomal Dominant retinitis pigmentosa with intrafamilial variability and incomplete penetrance in two families carrying mutations in PRPF8.Invest Robinson R, Rodrigues AD, Taylor JS, Walsh ES, Williams TM, Zartman CB: 3-Aminopyrrolidinone farnesyltransferase inhibitors: design of macrocyclic compounds with improved pharmacokinetics and excellent cell potency.
42. Zhu J, Gong JY, Goodman OB Jr, Cartegni L, Nanus DM, Shen R:Bombesin attenuates pre-mRNA splicing of glucocorticoid receptor by regulating the expression of serine-arginine protein p30c (SRp30c) in prostate cancer cells.Biochim Biophys Acta2007,1773:1087–1094.
43. Mukherji M, Brill LM, Ficarro SB, Hampton GM, Schultz PG:A phosphoproteomic analysis of the ErbB2 receptor tyrosine kinase signaling pathways. Biochemistry2006,45:15529–15540.
doi:10.1186/2047-783X-18-62
Cite this article as:Zhanget al.:Gene expression analysis in response to osmotic stimuli in the intervertebral disc with DNA microarray.European Journal of Medical Research201318:62.
Submit your next manuscript to BioMed Central and take full advantage of:
• Convenient online submission
• Thorough peer review
• No space constraints or color figure charges
• Immediate publication on acceptance
• Inclusion in PubMed, CAS, Scopus and Google Scholar
• Research which is freely available for redistribution