www.biogeosciences.net/11/5411/2014/ doi:10.5194/bg-11-5411-2014
© Author(s) 2014. CC Attribution 3.0 License.
Quantifying the effects of clear-cutting and strip-cutting on nitrate
dynamics in a forested watershed using triple oxygen isotopes as
tracers
U. Tsunogai1, D. D. Komatsu1,*, T. Ohyama1, A. Suzuki2, F. Nakagawa2,**, I. Noguchi3, K. Takagi4, M. Nomura4, K. Fukuzawa4, and H. Shibata4
1Graduate School of Environmental Studies, Nagoya University, Furo-cho, Chikusa-ku, Nagoya 464-8601, Japan
2Earth and Planetary System Science, Faculty of Science, Hokkaido University, N10 W8, Kita-ku, Sapporo 060-0810, Japan 3Institute of Environmental Sciences, Environmental and Geological Research Department, Hokkaido Research Organization,
N19 W12, Kita-ku, Sapporo 060-0819, Japan
4Field Science Center for Northern Biosphere, Hokkaido University, N9 W9, Kita-ku, Sapporo 060-0809, Japan
*present address: School of Marine Science and Technology, Tokai University, 3-20-1, Orido, Shimizu-ku, Shizuoka-shi,
Shizuoka 424-8610, Japan
**present address: Graduate School of Environmental Studies, Nagoya University, Furo-cho, Chikusa-ku, Nagoya 464-8601,
Japan
Correspondence to: U. Tsunogai ([email protected])
Received: 7 April 2014 – Published in Biogeosciences Discuss.: 21 May 2014 Revised: 31 August 2014 – Accepted: 1 September 2014 – Published: 7 October 2014
Abstract. Temporal variations in the stable isotopic com-positions of nitrate dissolved in stream water eluted from a cool–temperate forested watershed (8 ha) were measured to quantify the biogeochemical effects of clear-cutting of trees and subsequent strip-cutting of the understory vegeta-tion, dwarf bamboo (Sasa senanensis), with special empha-sis on changes in the fate of atmospheric nitrate that had been deposited onto the watershed based on 117O values of nitrate. A significant increase in stream nitrate concentra-tion to 15 µmol L−1 in spring of 2004 was correlated with a significant increase in the 117O values of nitrate. Addi-tionally, the high117O values of+14.3 ‰ suggest that the direct drainage of atmospheric nitrate accounted for more than 50 % of total nitrate exported from the forested water-shed peaking in spring. Similar increases in both concentra-tions and 117O values were also found in spring of 2005. Conversely, low 117O values less than +1.5 ‰ were ob-served in other seasons, regardless of increases in stream nitrate concentration, indicating that the majority of nitrate exported from the forested watershed during seasons other than spring was remineralized nitrate: those retained in the forested ecosystem as either organic N or ammonium and then been converted to nitrate via microbial nitrification.
When compared with the values prior to strip-cutting, the annual export of atmospheric nitrate and remineralized ni-trate increased more than 16-fold and fourfold, respectively, in 2004, and more than 13-fold and fivefold, respectively, in 2005. The understory vegetation (Sasa) was particularly im-portant to enhancing biological consumption of atmospheric nitrate.
1 Introduction
1.1 Effects of clear-cutting and strip-cutting on nitrate in stream water
nitrate (NO−3 re) through nitrification, (3) uptake by plants or microbes, and (4) reduction through denitrification. As a re-sult, interpretation of the processes regulating nitrate concen-tration in stream water is not always straightforward.
Clear-cutting of plants in forested watersheds often leads to nitrate increasing to levels as high as 1000 µmol L−1 in stream water eluted from the watersheds (Likens et al., 1970; Swank et al., 2001), as well as acidification (Likens et al., 1970; Swank et al., 2001; Vitousek and Melillo, 1979). En-hancement of the production of fresh remineralized nitrate within soils due to disturbances and/or hindrance of the up-take of such remineralized nitrate in soils might play a large role in increases in nitrate in streams. Moreover, previous studies of forested catchments have offered considerable in-sight into the link between atmospheric nitrate deposition and nitrate discharge to streams (Grennfelt and Hultberg, 1986; Williams et al., 1996; Tietema et al., 1998; Durka et al., 1994). As a result, disturbances to forested watersheds can also increase direct drainage of atmospheric nitrate in stream water subsequent to deposition by hindering biological up-take processes of atmospheric nitrate within forested water-sheds.
Temporal variations in stream and soil solution chemistry, fine root biomass, and soil nitrogen processing in accordance with clear-cutting of trees and subsequent strip-cutting of un-derstory vegetation (mainly Sasa senanensis) were measured in a forested watershed in the Teshio Experimental Forest, Hokkaido University (Fig. 1) in northern Japan (Fukuzawa et al., 2006). In that study, an approximately 50 % decrease in fine root biomass due to understory vegetation cutting was found to induce an increase in the maximum nitrate concen-tration in stream water from 3 µmol L−1to ca. 15 µmol L−1 and that in soil solution from 30 µmol L−1 to more than 100 µmol L−1. These results implied that nitrogen uptake by the understory vegetation was important to preventing nitro-gen leaching after tree-cutting, and that the decline of this nitrogen uptake by removal of understory vegetation led to marked nitrate leaching to stream water (Fukuzawa et al., 2006). However, the importance of atmospheric nitrate as the source of increased nitrate in the stream water has not been evaluated to date. Quantitative evaluation of the source of increased nitrate in stream water subsequent to artificial clear-cutting and strip-cutting will improve our understand-ing of N cyclunderstand-ing in forested soils prior to artificial alterna-tions, as well as the mechanisms that regulate the direct dis-charge of NO−3 atmdeposited onto surface ecosystems (Durka et al., 1994; Ohte et al., 2004; Costa et al., 2011; Nakagawa et al., 2013). Thus, in this study, we conducted further iso-tope analysis of archived stream water samples to clarify the source of increased nitrate.
[image:2.612.313.547.65.410.2]1.2 Triple oxygen isotopic compositions of nitrate The natural stable isotopic composition of nitrate has been widely applied in the determination of the sources of nitrate
Figure 1. Map showing the location of Teshio Experimental Forest in northern Japan (a), and a contour map showing the water sam-pling point (weir) in the forest (b), together with both the catchment area shown by a dotted line and the clear-cutting area of the CC-LaG project shown by the hatched region. The white circle denotes the location of the monitoring tower.
in natural freshwater systems (Wada et al., 1975; Durka et al., 1994; Williard et al., 2001; Burns and Kendall, 2002; Camp-bell et al., 2002; Michalski et al., 2004; Ohte et al., 2004; Hales et al., 2007; Barnes et al., 2008; Burns et al., 2009; Tsunogai et al., 2010; Tobari et al., 2010; Ohte et al., 2010; Barnes and Raymond, 2010; Tsunogai et al., 2011; Nestler et al., 2011; Curtis et al., 2011; Costa et al., 2011; Pellerin et al., 2012; Dejwakh et al., 2012; Yue et al., 2013; Ohte, 2013; Lohse et al., 2013; Thibodeau et al., 2013; Nakagawa et al., 2013). In particular, triple oxygen isotopic composi-tions of nitrate have been shown to be a conservative tracer of atmospheric nitrate (NO−3 atm). While remineralized nitrate (NO−3 re), the oxygen atoms of which are derived from ei-ther terrestrial O2or H2O through microbial processing (i.e.,
nitrification), always shows mass-dependent relative relation between17O /16O ratios and18O /16O ratios; NO−
3 atm
atom transfers from atmospheric ozone (O3)during the
con-version of NOxto NO−3 atm(Michalski et al., 2003; Morin et
al., 2008; Alexander et al., 2009). Using the117O signature defined by the following equation (Miller, 2002; Kaiser et al., 2007) enables NO−3 atm(117O>0) to be distinguished from NO−3 re(117O=0):
117O= 1+δ
17O
(1+δ18O)β −1, (1)
where the constant β is 0.5247 (Miller, 2002; Kaiser et al., 2007),δ18O =Rsample/Rstandard– 1 andRis the18O /16O
ra-tio (or the17O /16O ratio in the case ofδ17O or the15N /14N ratio in the case of δ15N) of the sample and each stan-dard reference material. In addition, 117O is stable during mass-dependent isotope fractionation processes within sur-face ecosystems. As a result, while the atmosphericδ15N or δ18O signature can be overprinted by biogeochemical pro-cesses, we can use 117O as a conserved tracer of NO−3 atm and trace NO−3 atm, regardless of its partial removal through denitrification and/or uptake subsequent to deposition.
In our previous study, we determined the117O values of nitrate in aerobic groundwater worldwide to trace the fate of NO−3 atmthat had been deposited onto and passed through natural background watersheds (Nakagawa et al., 2013). The results of that study revealed that nitrate in groundwater had small117O values ranging from−0.2 ‰ to+4.5 ‰ ; there-fore, we estimated the average mixing ratio of NO−3 atm to total nitrate in the groundwater samples to be 3.1%. More-over, the concentrations of NO−3 atm ranged from less than 0.1 µmol L−1 to 8.5 µmol L−1, with lower NO−3 atm concen-trations being obtained for those recharged in forested ar-eas with high coverage of vegetation. Based on these find-ings, we concluded that most NO−3 atmdeposited onto healthy forested watersheds had been removed by plants and/or mi-crobes subsequent to deposition.
In this study, we measured temporal variations in the sta-ble isotopic compositions of nitrate in stream water eluted from the forested watershed in the Teshio Experimental For-est in accordance with clear-cutting and strip-cutting to quan-tify the biogeochemical effects of these activities. In particu-lar, this study focused on the fate of NO−3 atmbeing deposited into the forest ecosystem. Specifically, the117O tracer was used to quantify temporal variations in the concentration of NO−3 atm in stream water to gain insight into the processes controlling the fate and transport of NO−3 atmdeposited onto the forested watershed. The results presented herein will in-crease our understanding of fixed-nitrogen processing and fixed-nitrogen retention efficiencies within forest ecosystems as well.
2 Experimental section
2.1 Site description and management
The study site has been described in detail by Fukazawa et al. (2006) and Takagi et al. (2009). Clear-cutting of trees and subsequent strip-cutting of understory vegetation were con-ducted in a cool–temperate forested watershed in the Teshio Experimental Forest of Hokkaido University in northern Japan (Fig. 1; 45◦030N, 142◦060E). Prior to clear-cutting, the predominant overstory species were fir (Abies sachalinen-sis), birch (Betula ermanii and Betula platyphylla var. japon-ica), and Mongolian oak (Quercus mongolica var. grosser-rata). The forest floor of the study site is covered with dense understory vegetation primarily consisting of dwarf bamboo (mainly Sasa senanensis in flat areas and Sasa kurilensis on steep riparian slopes). The bedrock underlying the site con-sists of sedimentary rock of the Cretaceous period. The air temperature in the region varies from −35◦C to +35◦C, with an annual mean of 5.6◦C. The annual mean precipita-tion is 1170 mm, 30 % of which is snow. As a result, the site is covered with dense snow from November to March every year.
To evaluate the effects of clear-cutting on CO2exchange
in the forest, a monitoring tower was established in 2001 at the central part of the area (Fig. 1) and net ecosystem pro-duction over the forest stands has been monitored as part of a project known as the Carbon Cycle and Larch Growth experiment (CC-LaG) (Takagi et al., 2009). Clear-cutting of trees surrounding the tower with an area of 13.7 ha was con-ducted from January to March 2003 (Takagi et al., 2009; Fukuzawa et al., 2006). Following clear-cutting, logs were transported outside of the basin, while Sasa spp. were con-served and detritus (including shoots, twigs and leaves) was left in the basin. The Sasa spp. were then strip-cut into 4 m rows by crushing and spreading in October 2003. The area in which the Sasa spp. were strip-cut accounted for ca. 50 % of the total tree-cut area in the watershed. Larch seedlings were planted in the Sasa spp. strip-cut line immediately after cutting.
2.2 Water sampling
Stream water was sampled at a weir located on the out-let (Yatsume-zawa River) of the watershed (Fig. 1) every 2 weeks from June 2002 to December 2005. The total catch-ment area of the stream was 8 ha, all of which was the clear-cutting area of CC-LaG project, except for the riparian area and slope, which had a width of about 13 m from the stream. After measurement of the pH using a glass electrode, water samples were filtered through a 0.7 µm GF/F filter and kept at 4◦C for further analysis. Following additional filtering using
(DX-500, Dionex Inc., USA). Samples were analyzed within 6 months of sampling and then sealed in 30 mL polyethy-lene bottles for further analyses, including measurement of the isotopes reported in this study. The longest storage pe-riod between bottling and isotope analysis was 7 years. The ion concentrations of samples collected from June 2002 to December 2004 have been presented in our previous study (Fukuzawa et al., 2006).
2.3 Isotope analysis
Prior to isotope analyses, we excluded samples (1) having a residual water volume less than 10 mL, or (2) having ni-trate concentrations below the detection limit in this study (0.8 µmol L−1). In addition, the nitrate concentration of each stream water sample was determined again by ion chro-matography to exclude samples that had been altered during storage. Following screening, a total of one, four, 15, and 18 samples from 2002, 2003, 2004, and 2005, respectively, were analyzed for stable isotopic compositions.
The stable isotopic compositions were determined by con-verting the nitrate in each sample to N2O using the
chem-ical method originally developed to determine the15N /14N and18O /16O ratios of seawater and freshwater nitrate (McIl-vin and Altabet, 2005), with slight modifications (Tsuno-gai et al., 2008; Tsuno(Tsuno-gai et al., 2010; Konno et al., 2010; Tsunogai et al., 2011; Yamazaki et al., 2011; Nakagawa et al., 2013). Then, the stable isotopic compositions of N2O
were determined using a continuous-flow isotope ratio mass-spectrometry (CF-IRMS) system (Tsunogai et al., 2008; Hi-rota et al., 2010). This system consists of an original he-lium purge and trap line, a gas chromatograph (Agilent 6890) and a Finnigan MAT 252 (Thermo Fisher Scientific, Waltham, MA, USA) with a modified Combustion III inter-face (Tsunogai et al., 2000; Tsunogai et al., 2002; Nakagawa et al., 2004; Tsunogai et al., 2005) and a specially designed multi-collector system (Komatsu et al., 2008). For analysis, aliquots of N2O were introduced, purified, and then carried
continuously into the mass spectrometer via an open split in-terface, where the isotopologues of N2O+ atm/zratios of
44, 45, and 46 were monitored to determineδ45andδ46. Each analysis was calibrated using a machine-working reference gas (99.999 % N2O) that was introduced into the mass
spec-trometer via an open split interface according to a definite schedule to correct for sub-daily temporal variations in the mass spectrometry. In addition, a working-standard gas mix-ture containing a known concentration of N2O (ca. 1000 ppm
N2O in air) that was injected from a sampling loop was
an-alyzed in the same way as the samples at least once a day to correct for daily temporal variations in the mass spectrome-try.
Following analyses based on N2O+ monitoring, another
aliquot of N2O was introduced to determine the 117O of
N2O (Komatsu et al., 2008). Using the same procedures as
those used in the N2O+monitoring mode, purified N2O was
introduced into our original gold tube unit (Komatsu et al., 2008), which was held at 780◦C for the thermal
decompo-sition of N2O to N2and O2. The produced O2purified from
N2was then subjected to CF-IRMS to determine theδ33and δ34by simultaneous monitoring of O+2 isotopologues atm/z ratios of 32, 33, and 34. Each analysis was calibrated with a machine-working reference gas (99.999 % O2gas in a
cylin-der) that was introduced into the mass spectrometer via an open split interface according to a definite schedule to cor-rect for sub-daily temporal variations in the mass spectrom-etry. In addition, a working-standard gas mixture containing N2O of known concentration (ca. 1000 ppm N2O in air) was
analyzed in the same way as the samples at least once a day to correct for daily temporal variations in the mass spectrom-etry.
The values ofδ15N,δ18O, and117O for N2O derived from
the nitrate in each sample were compared with those derived from our local laboratory nitrate standards that had been cal-ibrated using the internationally distributed isotope reference materials (USGS-34 and USGS-35) (Böhlke et al., 2003; Kaiser et al., 2007) to calibrate theδ values of the sample nitrate to an international scale, as well as to correct for both isotope fractionation during the chemical conversion to N2O
and the progression of oxygen isotope exchange between the nitrate-derived reaction intermediate and water (ca. 20 %). Allδ values are expressed relative to air (for nitrogen) and VSMOW (for oxygen) in this paper.
In this study, we adopted the internal standard method (Nakagawa et al., 2013) for accurate calibrations to deter-mine theδ15N,δ18O or117O values of nitrate. Specifically, we added each of the nitrate standard solutions (containing ca. 10 mmol L−1 nitrate with known δ15N, δ18O or 117O values) to additional aliquots of the samples until the nitrate concentration was three to five times larger than the origi-nal. Then we converted it to N2O and determined the
val-ues ofδ15N,δ18O, or117O in a similar manner as was used for each pure sample. After correcting for the contribution of N2O from the nitrate in each sample, we obtained the stable
isotopic compositions for N2O derived from our laboratory
nitrate standards. Next, theδ15N,δ18O, and117O values in the samples were simply calibrated using curves generated from the N2O derived from the nitrate standards.
The samples had nitrate concentrations of more than 0.8 µmol L−1, corresponding to nitrate quantities greater than 20 nmol in a 30 mL sample, which is sufficient to determine δ15N,δ18O, and117O values with high precision. Thus, all isotopic data presented in this study have an error better than
approximated 117O values of NO−3 atm available in the lit-erature, we recalculated the117O values based on the power law.
Nitrite (NO−2)in the samples also interferes with the fi-nal N2O produced from nitrate (NO−3), because the
chemi-cal method also converts NO−2 to N2O (McIlvin and Altabet,
2005). Therefore, it was necessary to correct for the contri-bution of NO−2-derived N2O to accurately determine the
sta-ble isotopic compositions of the sample nitrate. However, all samples analyzed in this study contained NO−2 at concentra-tions below the detection limit (0.05 µmol L−1), which corre-sponded to NO−2 / NO−3 ratios less than 10 %; thus, the results were used without any corrections.
Theδ18O values of H2O in the samples were analyzed
us-ing cavity rus-ing-down spectroscopy (Picarro L2120-I with an A0211 vaporizer and auto sampler), which had an error of
±0.1 ‰. Both VSMOW and VSLAP were used to calibrate the values to the international scale.
2.4 Deposition rate of atmospheric nitrate
Continuous monitoring of the deposition rate of atmospheric nitrate was conducted from April 2008 to March 2012 (FY2008 to FY2011). While total (wet+dry) deposition rate of atmospheric nitrate had been determined in the site us-ing a simple bucket sampler collected monthly durus-ing 2002 (Fukuzawa et al., personal communication, 2014), we be-gan more precise monitoring based on the standard EANET methodology, in response to the increase in nitrate concen-tration in the stream (Fukuzawa et al., 2006). Wet deposition samples were collected weekly at a height of 2.5 m using a wet only sampler. Nitrate aerosol, nitric acid, and nitrous acid were collected for every 3 weeks from the monitoring tower at a height of 30 m (Fig. 1) using the filter pack method (flow rate=4 L min−1)and a PM2.5 impactor (Noguchi et al., 2007b). Nitrogen oxides (NO2and NO) were collected
monthly (every 3 or 6 weeks) from a height of 1.5 m using an Ogawa passive sampler. These components were measured by ion chromatography (Dionex ICS-2000/1500) at the lab-oratory of the Institute of Environmental Science, Hokkaido Research Organization, and the results were used to estimate the dry deposition rates of nitrate by the inferential method using a mean tree height of 3.0 m for FY2008–2009 and 4.0 for FY2010–2011 (Noguchi et al., 2011).
3 Results and discussion
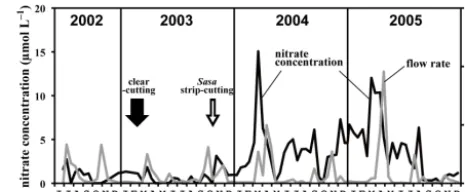
3.1 Temporal variations in stream water nitrate The average stream nitrate concentration was 0.9 µmol L−1 in 2002 (June to December) and 0.7 µmol L−1 in 2003 (an-nual average), while the maximum nitrate concentration was 2.7 µmol L−1in 2002 and 3.1 µmol L−1in 2003. The max-imum nitrate concentration was much lower than the
aver-Figure 2. Temporal variations in nitrate concentrations in stream water (black line), together with those of flow rate of the stream water (grey line). Solid and open arrows denote the period of clear-cutting of trees and strip-clear-cutting of Sasa, respectively. The temporal variations in nitrate concentration from June 2002 to the end of 2004 were previously presented by Fukuzawa et al. (2006).
age nitrate concentration of wet deposition in a background area of eastern Asia (around 10 µmol L−1)(EANET, 2013). The low and stable stream nitrate concentration during 2002– 2003 implied that atmospheric nitrate had been effectively removed from the forested watershed, and that rain or snow events had little direct impact on the stream nitrate concen-tration. However, as discussed in Fukuzawa et al. (2006), a significant increase in stream nitrate concentration was observed in 2004, probably in response to strip-cutting of the understory dwarf bamboo, S. senanensis, in October 2003 (Fig. 2). The average nitrate concentration increased to 3.8 µmol L−1in 2004 (annual average) and 3.8 µmol L−1in 2005 (annual average). The maximum nitrate concentration also increased to 15 µmol L−1 in 2004 and 12 µmol L−1 in 2005 (Fig. 2). These findings indicate that strip-cutting had significant impacts on nitrate dynamics in the forest ecosys-tem from 2004 until at least the end of 2005.
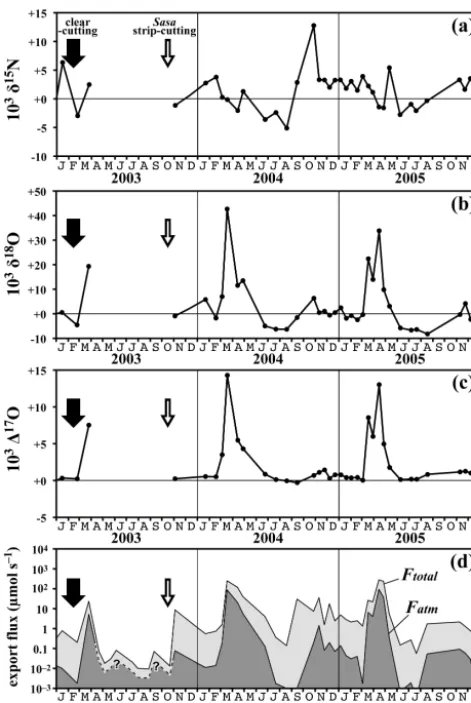
[image:5.612.311.544.67.163.2]Figure 3. Temporal variations in the values ofδ15N (a),δ18O (b), and117O (c) of nitrate in the stream water, together with those in the export fluxes of nitrate (Ftotal)and atmospheric nitrate (Fatm)
on a logarithmic scale (d). Solid and open arrows denote the period of clear-cutting of trees and strip-cutting of Sasa, respectively.
One of the striking features of the large temporal varia-tions ofδ18O and117O was the enhancement of bothδ18O and117O in spring, especially in the years following strip-cutting. Enrichment of nitrate concentration was detected in spring of 2004 and 2005, probably in response to the spring snowmelt after strip-cutting (Fig. 2). The results of the present study using stable isotopes revealed that these enriched nitrate levels were accompanied by elevated val-ues of bothδ18O and117O. Atmospheric nitrate is charac-terized by elevated values of bothδ18O and 117O to up to
+110 ‰ (Durka et al., 1994; Kendall, 1998; Savarino et al., 2007; Morin et al., 2008) and+45 ‰ (Savarino et al., 2007; McCabe et al., 2007; Morin et al., 2008), respectively. In ad-dition, atmospheric nitrate is currently the only source of ni-trate that shows117O values larger than 0 ‰. Accordingly, atmospheric nitrate might be the source of nitrate enrichment during the spring snowmelt. However, the temporal varia-tions inδ15N values were independent from the variations in
δ18O and117O (Fig. 3). Overall, these findings indicate that the major process controlling theδ15N values appears to be different from those controlling theδ18O and117O values.
Conversely, temporal variations in theδ18O values of H2O
was small and independent from variations in theδ18O and 117O values of nitrate, with an arithmetic average and 1σ variation of−11.0±0.7 ‰, which is typical of stream water in the area (Mizota and Kusakabe, 1994). The annual flow volume of the stream was stable at around 8×10⁸L yr−1 ev-ery year as well (Fig. 2), which corresponds to more than 80 % of the total precipitation in the catchment. Considering the evaporative loss of water from the catchment area, water loss via groundwater flow must be very low for the water-shed. Thus, we assumed that the studied stream was the only channel through which nitrate was eluted from the catchment area for later discussions.
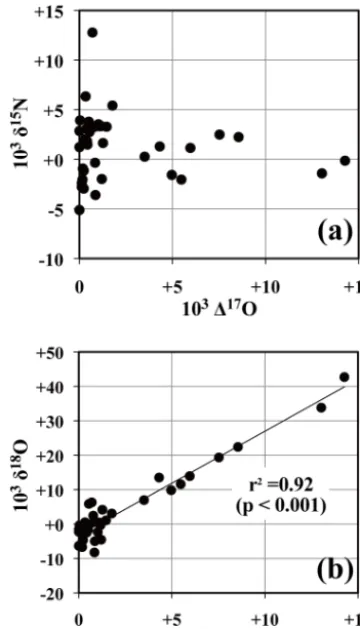
3.2 δ18O andδ15N values of atmospheric nitrate To further verify that NO−3 atm was responsible for the el-evated 117O values in the samples by up to +14.3 ‰ in spring 2004 and 2005, theδ15N andδ18O values of nitrate in the samples were plotted as a function of117O (Fig. 4). Because NO−3 atm is enriched in both 18O and 17O simul-taneously (Michalski et al., 2003; Tsunogai et al., 2010),
18O-enrichment was expected for samples showing elevated 117O values if NO−3 atm was responsible for the increased levels. As shown in Fig. 4b, the δ18O values in the sam-ples showed strong linear correlation with the 117O val-ues (r2=0.92, p <0.001). Additionally, when we extrap-olated the linear correlation to the117O value of NO−3 atm obtained through continuous monitoring on Rishiri Island (+26±3 ‰; Tsunogai et al., 2010), which is located 50 km northwest of the study site (Fig. 1) (Noguchi et al., 2007a; Tsunogai et al., 2010), we obtained δ18O= +79 ±20 ‰, which correspond to theδ18O values for NO−3 atm(Durka et al., 1994; Morin et al., 2009; Alexander et al., 2009; Tsuno-gai et al., 2010). These findings indicated that an increase in the export flux of NO−3 atmwas primarily responsible for ni-trate enrichment in stream water during spring of 2004 and 2005. Theδ15N values of nitrate are consistent with this con-clusion as well. While the variation inδ15N values showed little correlation with117O (Fig. 4), theδ15N values of those showing117O values more than+5 ‰ were plotted around
−0.7±2.7 ‰ , which almost corresponds with the annual averageδ15N value of NO−3 atmdetermined in Rishiri Island (–1.1 ‰ ; Tsunogai et al., 2010). Atmospheric nitrate was highly responsible for the elevated117O values.
3.3 δ18O andδ15N values of remineralized nitrate
The averageδ18O value of NO−3 re produced through nitrifi-cation in the forested watershed was determined to be−3.6
Figure 4. Relationship between117O andδ15N of nitrate (a) and
117O andδ18O of nitrate (b) in stream water samples.
−4.2±2.4 ‰ was obtained for NO−3 reproduced through ni-trification in a forested watershed on nearby Rishiri Island, where the H2O showedδ18O values of around−13 ‰ based
on the linear relationship between the 117O and δ18O of nitrate dissolved in both groundwater and stream water on the island (Tsunogai et al., 2010). Conversely, Spoelstra et al. (2007) proposed much higher δ18O values of +3.1 to
+10.1 ‰ with a mean value of+5.2 ‰ for nitrate produced through nitrification in soils based on in vitro incubation experiments using soils containing H2O with δ18O values
around−10 ‰ . Similar highδ18O values of nitrate were also obtained for nitrate produced through nitrification in soils in several past studies based on in vitro soil-incubation experi-ments (Burns and Kendall, 2002) and calculations (Durka et al., 1994).
During the conversion of ammonium to nitrate by chemolithoautotrophic bacteria, two oxygen atoms originate from H2O and one from O2(Aleem et al., 1965; Andersson
and Hooper, 1983; Kumar et al., 1983). In recent laboratory studies, the kinetic isotope effects during incorporation of O atoms were estimated to be+20.4±2.3 ‰ for ammonia ox-idation (O2 plus H2O incorporation) and +8.6±2.3 ‰ for
incorporation of H2O during nitrite oxidation (Buchwald et
al., 2012). Furthermore, the equilibrium isotope effect during abiotic O atom exchange between nitrite and H2O was
esti-mated to be+12.5±1.5 ‰ (Casciotti et al., 2007). Based on theδ18O value of atmospheric O2 (+23.5 ‰) and the
aver-ageδ18O value of the stream water in the study area (–11 ‰), aδ18O value of −3.4±5.8 ‰ for NO−3 re was anticipated, which corresponds with the value obtained. We concluded that values around −3.6 ‰ represented the δ18O value of NO−3 re produced through nitrification in the forest ecosys-tem, where H2O showedδ18O values around−11 ‰.
Either the slight contribution of NO−3 atm or environmen-tal differences between in vitro and in situ samples might be responsible for the higherδ18O values of nitrate produced through nitrification in soils obtained in past estimates. Dif-ferences in some environmental parameters of soils in the watersheds investigated in this study from those used in past experiments could also be responsible. Accordingly, studies using additional data describing the values of bothδ18O and 117O of nitrate eluted from various watersheds and gener-ated through soil-incubation experiments are warranted.
The averageδ15N value of NO−3 re was determined to be
+1.5±3.6 ‰ from those having117O values less than 1 ‰, which was much greater variance than that ofδ18O. While samples with high117O values (117O >+3 ‰) had δ15N values that showed little dispersion, samples with low117O values (117O <+3 ‰) showed large dispersions (Fig. 4a). The presence of highly variable δ15N values only in low 117O stream nitrate implied that theδ15N values of NO−3 re produced in the studied watershed were highly variable.
To clarify the major process controlling theδ15N values of NO−3 re, we estimated the endmemberδ15N andδ18O values of NO−3 re(δ15Nreandδ18Ore)for each sample by correcting
the contribution of NO−3 atmusing each117O value, as shown in equations (2), (3), and (4):
Catm Ctotal
= 1
17O 117O
atm
, (2)
δ15Nre=
Ctotal×δ15N−Catm×δ15Natm Ctotal−Catm
(3)
δ18Ore=
Ctotal×δ18O−Catm×δ18Oatm Ctotal−Catm
, (4)
whereCatm andCtotal denote the concentration of NO−3 atm
and NO−3 in each water sample, respectively, and δ15Natm, δ18Oatm, and 117Oatm denote δ15N, δ18O, and 117O
val-ues of NO−3 atm, respectively. As for the values ofδ15Natm, δ18Oatm, and 117Oatm, we used the annual average values
obtained through continuous monitoring on Rishiri Island (δ15Natm= −1.1 ‰, δ18Oatm= +87.1 ‰, and 117Oatm=
+26.2 ‰; Tsunogai et al., 2010).
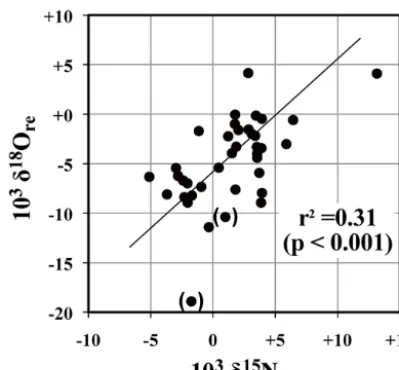
Figure 5. Relationship between estimatedδ15N andδ18O of rem-ineralized nitrate in stream water samples (δ15Nreandδ18Ore,
re-spectively). See text for the detailed processes used to obtain the values. Data points obtained from samples with high117O values (>+10 ‰) are shown in parentheses to indicate that they could in-clude large errors.
Barkan, 2000), the contribution of oxygen atoms derived from tropospheric O2during the production of NO−3 re from
ammonium or organic nitrogen could be partly responsible for the observed117O values less than 0 ‰. However, even if the contribution was significant, the possible117O value of produced NO−3 re would include 0 ‰ within the error of our analytical precision (±0.2 ‰). Accordingly, 0 ‰ was used for the117O value of NO−3 reand observed117O values less than 0 ‰ are considered to be 0 ‰ for the remainder of this paper.
The relationship between the estimatedδ15Nreandδ18Ore
is presented in Fig. 5. It should be noted that all estimated δ15Nrevalues were nearly identical to the observedδ15N
val-ues owing to small differences betweenδ15Nreandδ15Natm.
The primary goal of estimatingδ18Oreis to discuss the
rea-son for large variations inδ15Nre(and thusδ15N) of nitrate in
stream water. Additional determinations on the117O values of nitrate together withδ18O enable us to correct the contri-bution of NO−3 atmfrom the determined values ofδ18O and to use the corrected values (δ18Ore)for discussing the behavior
of NO−3 re. Unlike117Oatm, the values ofδ18Oatmused in the
calculation could have been altered within the forest ecosys-tem subsequent to deposition; therefore, we should consider errors up to 20 ‰ (as presented in Sect. 3.2) in the values ofδ18Oatm. While the errors in the calculatedδ18Orevalues
were small for the samples showing low 117O values, the errors were large for those having high 117O values. As a result, those having high117O values of more than+10 ‰ are shown in parentheses to denote that they were excluded from subsequent discussions.
As clearly presented in the figure,δ15Nreandδ18Orewere
linearly correlated with a slope of+1.23±0.45 (r2=0.31, p <0.001). As a result, both δ15Nre andδ18Ore varied
si-multaneously in the stream water samples. Partial removal of nitrate through denitrification has been shown to be a representative process that enhances both δ15N and δ18O in residual nitrate simultaneously (Amberger and Schmidt, 1987). Previous studies showed that partial removal of nitrate through assimilation by plants and/or microbes could be an alternative process leading to enrichment of bothδ15N and δ18O in residual nitrate, while the fractionation was found to be small or negligible in general (Högberg, 1997; Kendall, 1998). Denitrification is a more plausible cause of the ob-served variation in bothδ15Nreandδ18Ore. Theoretical and
[image:8.612.66.266.65.250.2]laboratory studies have suggested that denitrification results in 2:1 fractionation ofδ15N :δ18O (Amberger and Schmidt, 1987; Aravena and Robertson, 1998), but recent studies pro-posed a 1:1 ratio as well (Granger et al., 2008). Thus, al-though other minor factors could have changedδ15Nreand/or δ18Ore, the linear correlation betweenδ15Nre andδ18Orein
Fig. 5 implies thatδ15Nre(and thusδ15N of nitrate in stream
water) primarily represented the progress of denitrification in soils prior to elution into stream water.
As a result, temporal variations in the values of bothδ15Nre
(and thusδ15N of nitrate in stream water) can be a tracer to quantify the effects of strip-cutting on the progress of den-itrification in soils of the watershed. However, we did not observe any significant variations inδ15Nrevalues in
accor-dance with strip-cutting in the present study. This was likely because only fiveδ15Nredata points were available prior to
strip-cutting (n=5). Accordingly, additional studies gener-ating more nitrateδ15Nredata should be conducted to
deter-mine if strip-cutting impacts the progression of denitrifica-tion in soils.
Conversely, we observed clear depletion of theδ15Nre
val-ues in summer (June, July, and August) when compared with the other seasons (Fig. 3). Specifically, the average δ15Nre
value was −2.5±1.6 ‰ in summer (n=7), while it was
+2.2±3.0 ‰ (n=34) during the other seasons (p <0.001, t value=8.0). A significant positive relationship between soil temperature and gross nitrification rates was observed in previous studies (Breuer et al., 2002; Zaman and Chang, 2004; Hoyle et al., 2006). Active nitrification during summer might reduce the relative progress of denitrification within the total nitrate pool in soils.
3.4 Quantifying the effects of strip-cutting on nitrate dynamics
the maximum streamCatmwas only 0.53 µmol L−1in 2003,
a significant increase inCatmto 8.2 µmol L−1was observed
in spring of 2004, probably in response to strip-cutting. A similar increase in streamCatmup to 3.9 µmol L−1was also
observed in spring of 2005. To quantify the effects of the strip-cutting on processes regulating the elution of NO−3 atm, the daily elution rate of NO−3 atm (Fatm)was calculated for
each day on which the117O value of nitrate was determined from each concentration of NO−3 atm(Catm)and the daily flow
rate of stream water (V) by applying equation (5):
Fatm=Catm×V . (5)
There were only fourCatmdata points for 2003 because most
of theCtotalin 2003 were too low (less than 0.1 µmol L−1)to
determine the117O values (Fig. 2). However, if theCtotalis
less than 0.1 µmol L−1, the associatedCatmmust be less than
0.1 µmol L−1as well, regardless of the117O values. To esti-mate the upper limit ofCatmand thus the upper limit ofFatm
for 2003, we applied the maximum 117O value of nitrate in stream water observed in this study (117O= +14.3 ‰) as the maximum117O value of nitrate for samples showing Ctotalless than 0.1 µmol L−1in 2003 (n=9).
The daily elution fluxes of NO−3 (Ftotal) and NO−3 re
(Fre)were also calculated from both the NO−3 concentration
(Ctotal)and the daily average flow rate of the stream water
(V) by applying Eqs. (6) and (7):
Ftotal=Ctotal×V (6)
Fre=Ftotal−Fatm. (7)
The temporal variation ofFatm and theFtotal are plotted in
Fig. 3d. As shown in the figure, enrichment of Fatm
oc-curred during spring from 2003 to 2005. More than 90 % of NO−3 atmeluted in March, April, and May each year. Direct contribution of NO−3 atmfrom snow pack to the stream must be responsible for this phenomenon. Similar spring enrich-ment of Fatm due to snowmelt has been observed through
continuous monitoring ofδ18O of nitrate in runoff (Kendall et al., 1995; Ohte et al., 2004; Piatek et al., 2005; Pellerin et al., 2012). While spring Fatm enrichment was observed
from 2003 to 2005, regardless of strip-cutting, the levels be-came much higher after strip-cutting. The maximumFatm
in-creased from 5.3 µmol s−1in 2003 to 88.6 µmol s−1in 2004 and 93.3 µmol s−1 in 2005. Additionally, maximumFre
in-creased from 13.0 µmol s−1in 2003 to 77.8 µmol s−1in 2004 and 161.5 µmol s−1in 2005.
Conversely, Fatm was always small during the other
sea-sons, even after strip-cutting. Most of the nitrate being ex-ported from the watershed during seasons other than spring was NO−3 re: those retained in the forested ecosystem as either organic N or ammonium and then been converted to nitrate via microbial nitrification. Fatm was especially low during
summer.Frewas reduced during summer as well (Fig. 3).
As discussed above, δ15Nre depletion implied active
[image:9.612.317.539.130.230.2]ni-trification during summer. The combination of both active
Table 1. Temporal variations in the export flux per unit area of the catchment (mmol m−2yr−1) of atmospheric nitrate (Matm), together with those of remineralized nitrate (Mre), total nitrate
(Mtotal), andMatm/Mtotalratio. Changes relative to 2003 are
pre-sented in parentheses.
2003 2004 2005
Matm 0.13±0.04
(1)
2.6 (16–30)
2.1 (13–24)
Mre 0.88±0.04
(1)
3.7 (4)
4.8 (5–6)
Mtotal 1.0
(1)
6.4 (6.3)
7.0 (6.9)
Matm/Mtotal 9–16% 41% 31 %
nitrification in soil and active nitrate consumption through assimilation by plants and/or microbes resulted in both a re-duction and rapid turnover of the nitrate pool in soil, and thus a reduction in the elution rate of both NO−3 atm(mostly) and NO−3 re (partly) during summer. When compared with sum-mer, a slight increase inFat mwas observed in fall and winter. The decrease in nitrification and nitrate consumption in soils increased the direct drainage rate of NO−3 atm.
We can obtain the annual export flux of NO−3 atmper unit area of the catchment (Matm)by integrating theFatmvalues
for each year of the observation using the equation (8).
Matm=
P
Fatm(t )×1t
S , (8)
whereSdenote the total catchment area (8 ha). We can obtain the annual export flux for NO−3 (Mtotal)and NO−3 re (Mre)
by integratingFreandFtotalfor each year of the observation
using Eqs. (9) and (10).
Mtotal=
P
Ftotal(t )×1t
S (9)
Mre=
PF
re(t )×1t
S (10)
The estimatedMatm,Mre, and Mtotal for 2003 to 2005 are
presented in Table 1. WhileMtotalwas 1.0 (mmol m−2yr−1)
in 2003, it increased to 6.4 in 2004 and to 7.0 in 2005. In accordance with the increase in Mtotal, Matm also
in-creased from 0.13±0.04 (mmol m−2yr−1)in 2003 to 2.6 in 2004 and 2.1 in 2005.Mre also increased from 0.88±0.04
(mmol m−2yr−1)in 2003 to 3.7 in 2004 and 4.8 in 2005. The observed increases in Matm and Mre in accordance
Table 2. Annual deposition rate of atmospheric nitrate at the monitoring tower (mmol m−2yr−1).
FY2008 FY2009 FY2010 FY2011 Average
Wet deposition 11.9 17.4 13.9 17.2 15.1±2.7
Dry deposition 3.2 3.0 3.9 3.7 3.5±0.4
Total 15.1 20.4 17.8 20.9 18.6±2.7
through the spring snowmelt. Although bothMatmandMre
increased in response to strip-cutting, the relative increase inMatm was much higher than the relative increase inMre.
These results imply that the major impact of strip-cutting was on the biological consumption processes of NO−3 atm, rather than the production processes of NO−3 rein soils.
While the annual averageMatm/Mtotalratio was less than
16 % in 2003 (Table 1), it increased to 41 % in 2004 in re-sponse to strip-cutting, then slightly decreased to 31 % in 2005. TheMatm/Mtotal ratios after strip-cutting were much
higher than those determined for normal natural discharges, such as 3.1–7.7 % in southern California (Michalski et al., 2004), 7.4±2.6 % on Rishiri Island (Tsunogai et al., 2010), and 0–7 % in the Yellow River (Liu et al., 2013), as well as that dissolved in soil solution of temperate forest in north-ern Michigan (9 % on average)(Costa et al., 2011) and that dissolved in an oligotrophic lake water column in Japan (9.7±0.8 %) (Tsunogai et al., 2011). As a result, we can eas-ily differentiate the ratios observed after strip-cutting from other normal Matm/Mtotal ratios in stream water using the 117O values of nitrate, indicating that they can serve as a useful and powerful tracer for quantification of artificial al-ternations in forested watersheds.
3.5 Quantifying the effects of strip-cutting on atmospheric nitrate dynamics
If biological consumption processes of NO−3 atm were fully destroyed in the watershed owing to strip-cutting, the an-nual export flux via stream water (Matm)would be the same
as that deposited throughout the catchment area. There-fore, we determined the annual deposition flux of NO−3 atm (Datm)at the monitoring tower of the CC-LaG project
ad-jacent to the catchment area (Fig. 1) to compareMatmwith Datm. The data coverage of the obtained daily deposition rate
was 94 % in FY2008, 89 % in FY2009, 95 % in FY2010, and 82 % in FY2011. To complement the lacking data of the daily deposition rate, we first determined the average daily deposition rate for each year based only on the ob-tained data set and then estimated the annual deposition flux (Datm)for each year assuming the same daily
deposi-tion rate with the average for those lacking data. The an-nual deposition flux of NO−3 atm (Datm) was nearly stable
at around 18.6±2.7 (mmol m−2yr−1), and wet deposition (15.1±2.7 mmol m−2yr−1)accounted for 81±3 % of the total NO−3 atm deposition (Table 2). The estimated wet
de-position flux of NO−3 atm corresponds with the average wet deposition flux of NO−3 atm determined at nearby Rishiri is-land (Fig. 1) through the continuous monitoring since 2001 (13.5±2.9 mmol m−2yr−1)(EANET, 2013), as well as that deposited in a background area in eastern Asia (EANET, 2013). Furthermore, the estimatedDatmcorresponds with the
total deposition flux of NO−3 atm determined preliminary in the forested watershed prior to clear-cutting using a bucket sampler (19.5 mmol m−2yr−1in 2002; Fukuzawa et al., per-sonal communication, 2014). We conclude that the estimated Datmrepresents the annual deposition flux of NO−3 atmin the
watershed irrespective to the year of observation.
When compared with theDatmestimated in this study, the
annual export flux of NO−3 atm via stream water (Matm)
cor-responds to less than 1 % in 2003, about 14 % in 2004, and about 12 % in 2005. In our previous study on nearby Rishiri Island using117O of nitrate as a tracer, we estimated that direct drainage accounts for 8.8±4.6 % of NO−3 atmthat has been deposited onto the island on average, and that the resid-ual portion has undergone biological processing before being exported from the surface ecosystem based on comparison of the inflow (deposition of atmospheric nitrate) and outflow (atmospheric nitrate in groundwater) (Tsunogai et al., 2010). The present study revealed that the studied forest ecosys-tem removed NO−3 atmmore effectively in 2003 than that on Rishiri Island, while the removal efficiency was worse than that of Rishiri Island in 2004 owing to strip-cutting.
4 Summary and conclusions
To quantify the biogeochemical effects of clear-cutting of trees and subsequent strip-cutting of the understory vegeta-tion in a cool–temperate forested watershed, temporal varia-tions in the origin of nitrate dissolved in stream water eluted from the watershed were determined by using the117O val-ues of nitrate as tracers, with special emphasis on changes in the fate of atmospheric nitrate that had been deposited into the watershed. When compared with the values prior to strip-cutting, the annual export of atmospheric nitrate and remineralized nitrate increased by more than 13-fold and fourfold, respectively. These findings indicate that the under-story vegetation is important to the biological consumption of atmospheric nitrate, especially when significant quantities of nitrate were added to the forest floor through the spring snowmelt. Additionally, the major impact of strip-cutting was on the biological consumption processes of atmospheric nitrate, rather than the production processes of remineralized nitrate in soils. Nevertheless, the annual export flux of atmo-spheric nitrate corresponds to less than 14 % of atmoatmo-spheric nitrate deposited into the watershed. Although the removal processes of atmospheric nitrate in the forested soils were damaged by strip-cutting, the majority of these processes were still active after strip-cutting. This study clearly demon-strates that temporal variations in the117O values of nitrate in stream water can be a powerful tracer for quantification of artificial alternations in forested watersheds. Moreover, addi-tional measurements of the117O values of nitrate together withδ15N andδ18O enable correction of the contribution of atmospheric nitrate from the determined values and use of the correctedδ15N andδ18O values for evaluation of the be-havior of remineralized nitrate in soils.
Acknowledgements. We thank the two anonymous referees for their valuable comments and suggestions on an earlier version of this manuscript. Both the clear-cutting and subsequent strip-cutting experiments were conducted as part of a collaboration among Hokkaido University, the National Institute for Environmental Studies (NIES), and Hokkaido Electric Power Co. through the CC-LaG project. We thank the staff of the Teshio Experimental Forest for their long-term water sampling. Additionally, we are grateful to the members of the Biogeochemistry Group, Graduate School of Environmental Studies, Nagoya University, for their valuable support throughout this study. This work was supported by a grant-in-aid of Scientific Research from the Ministry of Education, Culture, Sports, Science and Technology of Japan under grant numbers 22651001, 23241001, 24651002, and 25121506.
Edited by: N. Ohte
References
Aleem, M. I. H., Hoch, G. E., and Varner, J. E.: Water as the source of oxidant and reductant in bacterial chemosynthesis, P. Natl. Acad. Sci. USA, 54, 869–873, 1965.
Alexander, B., Hastings, M. G., Allman, D. J., Dachs, J., Thorn-ton, J. A., and Kunasek, S. A.: Quantifying atmospheric nitrate formation pathways based on a global model of the oxygen iso-topic composition (117O) of atmospheric nitrate, Atmos. Chem. Phys., 9, 5043–5056, doi:10.5194/acp-9-5043-2009, 2009. Amberger, A. and Schmidt, H.-L.: Natürliche Isotopengehalte von
Nitrat als Indikatoren für dessen Herkunft, Geochim. Cos-mochim. Ac., 51, 2699–2705, 1987.
Andersson, K. K. and Hooper, A. B.: O2 and H2O are each
the source of one O in NO−2 produced from NH3 by
Ni-trosomonas: 15N-NMR evidence, FEBS Lett., 164, 236–240, doi:10.1016/0014-5793(83)80292-0, 1983.
Aravena, R. and Robertson, W. D.: Use of multiple isotope trac-ers to evaluate denitrification in ground water: study of nitrate from a large-flux septic system plume, Groundwater, 36, 975– 982, doi:10.1111/j.1745-6584.1998.tb02104.x, 1998.
Barnes, R. and Raymond, P. A.: Land-use controls on sources and processing of nitrate in small watersheds: insights from dual iso-topic analysis, Ecol. Appl., 20, 1961–1978, 2010.
Barnes, R., Raymond, P., and Casciotti, K.: Dual isotope analyses indicate efficient processing of atmospheric nitrate by forested watersheds in the northeastern US, Biogeochemistry, 90, 15–27, 2008.
Böhlke, J. K., Mroczkowski, S. J., and Coplen, T. B.: Oxygen iso-topes in nitrate: new reference materials for18O:17O:16O mea-surements and observations on nitrate-water equilibration, Rapid Commun. Mass Sp., 17, 1835–1846, 2003.
Breuer, L., Kiese, R., and Butterbach-Bahl, K.: Temperature and moisture effects on nitrification rates in tropical rain-forest soils, Soil Sci. Soc. Am. J., 66, 834–844, 2002.
Buchwald, C., Santoro, A. E., McIlvin, M. R., and Casciotti, K. L.: Oxygen isotopic composition of nitrate and nitrite produced by nitrifying cocultures and natural marine assemblages, Lim-nol. Oceanogr., 57, 1361–1375, doi:10.4319/lo.2012.57.5.1361, 2012.
Burns, D. A. and Kendall, C.: Analysis of δ15N and δ18O to differentiate NO−3 sources in runoff at two watersheds in the Catskill Mountains of New York, Water Resour. Res., 38, 1051, doi:10.1029/2001wr000292, 2002.
Burns, D. A., Boyer, E. W., Elliott, E. M., and Kendall, C.: Sources and transformations of nitrate from streams draining varying land uses: evidence from dual isotope analysis, J. Environ. Qual., 38, 1149–1159, doi:10.2134/jeq2008.0371, 2009.
Campbell, D. H., Kendall, C., Chang, C. C. Y., Silva, S. R., and Tonnessen, K. A.: Pathways for nitrate release from an alpine watershed: determination usingδ15N andδ18O, Water Resour. Res., 38, 1052, doi:10.1029/2001WR000294, 2002.
Casciotti, K. L., Böhlke, J. K., McIlvin, M. R., Mroczkowski, S. J., and Hannon, J. E.: Oxygen isotopes in nitrite: analysis, calibration, and equilibration, Anal. Chem., 79, 2427–2436, doi:10.1021/ac061598h, 2007.
isotope ratio measurements, Geophys. Res. Lett., 38, L15805, doi:10.1029/2011GL047539, 2011.
Curtis, C. J., Evans, C. D., Goodale, C. L., and Heaton, T. H. E.: What have stable isotope studies revealed about the na-ture and mechanisms of N saturation and nitrate leaching from semi-natural catchments?, Ecosystems, 14, 1021–1037, doi:10.1007/s10021-011-9461-7, 2011.
Dejwakh, N. R., Meixner, T., Michalski, G., and McIntosh, J.: Using 17O to investigate nitrate sources and sinks in a semi-arid groundwater system, Environ. Sci. Technol., 46, 745–751, doi:10.1021/es203450z, 2012.
Durka, W., Schulze, E.-D., Gebauer, G., and Voerkeliust, S.: Effects of forest decline on uptake and leaching of deposited nitrate de-termined from15N and18O measurements, Nature, 372, 765– 767, 1994.
EANET: Data Report 2011, Network center for EANET (Acid De-position Monitoring Network in East Asia), Nigata, Japan, 324 pp., 2013.
Fukuzawa, K., Shibata, H., Takagi, K., Nomura, M., Kurima, N., Fukazawa, T., Satoh, F., and Sasa, K.: Effects of clear-cutting on nitrogen leaching and fine root dynamics in a cool-temperate forested watershed in northern Japan, Forest Ecol. Manag., 225, 257–261, 2006.
Granger, J., Sigman, D. M., Lehmann, M. F., and Tortell, P. D.: Ni-trogen and oxygen isotope fractionation during dissimilatory ni-trate reduction by denitrifying bacteria, Limnol. Oceanogr., 53, 2533–2545, 2008.
Grennfelt, P. and Hultberg, H.: Effects of nitrogen deposition on the acidification of terrestrial and aquatic ecosystems, Water Air Soil Poll., 30, 945–963, 1986.
Hales, H. C., Ross, D. S., and Lini, A.: Isotopic signature of nitrate in two contrasting watersheds of Brush Brook, Vermont, USA, Biogeochemistry, 84, 51–66, doi:10.1007/S10533-007-9074-6, 2007.
Hirota, A., Tsunogai, U., Komatsu, D. D., and Nakagawa, F.: Si-multaneous determination ofδ15N andδ18O of N2O andδ13C of
CH4in nanomolar quantities from a single water sample, Rapid
Commun. Mass Sp., 24, 1085–1092, doi:10.1002/Rcm.4483, 2010.
Högberg, P.: Tansley Review No. 9515N natural abundance in soil-plant systems, New Phytol., 137, 179–203, 1997.
Hoyle, F. C., Murphy, D. V., and Fillery, I. R. P.: Temperature and stubble management influence microbial CO2-C evolution and
gross N transformation rates, Soil Biol. Biochem., 38, 71–80, 2006.
Kaiser, J., Hastings, M. G., Houlton, B. Z., Röckmann, T., and Sigman, D. M.: Triple oxygen isotope analysis of nitrate using the denitrifier method and thermal decomposition of N2O, Anal.
Chem., 79, 599–607, doi:10.1021/ac061022s, 2007.
Kendall, C.: Tracing nitrogen sources and cycling in catchments, in: Isotope Tracers in Catchment Hydrology, edited by: Kendall, C., and McDonnell, J. J., Elsevier Science B. V., Amsterdam, 519– 576, 1998.
Kendall, C., Campbell, D. H., Burns, D. A., Schanley, J. B., Silva, S. R., and Chang, C. C. Y.: Tracing sources of ni-trate in snowmelt runoff using the oxygen and nitrogen iso-topic compositions of nitrate, in: Biogeochemistry of season-ally snow-covered catchments, Proceedings of a Boulder Sym-posium, IAHS Publication, 339–347, 1995.
Komatsu, D. D., Ishimura, T., Nakagawa, F., and Tsunogai, U.: Determination of the 15N/14N, 17O/16O, and 18O/16O ra-tios of nitrous oxide by using continuous-flow isotope-ratio mass spectrometry, Rapid Commun. Mass Sp., 22, 1587–1596, doi:10.1002/rcm.3493, 2008.
Konno, U., Tsunogai, U., Komatsu, D. D., Daita, S., Nakagawa, F., Tsuda, A., Matsui, T., Eum, Y.-J., and Suzuki, K.: Determination of total N2fixation rates in the ocean taking into account both the
particulate and filtrate fractions, Biogeosciences, 7, 2369–2377, doi:10.5194/bg-7-2369-2010, 2010.
Kumar, S., Nicholas, D. J. D., and Williams, E. H.: Definitive15N NMR evidence that water serves as a source of “O” during nitrite oxidation by nitrobacter agilis, FEBS Lett., 152, 71–74, 1983. Likens, G. E., Bormann, F. H., Johnson, N. M., Fisher, D. W., and
Pierce, R. S.: Effects of forest cutting and herbicide treatment on nutrient budgets in the Hubbard Brook watershed-ecosystem, Ecol. Monogr., 40, 23–47, 1970.
Liu, T., Wang, F., Michalski, G., Xia, X., and Liu, S.: Using
15N, 17O, and 18O to determine nitrate sources in the
Yel-low River, China, Environ. Sci. Technol., 47, 13412–13421, doi:10.1021/es403357m, 2013.
Lohse, K. A., Sanderman, J., and Amundson, R.: Identifying sources and processes influencing nitrogen export to a small stream using dual isotopes of nitrate, Water Resour. Res., 49, 5715–5731, doi:10.1002/wrcr.20439, 2013.
Luz, B. and Barkan, E.: Assessment of oceanic productivity with the triple-isotope composition of dissolved oxygen, Science, 288, 2028–2031, doi:10.1126/science.288.5473.2028, 2000. McCabe, J. R., Thiemens, M. H., and Savarino, J.: A record
of ozone variability in South Pole Antarctic snow: role of nitrate oxygen isotopes, J. Geophys. Res., 112, D12303, doi:10.1029/2006jd007822, 2007.
McIlvin, M. R. and Altabet, M. A.: Chemical conversion of nitrate and nitrite to nitrous oxide for nitrogen and oxygen isotope anal-ysis in freshwater and seawater, Anal. Chem., 77, 5589–5595, doi:10.1021/ac050528s, 2005.
Michalski, G., Savarino, J., Böhlke, J. K., and Thiemens, M.: De-termination of the total oxygen isotopic composition of nitrate and the calibration of a117O nitrate reference material, Anal. Chem., 74, 4989–4993, doi:10.1021/Ac0256282, 2002. Michalski, G., Scott, Z., Kabiling, M., and Thiemens, M. H.: First
measurements and modeling of 117O in atmospheric nitrate, Geophys. Res. Lett., 30, 1870, doi:10.1029/2003GL017015, 2003.
Michalski, G., Meixner, T., Fenn, M., Hernandez, L., Sirulnik, A., Allen, E., and Thiemens, M.: Tracing atmospheric nitrate deposi-tion in a complex semiarid ecosystem using117O, Environ. Sci. Technol., 38, 2175–2181, 2004.
Miller, M. F.: Isotopic fractionation and the quantification of17O anomalies in the oxygen three-isotope system: an appraisal and geochemical significance, Geochim. Cosmochim. Ac., 66, 1881– 1889, 2002.
Mizota, C. and Kusakabe, M.: Spatial distribution ofδD-δ18O val-ues of surface and shallow groundwaters from Japan, south Ko-rea and east China, Geochem. J., 28, 387–410, 1994.
Morin, S., Savarino, J., Frey, M. M., Yan, N., Bekki, S., Botten-heim, J. W., and Martins, J. M. F.: Tracing the origin and fate of NOX in the Arctic atmosphere using stable isotopes in nitrate,
Morin, S., Savarino, J., Frey, M. M., Domine, F., Jacobi, H. W., Kaleschke, L., and Martins, J. M. F.: Comprehensive isotopic composition of atmospheric nitrate in the Atlantic Ocean bound-ary layer from 65◦S to 79◦N, J. Geophys. Res., 114, D05303, doi:10.1029/2008jd010696, 2009.
Nakagawa, F., Tsunogai, U., Gamo, T., and Yoshida, N.: Stable isotopic compositions and fractionations of carbon monoxide at coastal and open ocean stations in the Pacific, J. Geophys. Res., 109, C06016, doi:10.1029/2001JC001108, 2004.
Nakagawa, F., Suzuki, A., Daita, S., Ohyama, T., Komatsu, D. D., and Tsunogai, U.: Tracing atmospheric nitrate in groundwater us-ing triple oxygen isotopes: evaluation based on bottled drinkus-ing water, Biogeosciences, 10, 3547–3558, doi:10.5194/bg-10-3547-2013, 2013.
Nestler, A., Berglund, M., Accoe, F., Duta, S., Xue, D., Boeckx, P., and Taylor, P.: Isotopes for improved management of nitrate pol-lution in aqueous resources: review of surface water field stud-ies, Environ. Sci. Pollut. Res., 18, 519–533, doi:10.1007/s11356-010-0422-z, 2011.
Noguchi, I., Hayashi, K., Aikawa, M., Ohizumi, T., Minami, Y., Kitamura, M., Takahashi, A., Tanimoto, H., Matsuda, K., and Hara, H.: Temporal trend of non-sea salt sulfate and nitrate in wet deposition in Japan, Water Air and Soil Poll., 7, 67–75, 2007a. Noguchi, I., Otsuka, H., Akiyama, M., Sakai, S., and Kato, T.:
Measuring concentrations of nitrous acid gas by the filter-pack sampling method, J. Japan Soc. Atmos. Environ., 42, 162–174, 2007b (in Japanese with English abstract).
Noguchi, I., Yamaguchi, T., Kawamura, M., Matsumoto, R., and Matsuda, K.: Updated program file for dry deposition velocity es-timation based on the inferential method (Ver.4.1), Report of In-stitute of Environmental Sciences, 1, 21–31, 2011 (in Japanese). Ohte, N., Sebestyen, S. D., Shanley, J. B., Doctor, D. H., Kendall, C., Wankel, S. D., and Boyer, E. W.: Trac-ing sources of nitrate in snowmelt runoff usTrac-ing a high-resolution isotopic technique, Geophys. Res. Lett., 31, L21506, doi:10.1029/2004GL020908, 2004.
Ohte, N., Tayasu, I., Kohzu, A., Yoshimizu, C., Osaka, K., Mak-abe, A., Koba, K., Yoshida, N., and Nagata, T.: Spatial dis-tribution of nitrate sources of rivers in the Lake Biwa wa-tershed, Japan: controlling factors revealed by nitrogen and oxygen isotope values, Water Resour. Res., 46, W07505, doi:10.1029/2009wr007871, 2010.
Ohte, N.: Tracing sources and pathways of dissolved nitrate in forest and river ecosystems using high-resolution isotopic techniques: a review, Ecol. Res., 28, 749–757, 2013.
Pellerin, B., Saraceno, J., Shanley, J., Sebestyen, S., Aiken, G., Wollheim, W., and Bergamaschi, B.: Taking the pulse of snowmelt: in situ sensors reveal seasonal, event and diurnal pat-terns of nitrate and dissolved organic matter variability in an up-land forest stream, Biogeochemistry, 108, 183–198, 2012. Piatek, K. B., Mitchell, M. J., Silva, S. R., and Kendall, C.: Sources
of nitrate in snowmelt discharge: evidence from water chemistry and stable isotopes of nitrate, Water Air Soil Poll., 165, 13–35, 2005.
Savarino, J., Kaiser, J., Morin, S., Sigman, D. M., and Thiemens, M. H.: Nitrogen and oxygen isotopic constraints on the origin of atmospheric nitrate in coastal Antarctica, At-mos. Chem. Phys., 7, 1925–1945, doi:10.5194/acp-7-1925-2007, 2007.
Spoelstra, J., Schiff, S. L., Hazlett, P. W., Jeffries, D. S., and Semkin, R. G.: The isotopic composition of nitrate produced from nitrification in a hardwood forest floor, Geochim. Cos-mochim. Ac., 71, 3757–3771, doi:10.1016/J.Gca.2007.05.021, 2007.
Swank, W. T., Vose, J. M., and Elliott, K. J.: Long-term hydrologic and water quality responses following commercial clearcutting of mixed hardwoods on a southern Appalachian catchment, For-est Ecol. Manag., 143, 163–178, 2001.
Takagi, K., Fukuzawa, K., Liang, N., Kayama, M., Nomura, M., Hojyo, H., Sugata, S., Shibata, H., Fukazawa, T., Takahashi, Y., Nakaji, T., Oguma, H., Mano, M., Akibayashi, Y., Murayama, T., Koike, T., Sasa, K., and Fujinuma, Y.: Change in CO2balance
under a series of forestry activities in a cool-temperate mixed forest with dense undergrowth, Glob. Change Biol., 15, 1275– 1288, doi:10.1111/j.1365-2486.2008.01795.x, 2009.
Thibodeau, B., Hélie, J.-F., and Lehmann, M. F.: Variations of the nitrate isotopic composition in the St. Lawrence River caused by seasonal changes in atmospheric nitrogen inputs, Biogeochem-istry, 115, 287–298, 2013.
Tietema, A., Emmett, B. A., Gundersen, P., Kjonaas, O. J., and Koopmans, C. J.: The fate of N-15-labelled nitrogen deposi-tion in coniferous ecosystems, Forest Ecol. Manag., 101, 19–27, 1998.
Tobari, Y., Koba, K., Fukushima, K., Tokuchi, N., Ohte, N., Tateno, R., Toyoda, S., Yoshioka, T., and Yoshida, N.: Con-tribution of atmospheric nitrate to stream-water nitrate in Japanese coniferous forests revealed by the oxygen isotope ratio of nitrate, Rapid Commun. Mass Sp., 24, 1281–1286, doi:10.1002/rcm.4498, 2010.
Tsunogai, U., Yoshida, N., Ishibashi, J., and Gamo, T.: Car-bon isotopic distribution of methane in deep-sea hydrothermal plume, Myojin Knoll Caldera, Izu-Bonin arc: implications for microbial methane oxidation in ocean and applications to heat flux estimation, Geochim. Cosmochim. Ac., 64, 2439–2452, doi:10.1016/S0016-7037(00)00374-4, 2000.
Tsunogai, U., Nakagawa, F., Komatsu, D. D., and Gamo, T.: Stable carbon and oxygen isotopic analysis of atmospheric carbon monoxide using continuous-flow isotope ratio MS by isotope monitoring of CO, Anal. Chem., 74, 5695–5700, doi:10.1021/ac020290x, 2002.
Tsunogai, U., Nakagawa, F., Gamo, T., and Ishibashi, J.: Stable isotopic compositions of methane and carbon monoxide in the Suiyo hydrothermal plume, Izu-Bonin arc: tracers for microbial consumption/production, Earth Planet. Sci. Lett., 237, 326–340, doi:10.1016/j.epsl.2005.05.042, 2005.
Tsunogai, U., Kido, T., Hirota, A., Ohkubo, S. B., Komatsu, D. D., and Nakagawa, F.: Sensitive determinations of stable nitrogen isotopic composition of organic nitrogen through chemical con-version into N2O, Rapid Commun. Mass Sp., 22, 345–354,
doi:10.1002/rcm.3368, 2008.
Tsunogai, U., Komatsu, D. D., Daita, S., Kazemi, G. A., Naka-gawa, F., Noguchi, I., and Zhang, J.: Tracing the fate of atmo-spheric nitrate deposited onto a forest ecosystem in eastern Asia using117O, Atmos. Chem. Phys., 10, doi:10.5194/acp-10-1809-2010, 1809–1820, 2010.
lake using117O, Biogeosciences, 8, 687–702, doi:10.5194/bg-8-687-2011, 2011.
Vitousek, P. M. and Melillo, J. M.: Nitrate losses from disturbed forests: patterns and mechanisms, Forensic Science, 25, 605– 619, 1979.
Wada, E., Kadonaga, T., and Matsuo, S.:15N abundance in nitro-gen of naturally occurring substances and global assessment of denitrification from isotopic viewpoint, Geochem. J., 9, 139–148, 1975.
Williams, M. W., Baron, J. S., Caine, N., Sommerfeld, R., and San-ford, R.: Nitrogen Saturation in the Rocky Mountains, Environ. Sci. Technol., 30, 640–646, 1996.
Williard, K. W. J., DeWalle, D. R., Edwards, P. J., and Sharpe, W. E.:18O isotopic separation of stream nitrate sources in mid-Appalachian forested watersheds, J. Hydrol., 252, 174– 188, 2001.
Yamazaki, A., Watanabe, T., and Tsunogai, U.: Nitrogen iso-topes of organic nitrogen in reef coral skeletons as a proxy of tropical nutrient dynamics, Geophys. Res. Lett., 38, L19605, doi:10.1029/2011GL049053, 2011.
Yue, F.-J., Li, S.-L., Zhao, Z.-Q., and Hu, J.: Using dual iso-topes to evaluate sources and transformation of nitrogen in the Liao River, northeast China, Appl. Geochem., 36, 1–9, doi:10.1016/j.apgeochem.2013.06.009, 2013.