www.ann-geophys.net/27/3631/2009/
© Author(s) 2009. This work is distributed under the Creative Commons Attribution 3.0 License.
Annales
Geophysicae
Multi-scale forcing and the formation of subtropical desert and
monsoon
G. X. Wu1, Y. Liu1, X. Zhu1,2, W. Li3, R. Ren1, A. Duan1, and X. Liang3
1State Key Laboratory of Numerical Modeling for Atmospheric Sciences and Geophysical Fluid Dynamics (LASG), Institute of Atmospheric Physics (IAP), Chinese Academy of Sciences, Beijing 100029, China
2Graduate University of Chinese Academy of Sciences, Beijing, China
3National Climate Center, China Meteorological Administration, Beijing 100081, China
Received: 19 March 2009 – Revised: 30 July 2009 – Accepted: 7 September 2009 – Published: 29 September 2009
Abstract. This study investigates three types of atmospheric forcing across the summertime subtropics that are shown to contribute in various ways to the occurrence of dry and wet climates in the subtropics. To explain the formation of desert over the western parts of continents and monsoon over the eastern parts, we propose a new mechanism of positive feed-back between diabatic heating and vorticity generation that occurs via meridional advection of planetary vorticity and temperature. Monsoon and desert are demonstrated to coex-ist as twin features of multi-scale forcing, as follows.
First, continent-scale heating over land and cooling over ocean induce the ascent of air over the eastern parts of con-tinents and western parts of oceans, and descent over east-ern parts of oceans and westeast-ern parts of continents. Sec-ond, local-scale sea-breeze forcing along coastal regions en-hances air descent over eastern parts of oceans and ascent over eastern parts of continents. This leads to the forma-tion of the well-defined summertime subtropical LOSECOD quadruplet-heating pattern across each continent and adja-cent oceans, with long-wave radiative cooling (LO) over eastern parts of oceans, sensible heating (SE) over western parts of continents, condensation heating (CO) over east-ern parts of continents, and double dominant heating (D: LO+CO) over western parts of oceans. Such a quadru-plet heating pattern corresponds to a dry climate over the western parts of continents and a wet climate over eastern parts. Third, regional-scale orographic-uplift-heating gener-ates poleward ascending flow to the east of orography and equatorward descending flow to the west.
The Tibetan Plateau (TP) is located over the eastern Eurasian continent. The TP-forced circulation pattern is in phase with that produced by continental-scale forcing, and the strongest monsoon and largest deserts are formed over
Correspondence to: Y. Liu
the Afro-Eurasian Continent. In contrast, the Rockies and the Andes are located over the western parts of their respec-tive continents, and orography-induced ascent is separated from ascent due to continental-scale forcing. Accordingly, the deserts and monsoon climate over these continents are not as strongly developed as those over the Eurasian Conti-nent.
A new mechanism of positive feedback between diabatic heating and vorticity generation, which occurs via merid-ional transfer of heat and planetary vorticity, is proposed as a means of explaining the formation of subtropical desert and monsoon. Strong low-level longwave radiative cooling over eastern parts of oceans and strong surface sensible heating on western parts of continents generate negative vorticity that is balanced by positive planetary vorticity advection from high latitudes. The equatorward flow generated over eastern parts of oceans produces cold sea-surface temperature and stable stratification, leading in turn to the formation of low stratus clouds and the maintenance of strong in situ longwave ra-diative cooling. The equatorward flow over western parts of continents carries cold, dry air, thereby enhancing local sen-sible heating as well as moisture release from the underlying soil. These factors result in a dry desert climate. Over the eastern parts of continents, condensation heating generates positive vorticity in the lower troposphere, which is balanced by negative planetary vorticity advection of the meridional flow from low latitudes. The flow brings warm and moist air, thereby enhancing local convective instability and condensa-tion heating associated with rainfall. These factors produce a wet monsoonal climate. Overall, our results demonstrate that subtropical desert and monsoon coexist as a consequence of multi-scale forcing along the subtropics.
cloud, resulting in subtropical aridity. However, severe sub-tropical arid climates occur during summer when the Hadley Cell is weakest, whereas such aridity is weak during winter when the Hadley Cell is strongest. In addition, many moist, monsoonal areas also exist within the subtropics. Therefore, the climate in such areas cannot be readily explained in terms of the traditional view (i.e., the Hadley Cell).
Charney (1975) proposed a local biosphere-albedo-atmosphere feedback mechanism to explain the enhancement of the Sahel Desert, arguing that over-grazing in arid areas increases surface albedo, and that radiative heat loss over desert areas is compensated by adiabatic descent, which in return results in a decrease in relative humidity and leads to desertification. Such a localized mechanism ignores the in-fluence of advection, and is applicable only to tropical areas (e.g., Bounoua and Krishnamurti, 1991), where the Burger Number is large (Hoskins, 1986).
Most deserts are found in the subtropics, where the Burger Number is close to one. In these areas, the advection of heat is comparable with adiabatic heating in balancing ex-ternal heating, and cannot be ignored when considering the formation of desert. Yang et al. (1992) proposed a link-age between aridity and convection via a closed overturn-ing “Walker Cell.” Usoverturn-ing trajectory analysis, Rodwell and Hoskins (1996) found that descent over the eastern Sa-hara, Mediterranean, and Kyzylkum Desert are mainly of mid-latitude origin (their Fig. 9) rather than resulting from Walker-type circulation. The authors proposed a monsoon-desert mechanism for monsoon-desertification whereby remote dia-batic heating in the Asian monsoon region induces a Rossby-wave pattern to the west, resulting in clear sky and creating a local diabatic enhancement “which effectively doubles the strength of descent.”
Across the subtropics, zonal advection of vorticity or tem-perature is weak. In the present study, after investigating the characteristics of atmospheric forcing across the sum-mer subtropics at different spatial scales, a new mechanism is proposed for the enhancement of dry and moist climate, involving a positive feedback between diabatic heating and vorticity generation via meridional advection of planetary vorticity and temperature. With reference to this mechanism, desert over the western parts of continents and monsoon over the eastern parts of continents are demonstrated to represent coexisting twin features of a single system.
cal arid and wet climates are considered in Sect. 6. Section 7 provides a summary of the main findings.
2 Data and model
We employed the reanalysis of the National Centers for En-vironment Prediction/National Center for Atmospheric Re-search (NCEP/NCAR; Kalnay et al., 1996) and Xie-Arkin data (Xie and Arkin, 1996) from 1980 to 1997 to investigate the separate and combined impacts of different thermal forc-ings on the formation of monsoon and desert. Diabatic heat-ing in the NECP/NCAR reanalysis is not observation data, but the product of a general circulation model (GCM) that depends on physical parameterization schemes (Newman et al., 2000). Comparisons among NCEP heating, Q1 from ECMWF data (Nigam et al., 2000; Rodwell and Hoskins, 2001), and TOGA data (Lin and Johnson, 1996) reveal simi-lar horizontal distributions of column-integrated heating and the vertical heating profile.
Duan and Wu (2005) compared NCEP reanalysis data and two other data sets: observations from six Automatic Weather Stations upon the Tibetan Plateau (abbreviated as TP hereafter) from July 1993 to March 1999 (Li et al., 2001), and GAME-IOP reanalysis data from 1 April to 31 Oc-tober 1998, as compiled by the Japan Meteorological Re-search Institute and the Japanese Meteorological Agency (Yamazaki et al., 2000a, b; see also http://game.suiri.tsukuba. ac.jp/cdroms/CD-ROM.html). The comparison revealed that the surface sensible heat flux and latent heat flux provided by NCEP/NCAR agree with the AWS data, and there is no significant difference in spatial/temporal variations and mag-nitude between the NCEP/NCAR and GAME-IOP daily data sets. This finding validates the use of the NCEP/NCAR re-analysis in the present study, although a degree of caution is required because AWS and GAME-IOP data have limited spatial/temporal coverage.
component (Liu and Wu, 1997). The GOALS climate model can simulate the mean climate reasonably well and has been used in climate studies for a variety of purposes (IPCC, 2001; Kang et al., 2002).
In this study, the required sea surface temperature (SST) and sea ice are prescribed based on climate mean observation data for the period 1979–1988, as compiled for the Atmo-spheric Model Intercomparison Program (AMIP). Because the adjustment period measured by the global mean surface temperature is about 6 months for each experiment (data not shown), all the experiments in this study are integrated for 12 model years, and the monthly means for the last 10 years are calculated for comparison.
3 Land-sea distribution and continental-scale LOSECOD heating
The global distributions of column-integrated total diabatic heating in January and July are shown in Fig. 1a and b, re-spectively. The total diabatic heating includes diffusive sen-sible heating (SE), condensation latent heating (CO), long-wave radiative cooling (LO), and short-long-wave radiative heat-ing (SH). The atmosphere along the equator and in near-equator tropical areas is a strong heating source except over the eastern Pacific and Atlantic, where it becomes a perma-nent heat sink in association with the existence of in situ cold tongues of SST. There is generally no apparent seasonal change in these tropical areas. In contrast to the tropics, a marked seasonal change in total diabatic heating occurs in the extra-tropics. In January (Fig. 1a), during the North-ern Hemisphere winter, atmospheric heating is positive over oceans, but negative over continents. The Southern Hemi-sphere is in summer during January, and the atmoHemi-sphere is characterized by heating over continents and cooling over oceans. In the northern extra-tropics during July (Fig. 1b), atmospheric heating occurs over continents, whereas cool-ing occurs over oceans. The Southern Hemisphere is in win-ter at this time, and atmospheric heating over continents is negative, while weak atmospheric heating is observed over mid-latitude oceans. In summary, the total heating in the summer extra-tropics is positive over continents, but nega-tive over oceans:
P0
Z
0
Qdp
g >0, over continents (1)
P0
Z
0
Qdp
g <0, over oceans, (2)
whereQrepresents total heating (=SE+CO+LO+SH),P0is surface pressure, andgis acceleration due to gravity.
[image:3.595.309.546.62.221.2]According to the PV−θview (Hoskins, 1991) and the the-ory of thermal adaptation (Wu and Liu, 2000; Liu et al.,
Fig. 1. Distributions of column-integrated total heating averaged
over the period 1980–1997 for January (a) and July (b). Unit is W m−2.
2001), the atmosphere is expected to respond to summertime continental heating by the generation of cyclonic circulation in the lower troposphere and anticyclonic circulation in the upper troposphere (Fig. 2a), whereas it responds to cooling over oceans by the generation of anticyclonic circulation near the surface and cyclonic circulation in the upper troposphere (Fig. 2b). Because in summertime the zonal flow and vortic-ity advection across the subtropics are weak, the quasi-steady state geostrophic vorticity equation,
u∂ζ ∂x+v
∂ζ
∂y = −βv−f∇ ·V
can be simplified to
0≈ −βv−f∇ ·V. (3)
Under the first-order approximation 0≈∇·V+∂w
∂z, Eq. (3) can be rewritten as
∂w ∂z ≈
β fv.
By assuming a characteristic heightH and a normal mode distribution ofwwith height, we have
w∝ −H2∂
2w
∂z2 ∝ − βH2
f · ∂v
∂z . (4)
Fig. 2. Schematic diagram showing atmospheric adaptation on the rotating earth to external heating in the summertime subtropics: (a)
Di-abatic heating generates cyclonic circulation (C) near the surface and anticyclone circulation (A) in the upper troposphere, with air ascent developing over the eastern part of the circulation and descent over the western part. (b) Diabatic cooling generates anticyclonic circulation near the surface and cyclone circulation in the upper troposphere, with air descent developing over the eastern part of the circulation and ascent over the western part.
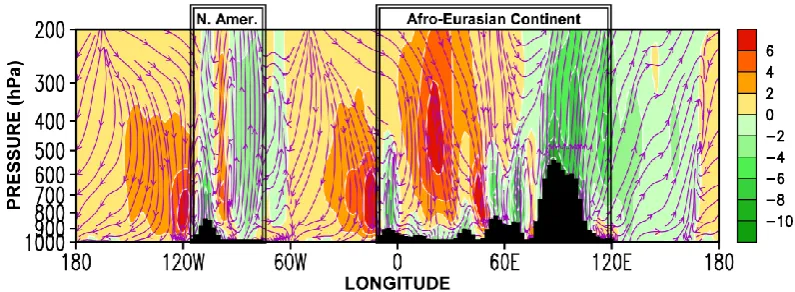
Fig. 3. July mean vertical cross-section of subtropical circulation along 30◦N (vertical velocity has been amplified by a factor of 100). The boxes indicate the locations of the North American and Afro-Eurasian continents. Black shading indicates orography, and color shading indicates the intensity of the vertical p-velocityω(interval, 2 Pa s−1), as shown in the color scale to the right.
eastern side of the heating region over continent and the west-ern side of the cooling region over ocean. In other words, the ascending motion over the eastern continent and the western ocean is forced by the negative vertical shear of the in situ meridional wind, as described in Eq. (4). In contrast, the vertical shear of the in situ meridional wind is positive on the western side of the heating region over continent and the eastern side of the cooling region over ocean. According to Eq. (4), descending motion should develop in these regions, as shown schematically in Fig. 2.
Figure 3 shows the July mean vertical cross-section of streamline (u, w)along 30◦N, in which the vertical velocity has been amplified by a factor of 100. The general features in the cross-section show a good fit with the thermal adap-tation described above: ascending motions develop over the eastern parts of the North American and Eurasian continents and over the western parts of the North Pacific and North At-lantic, whereas descending motions develop over the west-ern parts of the North American and Eurasian continents and over the eastern parts of North Pacific and North Atlantic.
4 Local-scale sea breeze and heating pattern across the summertime subtropics
The color shading in Fig. 3 shows the magnitude of the verti-cal p-velocityω along 30◦N. Although ascending motions develop over both eastern parts of continents and western parts of oceans, the rising over land is apparently stronger than over the sea to the east. Similarly, the descending mo-tion over the eastern ocean is much stronger than that over the neighboring land to the east. This feature can also be de-tected from the distributions of heating/cooling in the sum-mertime subtropics (see Fig. 1): atmospheric heating over the eastern subtropical continents is always stronger than that over the neighboring ocean to the east, and atmospheric cooling over the eastern subtropical oceans is always the strongest along the subtropical zones.
[image:4.595.98.496.259.405.2]Fig. 4. Distributions of the monthly mean velocity potential
(shad-ing, unit is 10−6m2s−1)and divergent wind (arrows, m s−1)at 1000 hPa in January (a) and July (b).
over land and high over ocean. Air flows from land to ocean, occurring as a land-breeze except over the eastern subtropi-cal North Atlantic. In July (Fig. 4b) in the Northern Hemi-sphere, the velocity potential is low over oceans and high over continents. During this month, a strong sea breeze dom-inates coastal regions in the summertime extra-tropics. This seasonal contrast in the occurrences of land and sea breezes is also evident in the Southern Hemisphere, although not as prominent as that in the Northern Hemisphere.
In summary, summertime sea breezes along subtropical coastal regions form a localized circulation, with ascend-ing motion over coastal land and descendascend-ing motion over the adjacent coastal sea. When such a localized sea-breeze circulation is superimposed on the continental-scale circula-tion induced by the land-sea distribucircula-tion (see Fig. 2), the as-cending motion over the eastern continent is enhanced, while the ascending motion over the neighboring western ocean re-gion, to the east of the continent, is suppressed to some ex-tent. Similarly, the descending motion over the eastern ocean region is intensified, while the descending motion over the neighboring western continent is weakened. These findings explain the asymmetry in the observed distribution of vertical velocity (Fig. 3).
The distribution of vertical motion associated with continental-scale forcing and local sea breeze is closely re-lated to in situ heating/cooling. Figure 5 shows various verti-cal heating profiles at different sites across the North Amer-ican and Eurasian continents along 30◦N in July. The loca-tions of the selected sites are as follows: LO (122◦W, 30◦N), SE (108◦W, 30◦N), CO (80◦W, 30◦N), and D (60◦W, 30◦N) for North America (Fig. 5a), and LO (24◦W, 30◦N), SE (0, 30◦N), CO (120◦E, 30◦N), and D (145◦E, 30◦N) for Afro-Eurasia (Fig. 5b). These sites are located within differ-ent heating lobes (see Fig. 6b), and are represdiffer-entative of the heating characteristics of the surrounding areas. Site LO is
located over the eastern ocean, where the column-integrated total heating is negative. The strong atmospheric sinking in the region (Fig. 3) indicates strong atmospheric cooling. The characteristics of heating in this region can be described as follows:
At Site LO, p0 R 0
Qdpg <0;
V · ∇θ <0, in the free atmosphere.
(5)
In these LO regions, condensation heating is very weak, and surface sensible heating is negligible (Fig. 5, left-hand pan-els). These regions are located to the east of surface oceanic anticyclones that are produced by summertime atmospheric cooling over oceans, as discussed in Sect. 3, and are marked by strong equatorward surface wind-drag. Because the SST in these regions is cold due to the upwelling of cold sea water in association with surface equatorward flow, and because the atmosphere is subject to adiabatic warming due to strong de-scent, atmospheric stratification in the boundary layer is sta-ble, and low-level stratus cloud is formed persistently (data not shown). The total heating profile is therefore dominated by long-wave radiative cooling, with a maximum cooling of about 6◦C per day at about 900 hPa, close to the top of the low-level stratus cloud.
Site SE is located over the western continent, where column-integrated total heating is positive (Fig. 1b). Weak atmospheric sinking in this region (Fig. 3) indicates cooling in the free atmosphere. The characteristics of heating in this region can be described as follows:
At Site SE, p0 R 0
Qdpg >0;
V · ∇θ <0, in the free atmosphere.
(6)
Therefore, atmospheric heating should be confined to the boundary layer, and the total heating profile in this region follows the diffusive sensible heating profile (Fig. 5, panels located second from left).
Site CO is located over the eastern continent, where column-integrated total heating is strongly positive. The at-mosphere ascends intensely in this region (Fig. 3), indicating strong heating in the free atmosphere. The characteristics of heating in this region can be described as follows:
At Site CO, p0 R 0
Qdpg >0;
V · ∇θ >0, in the free atmosphere.
(7)
Therefore, the total heating profile in this region is strongly consistent with the profile of deep condensation heating (Fig. 5, panels located third from left).
Fig. 5. July mean vertical heating profiles in sigma (σ )coordinates for locations LO, SE, CO, and D (see Fig. 6b for locations) across
(a) North America and adjacent oceans, and (b) the Afro-Eurasian Continent and adjacent oceans (after Wu and Liu, 2003; Liu et al., 2004).
The lines with open squares, filled squares, open circles, and “plus” signs represent long-wave radiative cooling (LO), diffusive sensible heating (SE), deep convective condensation heating (CO), and total heating, respectively. Unit is K d−1.
characteristics of heating in this region can be described as follows:
At Site D,
p0
R
0
Qdpg <0;
V · ∇θ >0, in the free atmosphere.
(8)
Therefore, the total heating profile in this region is deter-mined by two dominant heating profiles: long-wave radiative cooling (LO) and condensation heating (CO) (Fig. 5, right-hand panels).
When these dominant heating features are linked side by side, it is then possible to explain the formation of the specific summertime heating pattern identified by Wu and Liu (2003, Figs. 3b and 4b) and Liu et al. (2004). As demonstrated in Figs. 6b and 7b, in both hemispheres the dominant summer-time subtropical heating, from west to east across each con-tinent and adjacent oceans, is well organized into a specific pattern: long-wave radiative cooling (LO) to the west of the continent, surface sensible heating (SE) in the western part of the continent, deep condensation heating (CO) in the eastern part, and double dominant heating (D=LO+CO) to the east.
Consequently, the summertime subtropical diabatic heating shows a mosaic of the LOSECOD quadruplet heating pat-tern.
The summertime zonal flow along the subtropics is weak, and the atmospheric adaptation to external heating is man-ifest as the following Sverdrup vorticity balance (Wu and Liu, 2000; Liu et al., 2001) or, to distinguish this equation from the oceanic Sverdrup balance, thermal vorticity balance (TVB):
βv≈θz−1(f+ζ )∂Q
∂z. (9)
Fig. 6. Distributions of July mean quadruplet LOSECOD dominant
heating (b, unit is W m−2; adopted from Fig. 3b of Wu and Liu, 2003), and circulation at 200 hPa (a) and 1000 hPa (c). Each grid along the subtropics has one continent in the center and is bounded by the longitudes at which the centers of sea-surface anticyclones are located. The abbreviations LO, SE, CO, and D in panel (b) indicate the geographic locations at which the vertical profiles of heating are plotted in Fig. 5.
upper troposphere. Therefore, in boreal summer, strong near-surface northerlies and upper-layer southerlies are expected to be generated over the eastern ocean and western conti-nent. Over the eastern continent and western ocean areas, the total heating increases with increasing height in the lower troposphere, and shows a rapid decrease with height in the upper troposphere. Therefore, near-surface southerlies and strong upper-layer northerlies are expected to be generated over these areas. The same patterns apply to austral sum-mer; consequently, anticyclonic circulation appears in the upper troposphere over continents, with tilting troughs over oceans (Figs. 6a and 7a). Near the surface, cyclone circu-lation is intensified over land, while anticyclone circucircu-lation is enhanced over ocean, especially over the eastern ocean (Figs. 6c and 7c).
5 Local positive feedback mechanism and development of dry and wet climate
[image:7.595.308.545.64.269.2]In nature, the atmospheric heating source is not just the cause of atmospheric motion: it is also a consequence of the gen-eral circulation (Eady, 1950). Atmospheric ascent over the eastern continent and descent over its western part, as in-duced by continental-scale and sea-breeze coastal-scale forc-ing, favor the occurrence of a wet climate event in the east and dry climate event in the west. However, the formation of
Fig. 7. Distributions of January mean quadruplet LOSECOD
domi-nant heating (b, unit is W m−2; adopted from Fig. 4b of Wu and Liu, 2003), and circulation at 200 hPa (a) and 1000 hPa (c). Each grid along the subtropics has one continent in the center and is bounded by the longitudes at which the centers of sea-surface anticyclones are located.
desert and monsoon requires the persistence of such events, requiring in turn a positive feedback mechanism.
Over the eastern ocean and western continent, the increase in radiative cooling with height in the LO region and the decrease in sensible heating with height in the SE region (Fig. 5) generate negative vorticity in the lower troposphere. In the absence of zonal advection and at a steady state, this negative vorticity generation is balanced mainly by positive planetary vorticity advection from higher latitudes, resulting in strong meridional wind from higher latitudes (Eq. 9). As discussed above, over the eastern parts of oceans, this strong equatorward meridional wind causes strong ocean upwelling and cold SST. The wind also enhances in situ stable strati-fication and sustains low-level stratus cloud and long-wave radiative cooling at the cloud top, thereby leading to the fur-ther generation of negative vorticity. Accordingly, a positive feedback is established between longwave radiative cooling and negative vorticity forcing.
Fig. 8. Distributions of “vertical velocity”ωat 500 hPa over (a) the Afro-Eurasia Continent in July, (b) North America in July, and (c) South America in January. Contour interval is 2×10⁻²Pa s−1. Solid and dashed lines indicate air descent and ascent, respectively; the green line denotes the zero isoline, and gray shading indicates topography above 1500 m.
Eq. 9). Dry, arid, and even desert-like climates are formed over the western continent, as shown in Figs. 6 and 7 (and also in Fig. 12, which is discussed later in the text).
Over the eastern continent and adjacent western ocean ar-eas, the increase in condensation heating with height (Fig. 5) generates positive vorticity. In the absence of zonal advec-tion and at a steady state, this positive vorticity generaadvec-tion is balanced mainly by negative planetary vorticity advec-tion from lower latitudes, resulting in strong meridional wind from lower latitudes (Eq. 9). This poleward meridional flow brings warm and moist air into the region, and creates con-vective instability, enabling convection to develop. Conden-sation heating is then sustained, and positive vorticity con-tinues to be generated. Thus, the meridional transfer of heat and vorticity generates a positive feedback between positive vorticity generation and condensation heating, until equili-brated by frictional dissipation. Wet and even monsoon-like climates are formed over the eastern continent, as shown in Figs. 6, 7, and 12.
6 Regional-scale orographic forcing and formation of monsoon and desert
Figures 1 and 3 reveal significant differences between East Asia and North and South America in the intensity of vertical motion and the horizontal extent of convective condensation heating. The ascending air over East Asia covers the area east of 75◦E, and becomes intense east of 90◦E (Fig. 3). In contrast, the ascent of air over North and South America is relatively weak, and the regions of ascending air produced
by mountain forcing and continental forcing are separated by descending air.
Such a phenomenon can be seen more clearly from the horizontal distribution of vertical velocity at 500 hPa, as shown in Fig. 8. Within the subtropics in Eurasia during July (Fig. 8a), atmospheric descent dominates the western part of the continent except over the Iran High, where orography-forced rising occurs. The centers of strong descent near 20◦E and 60◦E correspond to a Mediterranean-type persis-tent dry summertime climate and the Kyzylkum Desert, re-spectively; the strong ascent dominates the vast eastern con-tinent from 75◦E eastwards. Intense rising centers of greater than−8×10⁻²Pa s−1over the TP and East China are linked together. In contrast, the two rising centers over North Amer-ica (Fig. 8b) are separated by a region of descent: one ascend-ing center of−4×10⁻²Pa s−1is located over North Florida, and another center with similar intensity is located over the Rocky Mountains.
a)
b)
σ σ
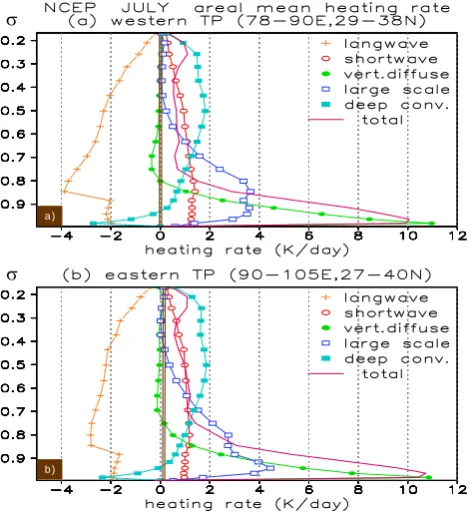
Fig. 9. July mean vertical profiles in -coordinates of……σ Fig. 9. July mean vertical profiles inσ-coordinate of various heat-ings over (a) the western Tibetan Plateau (78–90◦E, 29–38◦N) and
(b) the eastern Tibetan Plateau (90–105◦E, 27–40◦N). Lines with “plus” signs, open circles, filled circles, open squares, and filled squares represent long-wave radiative cooling, short-wave radiative heating, vertical diffusive heating, large-scale condensation heating, and convective condensation heating, respectively. Red solid lines indicate total heating. Unit is K d−1.
The above findings indicate that the East Asian monsoon is the strongest subtropical monsoon in the world, as also re-ported in many previous studies (e.g., Tao and Chen, 1987; Yanai and Li, 1994; Yanai and Wu, 2006). Other studies (Yeh et al., 1957; Wu et al., 1997b) have suggested that the strength of the East Asian monsoon is due to the existence of the TP. To further investigate the formation of the strong East Asian monsoon, we perform idealized numerical exper-iments to demonstrate how the location of the plateau affects the intensity and extent of desert and the East Asian mon-soon.
Figure 9 shows the July mean vertical heating profiles averaged over the western part of the TP (78–90◦E, 29– 38◦N) and the eastern part (90–105◦E, 27–40◦N). The mag-nitude of large-scale near-surface condensation heating over the eastern part of the plateau (4.5 K d−1)is slightly higher than that over the western part (3.5 K d−1), and the magni-tude of longwave radiative cooling over the western part is slightly stronger than that over the eastern part; however, all other types of heating are similar over the two parts. The profile of total heating is positive throughout the entire tro-posphere, with a striking maximum of about 10 K d−1near the surface. The atmospheric adaptation to such uplift
heat-ing is expected to generate strong surface cyclonic circu-lation and upper-layer anticyclonic circucircu-lation. The super-imposition of these orography-induced local circulations on continental-scale circulations is likely to affect the climate of the surrounding area.
To verify the above hypothesis, we performed idealized aqua-planet numerical experiments based on the GOALS SAMIL GCM, which is described in Sect. 2. An ideal-ized Afro-Eurasian continent, as outlined by the thick dashed lines in Figs. 10 and 11, is embedded into the aqua planet. The use of these types of aqua-planet sensitivity experiments can simplify the complicated dynamical diagnosis and accen-tuate the physics under consideration. Furthermore, because the outcomes of such experiments can be linked to the cor-responding theoretical understanding, ensemble evaluations are generally not required. The SST and sea ice are the zonal averaged AMIP products. The seasonal variable land-surface albedo and solar radiation are prescribed using the zonal av-eraged products of the long-term integration of the GOALS SAMIL GCM. The surface temperature over land is fore-casted in the model. The model is integrated for 12 years, and the outcomes from the last 10 years are extracted for the current analysis.
We performed three experiments, as briefly described in Table 1. The first experiment (NOMT) possesses only the land–sea distribution, mimicking the existence of the Afro-Eurasian Continent. In the second experiment (MT90), an idealized ellipsoidal “TP” is placed on the continent. Its max-imum height is 5000 m, and its center is located at 87.5◦E, 32.5◦N, mimicking the actual plateau. The third experiment (MT60) is the same as MT90, except that the center of the “TP” is moved to 60.0◦E, 32.5◦N, about 30◦to the west of its actual location.
[image:9.595.50.287.63.320.2]of the continent
In the MT60 experiment, in which the TP is superim-posed over the western central continent (Fig. 10b), all the above features that appear in the NOMT run (e.g., continen-tal cyclonic circulation, ITCZ, tropical monsoons, and the weak East Asian monsoon) are almost unchanged. How-ever, another cyclonic circulation is produced surrounding the plateau, and significant rainfall (>8 mm d−1) appears over the southeastern part of the plateau. This plateau-forced rainfall is geographically separated from the weak East Asian monsoon associated with continental-scale forcing.
In the MT90 experiment, in which the TP is located at its present-day position, with its center near 90◦E (Fig. 10c), we still observe most of the features produced by continen-tal forcing (see Fig. 10a). However, because the plateau has been moved eastward in this experiment, the cyclonic circulation surrounding the plateau, as shown in Fig. 10b, is also shifted eastward. Consequently, the rainfall forced by the plateau is merged into the rainfall band produced by continental-scale forcing, and they enhance each other. The East Asian monsoon now extends northward toward North China.
Figure 10d shows the differences between MT90 and NOMT in terms of daily rainfall and circulation at 925 hPa. The introduction of the “TP” intensifies not only the ITCZ, but also the East Asian monsoon rainfall, from the eastern part of the plateau to East China and Japan and Korea (shad-ing), but results in reduced rainfall over South Asia (dotted contours). This occurs because the plateau generates a strong northerly to its west and southwest, but induces a strong southerly to its east and northeast, as shown by the differ-ence flow (Fig. 10d).
To further illustrate the influence of the location of the TP on the formation of monsoon and desert, Fig. 11 shows the distributions of rainfall, meridional winds in the lower and upper troposphere, and a zonal vertical cross-section of sub-tropical circulation along 32.5◦N, as generated from exper-iments MT60 and MT90. In MT60 (Fig. 11a–c), there ex-ist two anticyclonic circulations at 200 hPa (Fig. 11a) and two related cyclonic circulations at 850 hPa (Fig. 11b), cor-responding to continental-scale forcing and plateau forcing,
respectively. Subtropical rainfall possesses two centers: one over the eastern plateau and the other over East Asia. The vertical cross-section of circulation (Fig. 11c) shows two as-cending branches over the Afro-Eurasian continent: one over the eastern plateau and another over East Asia, in good corre-spondence with the rainfall regions. Of note, a moderate air-descending region occurs below 300 hPa in the troposphere, between the two ascending branches. This feature is simi-lar to that observed along the subtropics over North America and South America (see Figs. 3, 8b, and 8c).
In contrast, experiment MT90 (Fig. 11d–f) produces only one anticyclonic circulation at 200 hPa (Fig. 11d) and one cyclonic circulation at 850 hPa (Fig. 11e), with relatively intense meridional winds and rainfall over the eastern part of the continent. In the vertical cross-section of circulation (Fig. 11f), there exists only one ascending region, spanning from the eastern plateau to Western Pacific, in good corre-spondence with the rainfall distribution over East Asia (see Fig. 11d and e) and in good agreement with the observed distribution of vertical motion in the area (Figs. 3 and 8a).
[image:10.595.84.505.89.200.2]Fig. 10. Distributions of the 10-year July mean rainfall (color
shad-ing, unit is mm d−1)and wind at 925 hPa (arrows, m s−1)in the experiments NOMT (a), MT60 (b), and MT90 (c). The differences between MT90 and NOMT are shown in (d). The red lines in (a–c) mark the area where the change in wind direction between July and January exceeds 120◦. The thick dashed line denotes the idealized coastline, and the thick ellipse in (b–d) indicates land above 750 m.
areas are somewhat atypical, although greater summer rain-fall does occur over the eastern continent and a drier area occurs over the western continent.
7 Summary and discussion
The climate system is an open dissipative system that is sub-jected to various kinds of forcing. It behaves differently in re-sponse to different types of external forcing, and the rere-sponse is complicated by feedback between external forcing and cli-mate. In this study, we investigated three kinds of forcing (i.e., large-scale continental forcing, sea-breeze local forcing along coastal regions, and regional-scale plateau forcing) and demonstrated their contributions to the formation of mon-soon and desert in the summertime subtropics from various perspectives. First, continental-scale heating over land and cooling over ocean produce near-surface cyclonic circulation over continent and anticyclonic circulation over ocean, and reversed circulations in the upper troposphere. Subject to the vorticity balance and continuity constrains, air ascends over the eastern continent and western ocean, and descends over the eastern ocean and western continent. Second, the sea breeze along coastal regions enhances the rising of air over the eastern continent to the west of the coast, and suppresses the rising over the western ocean to its east. The sea breeze also enhances the descent of air over the eastern ocean to the west of the western coast, and weakens the descent over the western continent to its east. Thus, as a consequence of the land-sea distribution, the dominant diabatic heating be-comes well organized across each subtropical continent and its adjacent oceans in summer, and appears as a LOSECOD quadruplet-heating pattern.
Meridional transfer of heat and planetary vorticity give rise to positive feedback between vorticity generation and diabatic heating (longwave radiative cooling on the eastern parts of oceans, surface sensible heating on the western parts of continents, and condensation heating on the eastern parts of continents and western parts of oceans); the feedback con-tinues until it is balanced by frictional dissipation. A warm, moist poleward flow develops in the lower troposphere over the eastern continent, resulting in abundant rainfall and a monsoon-like climate. On the western side of the continent, a cold, dry equatorward flow develops near the surface, soil moisture decreases, and an arid or even desert climate is de-veloped. It should be noted that the divergent wind along the coastal line associated with sea-breeze forcing (as shown in Fig. 4b) is not independent of the rotational wind produced by continental forcing (Figs. 6 and 7); instead, they are re-lated by formula (3), and both are formed in response to the contrasting heat capacities of land and ocean.
[image:11.595.51.288.54.568.2]Fig. 11. Distributions of the 10-year July mean rainfall (a, b, d, and e; shading, unit is mm d−1), meridional wind (solid contours (positive values) denote southerly wind, and dotted contours (negative values) denote northerly wind; interval is 2 m s−1)at 200 hPa (a and d) and 850 hPa (b and e), and corresponding vertical cross-sections of circulation along 32.5◦N (c and f; black area represents the plateau) in the experiments MT60 (a–c) and MT90 (d–e). Thick dashed lines represent the idealized coastline, and ellipses indicate land with an elevation of 1500 m.
[image:12.595.130.469.458.672.2]and a weak surface anticyclone appears downstream. These findings were used to explain the formation of the summer-time subtropical anticyclone over the ocean surface. How-ever, the intensity of the downstream anticyclone is too weak to explain the summertime surface anticyclone. More impor-tantly, the near-surface zonal flow is weak in the summertime subtropics, and the dynamics developed by Chen et al. (2001) show a better fit to middle and high latitudes, where wester-lies are dominant, rather than the subtropics.
Rodwell and Hoskins (2001) recognized the “ ‘duality’ be-tween the monsoon condensation heating and the low-level subtropical circulation in the sense that either one would be very different without the other.” The authors speculated that desert is formed as a remote Rossby-wave response to the west of subtropical summertime monsoon heating, with in-teraction with mid-latitude westerlies, resulting in a region of adiabatic descent. However, the strongest descent in re-sponse to forcing is close to the western part of the forc-ing (Fig. 8; see also Gill, 1980); in contrast, the observed deserts on the western parts of continents are located far from the monsoon region on the eastern continent. In fact, based on their standard model integration and trajectory anal-ysis (Fig. 9 in Rodwell and Hoskins, 1996), all the trajecto-ries along the subtropical westerly descend strongly over the Mediterranean Sea, and most of the trajectories that origi-nated from the Asian monsoon region and along the tropi-cal easterlies begin to ascend before reaching the Southern Hemisphere. There occurs limited interaction between the westward and eastward trajectories because the former travel above 300 hPa, whereas the latter travel below 400 hPa, de-spite their similar original heights. In fact, Figs. 6a and 8a show that the strong descent centers located over the Mediterranean and mid-Asia occur below the upper tropo-sphere westerlies, in agreement with the trajectory analysis of Rodwell and Hoskins mentioned above. Figures 3, 8a, and 12 show that the strong descent and deserts over North Africa-Mediterranean and mid-Asia are closely related to the continental-scale forcing and the forcing of the Iran Plateau and the TP.
In terms of the third type of forcing, the uplifted heating of regional-scale plateau forcing in summer generates a pro-nounced Rossby-wave-type circulation with poleward flow and atmospheric ascent to the east, and equatorward flow and descent to the west of the plateau. The TP is located within the eastern Eurasian continent. Atmospheric circulation pro-duced by the TP is in phase with that of continental-scale and sea-breeze forcing. The strongest monsoon and deserts are therefore formed over the African and Eurasian continents. In contrast, the Rockies and Andes are located over the west-ern parts of continents; although the descending motion over the oceanic regions to the west of North and South America are strongly intensified, the ascending regions over the conti-nents due to orographic forcing are separated from those due to continental forcing. The desert and monsoon climates over these continents are not as strong as those over the Eurasian
Continent.
In summary, the observed summertime subtropical climate pattern, with abundant rainfall or monsoon on the east of the continent and aridity or desert on the west, is formed in response to the combined effects of continental-scale forc-ing, local-scale coastal sea-breeze forcforc-ing, and regional-scale mountain forcing, as well as the positive feedback between diabatic heating and heating-induced vorticity generation in the lower troposphere, which occurs via the meridional trans-fer of heat and planetary vorticity. Therefore, monsoons and deserts in the summertime subtropics coexist as twin features of the climate system produced by multi-scale circulations in association with various types of external forcing.
Acknowledgements. We thank three anonymous reviewers for their constructive suggestions. This study was jointly supported by CAS program KZCX2-YW-Q11-01, MOST program 2006CB403600 and NSFC Projects 40875034, 40821092, and 40810059005.
Topical Editor F. D’Andrea thanks three anonymous referees for their help in evaluating this paper.
References
Bounoua, L. and Krishnamurti, T. N.: Thermal dynamic budget of the five day wave over the Sahara Desert during summer, Meteor. Atmos. Phys., 47, 1–25, 1991.
Charney, J. G.: Dynamics of desert and drought in the Sahel, Q. J .Roy. Meteorol. Soc., 101, 193–202, 1975.
Chen, P., Hoerling, M. P., and Dole, R. M.: The origin of the sub-tropical anticyclones, J. Atmos. Sci., 58, 1827–1835, 2001. Duan, A. M. and Wu, G. X.: Role of the Tibetan Plateau thermal
forcing in the summer climate patterns over subtropical Asia, Clim. Dynam., 24, 793–807, 2005.
Eady, E. T.: The cause of general circulation of atmosphere, Roy. Meteor. Soc. Cent. Proc., 156–172, 1950.
Gill, A. E.: Some simple solutions for heat-induced tropical circu-lation, Q. J. Roy. Meteorol. Soc., 106, 447–662, 1980.
Hoskins, B. J.: Diagnosis of forced and free variability in the at-mosphere, pp. 57–63, in: Atmospheric and Oceanic Variability, edited by: Cattle, H., Royal Meteorological Society, Bracknell, 1986.
Hoskins, B. J.: Towards a PV-θ view of the general circulation, Tellus, 43AB, 27–35, 1991.
IPCC: Chap. 8, Climate Change: The Scientific Basis, Contribution of Working Group I to the Third Assessment Report of the Inter-governmental Panel on Climate Change, edited by: Houghton, J. T., Ding, Y. H., Griggs, D. G., et al., Cambridge University Press, Cambridge and New York, 881 pp, 2001.
Kalnay, E., Kanamitsu, M., Kistler, R., et al.: The NCEP/NCAR 40-year reanalysis project, B. Am. Meteorol. Soc., 77, 437–471, 1996.
Kang, In-Sik, Jin, K., Lau, K. M., et al.: Intercomparison of atmo-spheric GCM simulated anomalies associated with the 1997/98, J. Climate, 15, 2791–2805, 2002.
the Eastern Hemisphere, Clim. Dynam., 17, 327–338, 2001. Newman, M., Sardeshmukh, P. D., and Bergman, J. W.: An
as-sessment of the NCEP, NASA, and ECMWF reanalyses over the tropical west Pacific Warm Pool, B. Am. Meteorol. Soc., 81, 41– 48, 2000.
Nigam, S., Chung, C., and Deweaver, E.: ENSO Diabatic Heating in ECMWF and NCEP–NCAR Reanalyses, and NCAR CCM3 Simulation, J. Climate, 13, 3152–3171, 2000.
Rodwell, M. R. and Hoskins, B. J.: Monsoon and the dynamics of deserts, Q. J .Roy. Meteorol. Soc., 122, 1385–1404, 1996. Rodwell, M. R. and Hoskins, B. J.: Subtropical anticyclones and
monsoons, J. Climate, 14, 3192–3211, 2001.
Tao, S. Y. and Chen, L.: A review of recent research on the East Asian summer monsoon in China, Monsoon Meteorology, edited by: Chang, C. P. and Krishnamurti, T. N., Oxford University Press, 60–92, 1987.
Wang, B.: The Asian monsoon, Praxis Publishing, Chichester, UK, Springer, pp. 787, 2006.
Webster, P. J., Maga˜na, V. O., Palmer, T. N., Shukla, J., Tomas, R. A., Yanai, M., and Yasunari, T.: Monsoons: processes, pre-dictability, and the prospects for prediction, J. Geophys. Res., 103, 14451–14510, 1998.
Wu, G. X. and Liu, Y. M.: Thermal adaptation, overshooting, dis-persion and subtropical anticyclone, I. Thermal adaptation and overshooting, Chin. J. Atmos., 24, 433–446, 2000.
Wu, G. X. and Liu, Y. M.: Summertime quadruplet heating pat-tern in the subtropics and the associated atmospheric circulation, Geophys. Res. Lett., 30, 1201, doi:10.1029/2002GL016209, 2003.
Xie, P. and Arkin, P. A.: Analyses of global monthly precipita-tion using gauge observaprecipita-tions, satellite estimates, and numerical model predictions, J. Climate, 9, 840–858, 1996.
Xue, Y. K., Sellers, P. J., Kinter, J. L., and Shukla, J.: A simplified biosphere model for global climate studies, J. Climate, 4, 345– 364, 1991.
Yamazaki, N., Kamahori, H., Yatagai, A., and Takahashi, K.: Cur-rent status of GAME reanalysis project and some preliminary results – Heavy precipitation on July 22, 1998 and diurnal varia-tions of precipitable water, Proc. Int. GAME/HUBEX Workshop, Sapporo, Japan, GAME project, 24–29, 2000a.
Yamazaki, N. H., Kamahori, H., Yatagai, A., et al.: Release of GAME reanalysis data, Tenki, 47, 659–664, 2000b (in Japanese). Yanai, M. and Li, C.: Mechanism of heating and the boundary layer over the Tibetan Plateau, Mon. Weather Rev., 122, 305– 323, 1994.
Yanai, M. and Wu, G.-X.: Effects of the Tibetan Plateau, in: The Asian Monsoon, edited by: Bin Wang, Springer, 513–549, 2006. Yang, S., Webster, P. J., and Dong, M.: Longitudinal heating gra-dient: another possible factor influencing the intensity of the Asian summer monsoon circulation, Adv. Atmos. Sci., 9, 397– 410, 1992.