Relationship between government behaviours and economy growth Authors: Huan Liu and Yan Wu
Date: Jan, 2007
Supervisor: Tommy Waller
C-level essay in Statistics, 2006
Abstract
In macroscopic economic environment the government behaviors play a
pivotal role. This article selects 51 major countries in the world and uses
“Least Squares Method” to research the relationship between government
behaviors and economy growth. Moreover, it will compare the results of the
analysis for the government of China to develop policies and systems to
provide theoretical basis.The significance degree of influencing between
government behaviors and economy growth of nations which are in different
Introduction
Nowadays, the international competition turns more serious
increasingly. More and more nations adopt market economy system.These
countries fully awared of the government's role in economic growth.
It explored the effect that the different acts of government take on
economic growth and sought the law of the acts of government and the
economic growth through constructing and analysising a modificated
Cobb-Douglas function .And then It will also provide a theoretical basis
and practical basis for the Chinese government formulating system and
decision.
First step: Model and Variable Selection
Most economists who are researching macroeconomic take the
Cobb-Douglas function as the model to study. Its basic form is:
Y=AK Lα βeu
K is the capital stock ,L is the number of labor .A represents the impact that
technology and other factors have on economic growth. The function used in
this paper is a modification in the form of Cobb-Douglas function :
1 1 2 2 3 3 4 4 5 5
log( )Y = +c klog(KL)+β log(X )+β log(X )+β log(X )+β log(X )+β log(X )+μ
The meaning of KL in this function is different from that in the
Cobb-Douglas function. In order to research the impact that the
government's action on GDP per capita, this paper turn the capital and labor
to working capital stock conversion
Second step: Analysis
This section will be separated into three parts to analyse the economic
growth which was influenced by government behaviour by doing regression
and the government's Indicators of the 51 major countries in the world , do
a regression analysis using weighted least squares. In the same way, Part II
and III ,selecting GDP per capita and some government's Indicators from 20
countries with lower GDP per capita and 21 countries with higher GDP per
capita separately. We do the same regression analysis using weighted least
squares and then conduct a comparative analysis of the developed and
developing countries to seek the economic growth which was influenced by
the different government behavior.
1 Data
Y : GDP per capita as an dependent variable. (Unit : USD)
KL :The Average working capital stock.Take the Average working capital
stock as a reference variable to explain the GDP per capita . (Unit : USD)
X1: Extent of distortion government subsidies:Government subsidies to
business in your country (1=keep uncompetitive industries alive
artificially,7=improve productivity of industries)
X2: Government intervention in investment: The effect of government
intervention on corporate investment is (1=distorting,7=free from
government intervention)
X3: Government success in ICT promotion:Government programs
promoting the use of information and communication technologies (ICT) are
(1=not very successful,7=highly successful )
X4: Business costs of corruption: Offer other firm's illegal payments to
influence government policies , law ,or regulations impose costs or
otherwise negatively affect your firm?(1=impose large costs,7=impose no
X5: Government expenditure (government expenditure as a percentage of
GDP) (unit :%)
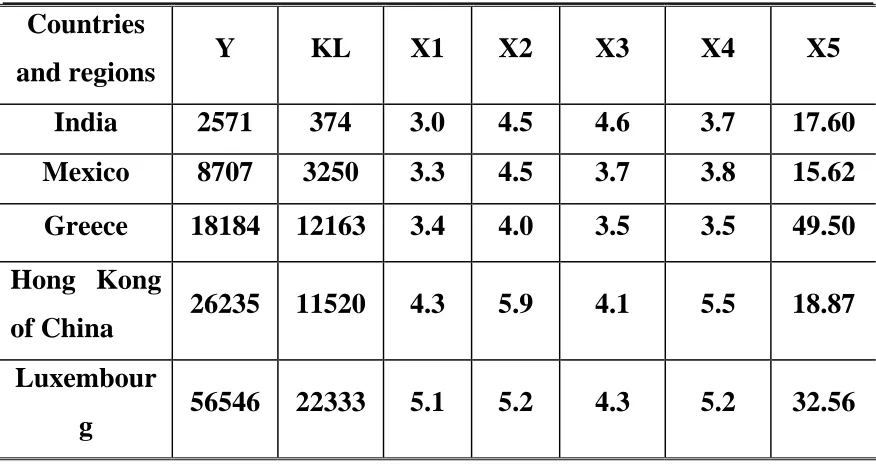
This paper took the 51 major countries in the world as studying targets .
Table 1: the major national indicators data (Here gives Minimum value, 1st
Quartile, Median 3rd Quartile and maximum value (over the 51 countries) for
the variable Y. The data of 51 countries are shown in the Appendix.
Countries
and regions Y KL X1 X2 X3 X4 X5
India 2571 374 3.0 4.5 4.6 3.7 17.60
Mexico 8707 3250 3.3 4.5 3.7 3.8 15.62 Greece 18184 12163 3.4 4.0 3.5 3.5 49.50 Hong Kong
of China 26235 11520 4.3 5.9 4.1 5.5 18.87 Luxembour
g 56546 22333 5.1 5.2 4.3 5.2 32.56
Data sources:
“World Economic Forum Global Competitiveness Report 2002-2003” [1],
“The Global Competitiveness Report 2003-2004” [2]
2 Analysis
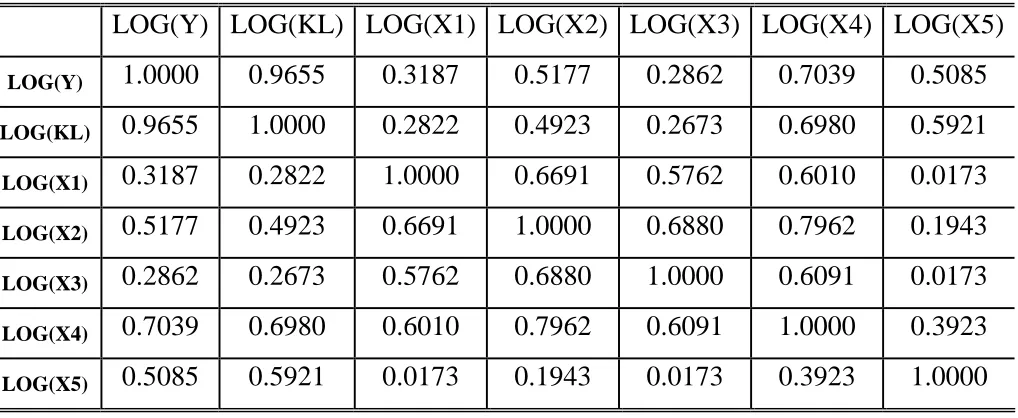
2.1 A regression analysis of 51 major countries 2.1 .1 the correlation coefficient matrix
We got the correlation coefficient between the variables through dealing
Table 2: The correlation coefficients of the variables
LOG(Y) LOG(KL) LOG(X1) LOG(X2) LOG(X3) LOG(X4) LOG(X5)
LOG(Y) 1.0000 0.9655 0.3187 0.5177 0.2862 0.7039 0.5085
LOG(KL) 0.9655 1.0000 0.2822 0.4923 0.2673 0.6980 0.5921
LOG(X1) 0.3187 0.2822 1.0000 0.6691 0.5762 0.6010 0.0173
LOG(X2) 0.5177 0.4923 0.6691 1.0000 0.6880 0.7962 0.1943
LOG(X3) 0.2862 0.2673 0.5762 0.6880 1.0000 0.6091 0.0173
LOG(X4) 0.7039 0.6980 0.6010 0.7962 0.6091 1.0000 0.3923
LOG(X5) 0.5085 0.5921 0.0173 0.1943 0.0173 0.3923 1.0000
2.1.2 Data process
Regressing the Data the three-part:
Model1
1 2 3 4
49.058 83.922 3.020 0.120 1.649 0.973 8.210
log( ) 4.399 0.645 log( ) 0.132 log( ) 0.009 log( ) 0.071log( ) 0.055 log( ) 0.16 log( )
t
Y KL X X X X
= − −
= + + + − + − X5
5
5
X
Model2
1 2 3 4
22.229 18.204 2.522 1.951 1.495 2.736 1.209
log( ) 8.980 0.605 log( ) 0.558log( ) 0.636 log( ) 0.368 log( ) 0.850 log( ) 0.143log( ) t
Y KL X X X X X
= − − −
= + + + − − −
Model3
1 2 3 4
47.025 6.142 1.592 2.242 3.471 1.733 3.086
log( ) 9.672 0.314 log( ) 0.172 log( ) 0.507 log( ) 0.257 log( ) 0.282 log( ) 0.151log( )
t
Y KL X X X X
= − −
= + + − + + −
Annotation 1:model 1 is a regression analysis for 51 countries;
Annotation 2:model 2 is a regression analysis for 20 developing countries
with lower GDP per captia;
with higher GDP per captia;
Annotation4:the numbers in parenthesis are t-values
Annotation5: when α =0.05 , the t values are
0.025
t (51 1)− =2.009 t0.025(20 1)− =2.093 t0.025(21 1)− =2.086
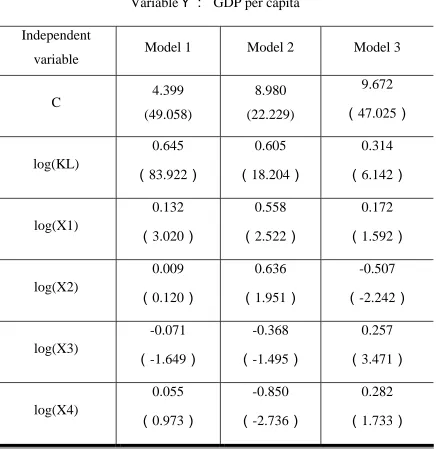
The result is shown on table 3:
Table 3 : the result of regression analysis
VariableY: GDP per capita
Independent
variable Model 1 Model 2 Model 3
C 4.399
(49.058)
8.980
(22.229)
9.672
(47.025)
log(KL)
0.645
(83.922)
0.605
(18.204)
0.314
(6.142)
log(X1)
0.132
(3.020)
0.558
(2.522)
0.172
(1.592)
log(X2)
0.009
(0.120)
0.636
(1.951)
-0.507
(-2.242)
log(X3)
-0.071
(-1.649)
-0.368
(-1.495)
0.257
(3.471)
log(X4)
0.055
(0.973)
-0.850
(-2.736)
0.282
log(X5)
-0.160
(-8.210)
-0.143
(-1.209)
-0.151
(-3.086)
2
R 0.999 0.999 0.999
F 4200.687 308974.5 61.659
D.W 2.277 2.235 1.802
Sample 51 20 21
2.2 An Empirical Analysis
2.2.1 Analysis of economic significance
1)We can see from the regression results of the 51 countries: On world
economic growth, when other factors remaining unchanged, the captial of
labor stock per capita increasing 1% causes GDP per capita of the world
increasing 0.645% . Other factors remaining unchanged, the Extent of
distortion government subsidies increasing 1% causes GDP per capita of the
world increasing 0.132%. Government expenditure increasing 1% causes
GDP per capita of the world reduce 0.160%. Capital investment causes
larger changes in GDP per capita. The world economy is the main factor for
Capital stimulating economic growth. Government acts played a smaller role
in influencing the course of economic growth and a supporting role in
economic growth.
2) We can see from the results of the regression of 20 developing countries
with lower GDP per capita: In the circumstances where the governments
interact. The independent variables which impact on the economic growth of
developing countries significantly: the capital of labor stock per capita
0.605%; The Extent of distortion government subsidies, the indicator of
Extent of distortion government subsidies increasing 1% causes GDP per
capita of developing countries increasing 0.558%; Business costs of
corruption, the indicator of Business costs of government corruption
increasing 1% causes GDP per capita in developing countries reducing
0.850%. Capital caused GDP per capita grew by almost two-thirds.
Developing countries are mainly type of capital stimulating economic
growth.
3) We also can see from the results of the regression of 20 developing
countries with lower GDP per capita: In the circumstances where the
governments interact, the independent variables which impact on the
economic growth of developing countries significantly: The capital of labor
stock per capita increasing 1% causes GDP per capita in developed countries
increasing 0.314%.This number is far less than the indicator of developing
countries. The indicator of the government intervention in economic
increasing 1% causes GDP per capita in developed countries reducing
0.507%. The indicator of the Government success in ICT promotion
increasing 1% causes GDP per capita in developed countries increasing
0.257%. The indicator of the Government expenditure increasing 1% causes
GDP per capita in developed countries reducing 0.151%.
2.2.2 Comparative analysis
From the Table of regression analysis, we can see that the significant degree
of the countries at different stages of development affected by different
government behaviors is different.
1) Government subsidies in industrial areas take different effects on
developing countries, the effect that the government subsidies in industrial
took on economic growth is significant. In developing countries , giving
subsidy to the enterprises which can improve the competitiveness of
industrial can improve its industrial competitiveness and promote industrial
development and economic growth; The industrial technologies which are at
a mature stage are more advanced in developed countries and have
stronger competitive power in international market. The government
reducing its support will promote the industry growth healthily.
2) Government intervention in economic takes different effect on economic
growth of countries which are at different stages of development. The
economics in developing countries is relatively backward. Market economy
is not sound. Government intervention to the enterprises is strong in the
investment field .But the significant degree is weak to economic growth.
Government intervention in business investment in developed countries can
prevent monopoly enterprises and enhance the competitiveness of the
market .It play a role in promoting economic growth.[3]
3) Government success in ICT promotion takes different effects on
economic growth of countries at different stages of development.
In developing countries, the development in the field of information
and communication technology developments is late. It is also in a state of
backwardness and the technology is ackwarder than developed countries.
These countries tend to adopt Renovation of imports with very few
innovations.The development of information and communication
infrastructure is relatively sound in developed countries. And they have a
strong technical support. So it has formed a relatively complete information
and communication market. This market impacts on economic growth
4) Corruption of the government takes different effects on economic growth
of countries which are at different stages of development.
Market economy is still not perfect in developing countries, or a sound
legal system of supervision. Corruption happens frequently and its impact on
economic growth is also relatively significant. In developing countries,
government corruption causes the cost of some enterprises rising and some
have also received additional revenue. So it causes the phenomenon that
government corruption promotes economic growth in the short term. The
market economy in developed countries is relatively sound .Economy and
legal system is relatively sound. Government corruption will cause
miscarriages and the negative impact on the economy.[5]
5) The number of government expenditure takes different effects on
economic growth of countries at different stages of development. The impact
on economic growth by government expenditure in developing countries is
not significant. In infrastructure, education and national defense the
government expenditure promotes the economic growth. In developing
countries it is not a major contributing factor. Analyzing the data of
developed countries, there is a significant negative correlation between the
government expenditures and economic growth. Market economy in
developed countries is relatively healthy. But Excessive government
expenditures, providing extensive public goods, causes the market fail to
play a destabilizing role in the market economy and hinder economic
growth.
3. The inspiration of Chinese government in promoting economic growth
undergone a fundamental change. The government functions have a
significant transformation. It will be inconceivable without the government's
own reform.
To enable the government to perform new functions better, we should
raise the government's rationality. Government's rationality refers to the
government which is based on accurately judge the conditions can weigh the
advantages or disadvantages and determine the priorities of development of
social economic, formulate scientific and rational policy measures and to
ensure its implementation.
Concerning to the government, this paper makes the following
suggestion.
1) Change government subsidies to improve industrial competitiveness.
China has been a member of WTO, the pace of industrialization has
embarked on a normal track. Chinese industry must to improve
competitiveness to participate in international competition. The government
should reduce the support for not competitive enterprises and transfer funds
to be able to truly improve the competitive edge of China's industrial
enterprises, such as information and telecommunication companies and
research companies.
2) Reduce government intervention to enterprises in the economic sphere.
Excessive government intervention in the economic field will distribute the
market to get effectiveness of the allocation of resources and lead the market
uncontrolled. However, the government also has to control the area of
lifeline of the national economy, such as energy, information and
communication, transportation, national defense, and so on. These factors
are having a crucial impact on economic growth of China.
communication .Then use information technology to promote
industrialization and promote the optimization and upgrading of the internal
of industries. Information and communication revolution has brought an
upsurge of economic growth to Latin American countries. China is also in a
critical stage from industrialization to information technology. "Information
technology brings along industrialization, industrialization promotes
information technology" a new road to industrialization. It is the main form
of the next stage of economic development in China.
4) Strengthen the governance of government corruption .Strengthen and
improve the supervision of the government. The biggest feature of the
governments is its compelling force. If they lose the restrictions and
oversight, the result is bound to be corrupt and inefficient. If we want to
Strengthen the supervision of the government, we need to strengthen the
government's openness and transparency and enhance the degree of
openness of administration according to law so that the government's
direct supervisor and various social organizations and individuals can obtain
adequate information to improve the effectiveness of supervision.
Conducting an effective constraint on the government is according to
the executive actually.
5) Select appropriate government expenditures. Rapid economic growth
of China in recent years is, to some extent ,attributed to the Chinese
government's large-scale expenditures. In the short run, the Chinese
government expenditures played a significant role in promoting economic
growth. However, in the long run, increasing the scale of government
expenditures will, lower capital and the output efficiency. Therefore, it
would be appropriate to reduce the size of government expenditures and
Government expenditure should be mainly used to improve the efficiency of
capital and labor.
During the process of impacting on the economic growth, the role of
government is not omnipotent, nor is the market. In a developing country
such as China, facing to the complex, economic development can not be
“across the board” or for radical economic reform. [6]Economic reform and
development should be gradual. Practice has proved that Chinese
government intervention before reform is effective. The achievements of
founding market economy which was raised during reform and opening up is
outstanding. The government and the market should play a role together in
Chinese economic development process. They can complement each other
and support each other. Each of them can play a role in different areas. Thus,
the whole country can achieve efficient and orderly of economic
development.
References
[1]Peter K.Cornelius [German] Michael E. Porter[America] Klaus Schwab[Switzerland], translated by Liying Fang & Zhixian Luo, 2003, World Economic Forum Global Competitiveness Report 2002-2003, Machinery Industry Press
[2]Michael E. Porter , Klaus Schwab , Xavier Sala-i-Martin , 2004, The Global
Competitiveness Report 2003-2004,The World Economic Forum , Oxford University Press
[3]Xiao Huang, Xiongyi Bin,2006, The role of government and its relationship with the
market research,Public technology, Science Press
[4]Jianchu Shang, Fangzhi Fan, Gengqing Zhang,2005,Technical innovation, economic growth and government intervention,
[5]Tianyun Zhou, 2001,Corruption of public investment and economic growth,Economic reform ,
http://www.nova.cn/Browse/ShowDoc.aspx?Code=3-1&Id=2005062709342978855
[6]Shixian Huang ,2005,On the negative external effects of government intervention in
economic analysis,Look & Search,People of China press
Appendix: Target data of the 51 main countries we study: Countries
and regions Y KL X1 X2 X3 X4 X5
India 2571 374 3.0 4.5 4.6 3.7 17.60
Indonesia 3138 595 3.8 3.5 3.5 3.8 20.60
Philippines 4021 506 2.8 3.7 3.6 2.9 19.39
Jordan 4106 2000 3.9 4.8 4.9 4.8 32.60
China 4475 823 3.8 4.5 4.3 3.9 19.30
Venezuela 5226 1883 2.5 1.9 2.2 2.4 24.70
Colombia 6068 921 3.4 3.7 3.7 3.0 20.30
Turkey 6176 2112 2.7 3.5 2.9 3.5 44.31
Romania 6326 1734 2.0 3.1 3.8 2.5 15.94
Thailand 6788 1208 4.4 5.2 4.6 4.0 17.82
Brazil 7516 1585 4.0 4.4 4.0 4.0 35.40
Soviet 7926 1579 2.9 3.6 2.9 3.5 14.66
Malaysia 8922 2487 4.0 4.1 5.3 4.6 30.70
Chile 9561 3434 4.3 4.7 3.9 4.1 22.40
South Africa 10132 2930 4.1 4.5 4.0 4.7 26.35
Poland 10187 2828 2.7 4.0 3.1 3.6 33.50
Argentina 10594 212 2.9 2.8 2.4 3.0 22.21
Estonia 11712 5167 4.3 5.0 4.8 5.0 36.21
Slovakia 12426 4700 3.3 4.2 3.2 3.4 40.60
Hungary 13129 5949 4.2 4.3 3.6 3.9 40.68
Czech 15148 6327 2.8 4.6 3.3 3.6 43.99
Korea 16465 8892 4.0 4.3 5.3 4.3 23.80
Slovenia 17748 9222 3.8 4.6 3.7 4.2 44.70
Portugal 17808 6634 3.3 4.2 3.8 4.8 41.00
Greece 18184 12163 3.4 4.0 3.5 3.5 49.50
Israel 19382 8292 4.3 4.2 4.4 4.9 46.70
New Zealand 20455 9950 3.7 5.1 3.6 6.6 35.80
Spain 20697 15368 3.6 4.8 3.8 4.4 38.50
Singapore 23393 9420 5.5 5.3 5.9 6.1 18.15
Taiwan of
China 23420 6272 4.0 4.7 5.2 4.4 25.00
Sweden 25315 11319 4.0 5.3 4.4 6.4 53.42
Italy 25570 14580 3.7 4.4 3.7 3.9 45.30
Japan 25650 17613 2.6 4.5 4.1 4.4 46.9
Britain 25672 10364 4.1 5.2 3.8 5.6 38.7
Finland 25859 14641 5.0 6.3 5.2 6.6 45.17
France 26151 16011 3.1 4.5 4.3 4.9 50.60
China
Germany 26324 12232 2.3 3.7 4.0 5.3 46.30
Belgium 26695 15755 3.4 4.7 3.6 5.4 46.56
Netherlands 27275 14817 4.4 5.4 3.7 5.8 27.03
Australia 27756 15413 4.3 5.4 3.9 5.8 25.20
Switzerland 28359 17995 2.9 5.2 4.2 5.6 38.70
Austria 28611 18410 3.7 4.5 3.9 5.4 47.20
Canada 28699 12389 3.4 4.5 4.6 5.1 37.70
Iceland 29614 16875 4.1 5.6 4.8 6.6 31.60
Denmark 29975 18162 4.4 5.7 4.8 6.7 51.30
Ireland 32960 24783 3.8 4.0 4.4 5.1 30.30
United States 35158 16220 3.8 5.4 4.6 5.1 18.37
Norway 36047 20044 3.3 4.4 3.9 5.5 41.30