http://www.sciencepublishinggroup.com/j/ijgg doi: 10.11648/j.ijgg.20190704.11
ISSN: 2376-7340 (Print); ISSN: 2376-7359 (Online)
Prediction of Structural and Functional Effects of Single
Nucleotide Polymorphisms in
NAT2
gene, a Computational
Analysis
Amna Elsadig Elsafi Abodlaa
1, 2, 3, Dalia Mursi
4, Mona Abdelrahman Mohamed Khaier
1, *,
Mai Abdul RahmanMasri
5, Nazik Elmalaika Obaid Seid Ahmed Husain
6, Hind Abdelaziz Elnasri
11Department of Molecular Biology and Bioinformatics, University of Bahri, Khartoum, Sudan 2Haematology Department, Research and Laboratory Unit, Khartoum Teaching Hospital, Sudan 3
College of Medical Laboratory, Sudan University of Science and Technology, Sudan
4Central Laboratory, Ministry of Higher Education and Scientific Research, Sudan 5Department of Zoology, Molecular Biology, University of Khartoum, Khartoum, Sudan 6
Department of Pathology, Omdurman Islamic University, Omdurman, Sudan
Email address:
*
Corresponding author
To cite this article:
Amna Elsadig Elsafi Abodlaa, Dalia Mursi, Mona Abdelrahman Mohamed Khaier, Mai Abdul RahmanMasri, Nazik Elmalaika Obaid Seid Ahmed Husain, Hind Abdelaziz Elnasri. Prediction of Structural and Functional Effects of Single Nucleotide Polymorphisms in NAT2gene, a Computational Analysis. International Journal of Genetics and Genomics. Vol. 7, No. 4, 2019, pp. 88-97. doi: 10.11648/j.ijgg.20190704.11 Received: August 3, 2019; Accepted: October 4, 2019; Published: October 15, 2019
Abstract:
N-acetyltransferase 2 (encoded by NAT2) is a phase II enzyme that detoxifies and metabolizes xenobiotics and drugs components. It is a critical enzyme in clinical pharmacology. It has remarkable genetic polymorphisms, which is associated with the risk of developing cancer due to the change of normally fast acetylation of substrates to slow acetylation. This study assessed single nucleotide polymorphisms (SNPs) in the coding region and (3ʹUTR) of NAT2. Computational approaches were used in this study for functional and structural effects of NAT2 gene. SNPs. Were retrieved from NCBI SNPsdatabase. TheNAT2 protein sequence and amino acid change were used as an input to the SIFT, PolyPhen-2, PhD-SNP, SNPs& GO, SNP Analyzer, I-Mutant 3.0 and PMut to determine the deleterious and SNPs conditions. Other software for predication of the structural change were Mutation3D, Chimera and Project HOPE. GeneMANIA software was used to show gene –gene interaction. PolymiRTs was used to investigate the disruption or creation of SNPs of miRNA region. InHomosapiens182 were nonsynonymous SNPs (nsSNPs), 60 synonymous SNPs, 48 3ʹUTRSNPs and 19 5ʹUTR SNPs. A total,
65 of those nsSNPs were predicted to be highly damaging with 3-6 score rates when analyzed with six software. Re-computation of results with I-Mutant 3.0 showed adecrease in the effective stability of the protein due to 55 nsSNPs. Consequent structural changes were shown using Project HOPE and Chimera. NAT2 is a highly polymorphic gene; the majority of deleterious NAT2SNPs are nsSNPs that alter the physiochemical and structural properties of the protein, possibly leading to the loss or distortion of the protein's ability to detoxify and metabolize xenobiotic and aromatic amine compounds. There were three SNPs at the 3ʹUTR that changed the miRNA binding sites, which might affect the gene regulation.
Keywords:
NAT2gene, Computational Analysis, nsSNPs, 3ʹUTR1. Introduction
Single nucleotide polymorphisms (SNPs) are the genetic basis of many complex human diseases [1]. Nonsynonymous coding SNPs (nsSNPs) were responsible for the variety of
alterations in protein structure is often watched at either core or interface residues refereeing protein communications [3]. Protein structure may be destabilized by mutations in amino acids found in the core of the protein, while mutations at interface amino acids can affect protein communication. These nsSNPs mutations at the protein–protein interaction locations are responsible for human disorders [2].
Another important source of variation that can affect protein function is SNPs in miRNAs or microRNA binding sites. miRNAs are small noncoding RNAs that are about 20– 25 nucleotides in length. They are responsible for the regulation of gene expression in multiple target genes via sequence-specific hybridization to the 3´ untranslated region (3´UTR) of mRNAs and then stop translation or direct degradation of their target.
mRNA [4].
Living organisms are always exposed to various substances that may have a carcinogenic and toxic effect [5]. Cancer is among the leading causes of death worldwide [6]. In 2012, about 14.1 million cancer cases were reported and the number is expected to increase to 24 million by the year 2035[7]. Various factors have been found to induce cancer development, including endogenous (genetic) and/or exogenous causes, such as the environment, habits and lifestyle [6]. It has been approximated that about one-third of cancers are attributable to nutrition and lifestyle [7]. Developing databases and recent knowledge about the distribution of highly polymorphic genetic polymorphisms in different populations can aid understanding the variable effects of those mutations and their relation to carcinogenesis and cancer distribution [8, 9]. Among these genes is genes including NAT2. Two highly polymorphic isoenzymes of human N-acetyltransferase enzymes, NAT1 (MIM#108345) and NAT2 (MIM# 243400) are known. Both genes are located on chromosome 8 and they have different functional roles. NAT2 is involved in phase II pathway of removal of toxic substances from the human body and metabolism of xenobiotics and arylamine by N- or O-acetylation [10]. The enzyme arylamine N-acetyltransferase type 2 (NAT2), encoded by the NAT2 gene, is a critical enzyme in clinical pharmacology [8]. NAT2, also recognized as AAC2; PNAT (NG -012246), is mainly expressed in the liver, but is also expressed in almost all mammalian tissues. The gene is polymorphic, with numerous nucleotide substitutions observed [8, 11]. It is located in chromosome 8, with an open reading frame of 870 bp and consists of 290 amino acids, with variable tissue expression levels and distribution [12, 13]. The occurrence of the acetylator phenotype activity is divided into fast, intermediate, and slow phenotypes and was found to differ through the different ethnic groups [8, 10, 14, 15]. Thus, low or no NAT2 –enzyme activity have been implicated as a leading cause of increased susceptibility to drug toxicity and many kinds of cancer [16, 17]. About 65 allele variants of NAT2 have been reported among human populations [13]. These variants have between one to four nucleotide substitutions; the most frequent alleles are the slow acetylator phenotype associated alleles (rs1801280,
rs1799930, rs1799931, and rs1801279) and the fast acetylator phenotype alleles (rs1041983, rs1799929 and rs1208) [13, 14, 17, 18].
The current study is a computational analysis to investigate mutation sin theNAT2 gene underlying phenotypic variations and predict the importance of the NAT2genetic polymorphism as a risk factor in Cancer or human disorders, using an insilico approach.
2. Methods
2.1. Data Collection
NAT2proteinstructure and function were analyzed using in silico translation methods including various databases and software. The related SNP information, protein accession number (GenPept accession number, NP_000006.2) were obtained from the NCBI Protein database during November2017. NAT2SNPs were obtained using the dbSNP database (query, NAT2; species, Homo sapiens and their dbSNP accession number).
The nucleotide sequence of the NAT2 gene and amino acid sequence of the NAT2 protein were obtained from NCBI GenBank (accession number, NG_012246.1).
2.2. The Following Software Were Used During the Study
1. GeneMANIA
The query (Homosapiens; NAT2) was submitted to GeneMANIA (http://www.genemania.org). GeneMANIA built a complex gene-gene functional interaction network from a gene list containing a greatly adaptive algorithm. The output was given as a diagram and tables illustrating physical interaction co-expression and relation with other genes in a network form [19].
2. Sorting Intolerant From Tolerant SIFT
The functional effects of the deleterious SNPs was predicted using (SIFT) v5.1. SIFT analysis depends on sequence homology and the physical properties of the resulting amino acids in each protein and the possible consequent interrelations and changes in protein function. The FASTA format protein sequence of NAT2 was obtained from Expasy/UniprotKB, and amino acids substitution list obtained from dbSNP database (wild type protein/codon position/mutation residue) was entered in to SIFT(Single Protein Tools-SIFT sequence). Positions with regularized possibilities less than 0.05 were predicted to be intolerant (deleterious) and these SNPs were subjected for further analysis. Those with score the same to 0.05 or more were predicted to be tolerated and were not subjected for further analysis [20].
3. PolyPhen-2
as probably or possibly damaging depending on a score range. SNPs that were predicted to be benign were not analyzed further [21].
2.3. Prediction of Disease-associated Variations
2.3.1. SNPs & GO
SNPs & Go is used to find the association between SNPs and diseases. It classifies the SNPs as disease-related or neutral. The NAT2 SNPs that were classified as possibly or probably damaging by PolyPhen-2 were the input for SNPs &GO. The protein sequence and amino acid change (wild type, mutant type and site of the mutation) were submitted into the software. The prediction was displayed either as neutral or disease according to the probability. A probability of more than0.5 is predicted to be disease-related. Available at: http://snps.Biofold.org/snps-and-go/snps-and-go.html [22].
2.3.2. PhD-SNP
PhD-SNP (http://snps.biofold.org/phd-snp/phd-snp.html), is a support vector machine(SVM) used to assess whether a given single nsSNP can be classified as disease-related or has a neutral effect, similar to SNPs & GO. The NAT2 FASTA protein sequence and amino acid change (wild type, mutant type and site of the mutation) were submitted into the software. [23]
2.3.3. PMut
Prediction of the pathologic character of a point mutation in a protein using PMut.
It is a server that predicts whether aNAT2 nucleotide substitution is related to pathological mutations or it is neutral. It is used for unusual kinds of sequence information to label single point mutations depending on neural networks to process this information. The input was UniProt ID of the protein (P11245) or protein sequence and mutation to analyze and an output (pathological or not) and a reliability index were given [24] Available at; http://mmb2pcb.ub.es/PMut/.
2.3.4. nsSNP Analyzer
nsSNP Analyzer was used to predict whether NAT2nsSNP
has a phenotypic effect. It works in multistep manner. First the NAT2 protein sequence was to upload, then SNP data (rsSNPs from dbSNP) was uploaded. The output was given 'disease’ or ‘neutral’ [25]. (http://snpanalyzer.uthsc.edu/help.htm)
2.4. Impact of nsSNPs on Protein Stability
I-Mutant 3.0
It is a SVM that uses a web tool to study if the protein stability is changed by substitution. The FASTA sequence of the NAT2 protein, in addition to the residues changes, were the input. I-Mutant 3.0 can predict the direction of the free energy change (∆∆G value (kcal/mol)) and it calculates the reliability index (RI) value. The output determines if the substitution can lead to decrease or increase in the stability of
protein (24).
2.5. Allocation of nsSNPs in MutS Domains Using Mutation3D
Mutation3D (http://mutation3d.org), is a useful prediction and imaging server for learning the specific display of residues substitutions on protein forms and structures. It recognizes somatic cancer-causing mutations across several patients, in sequence to see efficient hotspots and increase downstream theories. It is also functional for grouping other types of mutational information, or merely as a tool to rapidly assess the relative sites of residues in proteins. The NAT2 FASTA protein sequence and amino acids substitution were input. The results is shown as a diagram [25].
2.6. Protein Modeling
2.6.1. PROJECT-HOPE
HOPE (http://www.cmbi.ru.nl/hope/home), is used to determine the structural effects of a mutation. It collects structural information from various sources. The input was the NAT2 protein sequence in FASTA format or an accession number (GenPeptNP_000006.2). The wild-type residue and the mutant type were specified. HOPE provides a report describing the effect of the amino acid substitution on the protein structure and provides a graphical structure for the protein (if available) [26].
2.6.2. Chimera
Chimera (http://www.cgl.ucsf.edu/chimera), is a homology modeling server that investigates the three-dimensional structure of proteins. It was used to visualize and analyze NAT2 protein, molecular constructions and related data, including density maps, supra molecular collectives, sequence arrangements, docking products, trajectories, and conformational ensembles to generate the mutated protein 3D model. The PDB accession number2PFRwas entered and the amino acid substitution through the beta or alpha chain was selected, giving a graphic model depicting the mutant protein.
2.7. Prediction of the Influence of NAT2 SNPs at the 3'UTR
The PolymiRTS
The PolymiRTS (http://compbio.uthsc.edu/miRSNP),
microRNA site (D, disrupted) and/or derived allele that generates a new microRNA site (C, created).
3. Results
A total of 182 were nsSNPs, 60 were synonymous SNPs, 48 were in the 3’UTR and 19 were in the 5’UTR. General characteristics of NAT2collected from different databases are presented in Table 1.
NAT2SNPs were retrieved from dbSNP and NAT2protein sequences was retrieved from Expasy/UniProtKB.
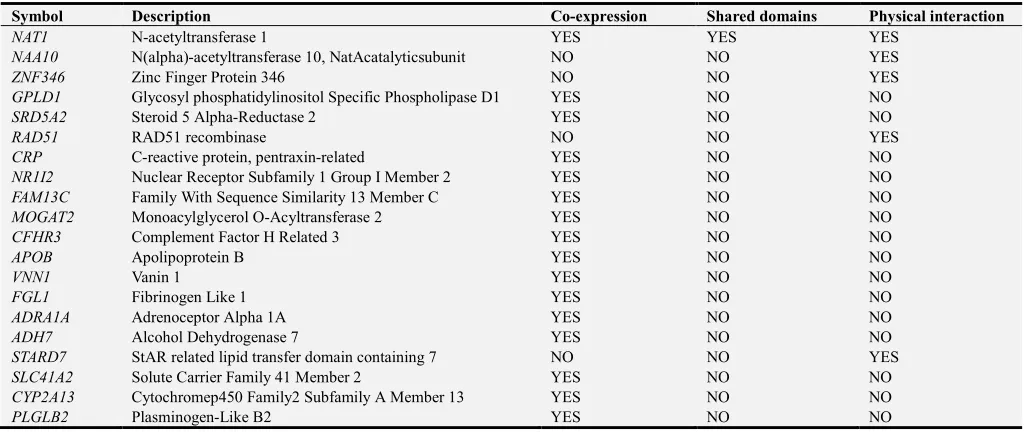
The relation, co-expression and physical interactions of NAT2 gene with other genesin the network, produced by GeneMANIA, are presented in Figure 1 and Tables 2 and 3,
respectivel
y.
Table 1. Descriptive feature for NAT2 gene.
Character of Nat2 Descriptive
Louse in chromosome (8) Start from 5001 – 14969
Gene nucleotide NO 16969 bp
No of exon 2exon(1-5001-5101bp,
2-13754-14969bp) Protein accession number NP 000006.2
No of amino acid 290aa
Unique stable identifier entry
(Expasy UniProtKB) P11245
Mnemonic identifier of
UniProtKB entry ARY2_HUMAN
PDB ID 2PFR.A
Figure 1. Functional interactions between NAT2 and relatedgenesusing GeneMANIA software.
Table 2. Genesthat areco-expressed, have shared domain and/or physical interactions with the NAT2 gene.
Symbol Description Co-expression Shared domains Physical interaction
NAT1 N-acetyltransferase 1 YES YES YES
NAA10 N(alpha)-acetyltransferase 10, NatAcatalyticsubunit NO NO YES
ZNF346 Zinc Finger Protein 346 NO NO YES
GPLD1 Glycosyl phosphatidylinositol Specific Phospholipase D1 YES NO NO
SRD5A2 Steroid 5 Alpha-Reductase 2 YES NO NO
RAD51 RAD51 recombinase NO NO YES
CRP C-reactive protein, pentraxin-related YES NO NO
NR1I2 Nuclear Receptor Subfamily 1 Group I Member 2 YES NO NO
FAM13C Family With Sequence Similarity 13 Member C YES NO NO
MOGAT2 Monoacylglycerol O-Acyltransferase 2 YES NO NO
CFHR3 Complement Factor H Related 3 YES NO NO
APOB Apolipoprotein B YES NO NO
VNN1 Vanin 1 YES NO NO
FGL1 Fibrinogen Like 1 YES NO NO
ADRA1A Adrenoceptor Alpha 1A YES NO NO
ADH7 Alcohol Dehydrogenase 7 YES NO NO
STARD7 StAR related lipid transfer domain containing 7 NO NO YES
SLC41A2 Solute Carrier Family 41 Member 2 YES NO NO
CYP2A13 Cytochromep450 Family2 Subfamily A Member 13 YES NO NO
Table 3. NAT2 gene relationships and appearance in the network.
Function FDR Genes in network Genes in genome
Cellular Response To Foreign Stimulus 9.63E-07 7 149
Response To Xenobiotic Stimulus 9.63E-07 7 149
Xenobiotic Metabolic Process 9.63E-07 7 148
Drug Catabolic Process 0.243286 2 10
Terpenoid Metabolic Process 0.30869 3 78
Isoprenoid Metabolic Process 0.393928 3 90
Response To Drug 0.628239 3 111
Regulation Of Macrophage Derived Foam Cell Differentiation 0.813281 2 28
Oxidoreductase Action, Acting On The Aldehyde Or Oxo Group Of Donors 0.813281 2 32
Drug Metabolic Process 0.813281 2 30
FDR: False discovery Rate
After analyzing with 6 software; our findings showed that 65 SNPs were highly disordered (lowered enzyme activity SNP), their scores reading range from 3 to 6 in six software, 26 SNPs (out of 65 mutation) were fully alteration (Slow acetylator phenotype), their scores reading 6 in six software.
Using PhD-SNP, 44 SNPs were found to be disease-related and 21 SNPs were found to be neutral. Using SNPs & GO, 31 SNPs were predicted to be disease-related and 24 SNPs were classified as neutral.
Using nsSNPAnalyzer, it was predicted that 60 SNPs were
disease-related and only five were neutral. Using PMut, almost 54 SNPs were reported as pathogenic, while only 11 SNPs were characterized as neutral. These SNPs were further computed with I-Mutant 3.0, revealing55 SNPs out of 65 SNPs caused a decrease in the effective stability of the protein.
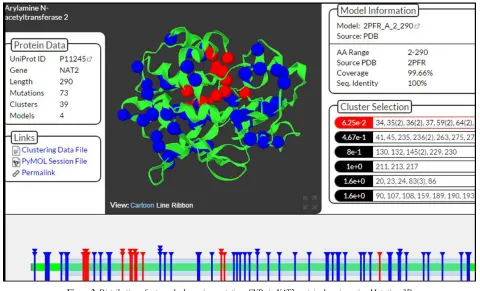
One domain was found inNAT2; 53SNP harmful alterations were situated in a protein domain structure (39 covered and 14 clustered), and 3 mutations were located in the inter domain region (Figure 2).
Figure 2. Distribution of extremely damaging mutations SNPs in NAT2 protein domains using Mutations3D.
Out of the 72 SNPs reported at the 3`UTR of NAT2, three functional SNPs were predicted to affect miRNA binding Sites when analyzed using PolymiRTS database. The first SNP (rs45539742) was found to has 2 alleles (C and G) contain disrupt three conserved miRSites (D) and one (C) Function class on miRSite. In the second SNP (rs56011639)
Table 4. NAT2 SNPs predicted by PolymiRTS to make disturbance of conservedmiRNA site or creation of new microRNA binding location D, the resulting allele disorders a conserved binding site; C, the derived allele generates a new binding site.
Location dbSNP ID Allele miR ID Conservation Binding Site Function class Context +score change
18258614 rs45539742 C
hsa-miR-15a-3p 4 gATGGCCTgtgat D -0.246
hsa-miR-1972 2 gaTGGCCTGtgat D -0.278
hsa-miR-4529-5p 4 GATGGCCtgtgat D -0.278
G hsa-miR-122-3p 4 gATGGCGTgtgat C -0.265
18258647 rs56011639
C hsa-miR-1287-3p 4 ttcatGCTAGAAa D -0.192
T hsa-miR-4263 3 ttcatgTTAGAAA C -0.045
hsa-miR-576-5p 3 ttcatgTTAGAAA C -0.058
18258715 rs142360798 A
hsa-miR-16-2-3p 3 taaagAATATTGt D -0.069
hsa-miR-195-3p 3 taaagAATATTGt D -0.051
hsa-miR-338-5p 2 taaagaATATTGT D -0.082
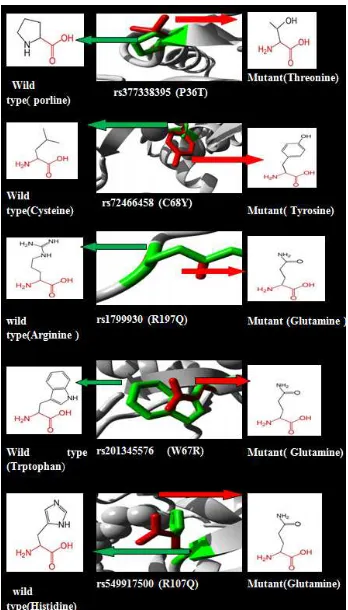
Modelling annotation An amino acid residue substitution from the original amino acid (arginine) to the mutant
(tryptophan) at codon 64, produced using Chimera, are shown in Figure 3.
Figure 3. Chimera modeling of arginine mutated to tryptophan.
Three-dimensional structure modeling in the wild type of amino acid substitution by the mutant SNPrevealed by ProjecHOPE; NAT2 protein sequence ProjecHOPE server is shown in Figure 4.
4. Discussion
SNPs are the simplest shape and the most frequent cause of hereditary variation in the human genome [30] SNP variations are a frequent source of information used in bioinformatics tools and are thus involved in subsequent proteomics studies. A main role of this branch of bioinformatics is to predict the effect of SNPs at the protein level and possible consequences on the function of the protein [9]. SNP mutations inNAT2 gene have been described as an important risk factor of various cancers (including acute lymphoblastic leukemia, and cancer of the bladder, colon, head and neck, lung and breast), driven by low or noNAT2 activity [8, 15, 17, 31, 32].
The mutant residue of the R64Q SNP (rs1801279) was predicted to be smaller in size than the wild-type and is neutrally charged while the wild-type is positive. This variation in charge could disturb the ionic interaction bonds made by the native amino acid, while the size difference acetylator phenotype changes the position of the new residue in the protein, preventing the creation of the same hydrogen bonds made by the original wild-type amino acid. Due to the difference in size, the mutation will cause the formation of an empty area in the core of the protein. Other consequences were also reported; for example, the mutant residue of the C68Y (rs72466458) is bigger than the wildtype and is situated close to a highly conserved site of protein that is changed from being buried in the core to being present on the surface, leading to loss of hydrophobicity. This conformational change can be seen in the three-dimensional modeling structure, where the original residue has an interaction with a ligand, while the mutant lacks this interaction, meaning that the protein function must be disturbed. Other SNPs, like P36T (rs377338395), change the hydrophobicity of the amino acid; the original amino acid (proline) is more hydrophobic than the mutant residue. Prolines are recognized to be very stiff and therefore make a specific backbone modification which might be needed at this position; the interruption of this special modulation could cause failure of hydrophobic interactions in the center of the protein. In the 3`UTR, the polymorphisms occurrences were predicted to affect microRNA, because the three SNPs disrupted and/or created new binding sites in the gene, leading to deregulation of gene function.
In the current study, a computational examination of the reported NAT2 SNPs using various publicly available software and databases was conducted to understand their possible influence on the protein structure and function, and hence their ability to cause or enhance advance cancer development. The analysis revealed that the NAT2 gene is highly polymorphic and can contribute to disease formation following changes in its amino acids. The results of this analysis agrees with several studies [15, 18, 33]. It also shows that the NAT2 had strong mutagenic and carcinogenic effects, due to changes in protein structure and function
produced by deleterious SNPs [8, 31].
Several wet lab studies highlighted the role of a number of
NAT2SNPs in carcinogenesis [5, 12, 17, 34] Of these, two SNPs(rs1801279 (R64Q) and rs1799930 (R197Q)) were revealed to be highly damaging and could decrease the stability of protein according to six software and the I-Mutant 3.0 computational analysis tool in your study. In wet lab studies, these SNPs were defined as causing a significant decrease in acetylation capacity and are associated with a slow acetylator phenotype, leading to many diseases (e.g. lung cancer or chronic myelocytic leukemia) [3, 13, 33]. Two other SNPs (rs1799929 and rs1208) were synonymous, showing tolerated (using SIFT) and benign (using PolyPhen-2) effects by computational analysis software (i.e. they do not alter the phenotype), and they have been identified as slow acetylator phenotype in a wet lab setting (these findings agree with another study) [10]. Another SNP (rs1799931 (G386E) was classified as slow-acetylator in wet lab and the produced protein was considered as slower acetylator in the aforementioned study[5, 12, 17]. However, it was observed as tolerated and benign in this study; this different expression of acetylator phenotype may be due to genetic variations or interactions that differs between individuals.
The coding and non- coding NAT2-SNPs might cause protein structure or expression alterations, leading to a wide range of variation at the population level and disease characteristics. Such proteomics information, are in general, closely joined to current (post-genomic) drug discovery studies [9] and individualized medicine.
5. Conclusions
NAT2 is highly polymorphic. A 65-SNP panel infers NAT2
acetylator phenotype with high accuracy, were predicted by diverse software tools mostly damaging mutations shifting physiochemical properties of the protein; dimension, charge and hydrophobicity essential to a lack or disorder of the protein function and their configuration. Three NAT2 SNPs at the3'UTR caused a change in the microRNA binding position, which might result in deregulation of gene function. Thus, low or no NAT2 activity can be connected to higher susceptibility to unfavorable risk factors and various types of cancer.
Grant Information
The authors declare that no grants were involved in supporting this work.
Acknowledgements
Appendix
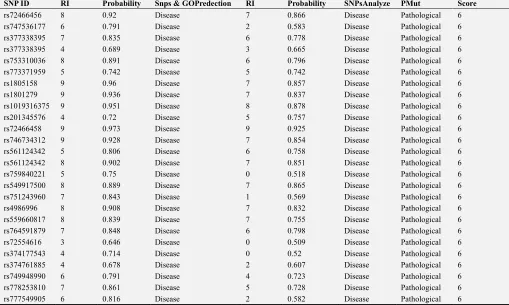
Table A1. Prediction of functional modification of NAT2 protein using six software SNPs showingfully damagingNAT2 SNPs.
SNP ID Amino Acid Change Sift TI Predication PolyphenPSIC Score Phd-SNP Predication
rs72466456 I10S Deleterious 0.01 Probably damaging 0.99 Disease
rs747536177 G11V Deleterious 0.00 Probably damaging 1 Disease
rs377338395 P36T Deleterious 0.00 Probably damaging 1 Disease
rs377338395 P36A Deleterious 0.00 Probably damaging 1 Disease
rs753310036 F37S Deleterious 0.00 Probably damaging 1 Disease
rs773371959 I59T Deleterious 0.01 Probably damaging 1 Disease
rs1805158 R64W Deleterious 0.00 Probably damaging 1 Disease
rs1801279 R64Q Deleterious 0.00 Probably damaging 1 Disease
rs1019316375 G65V Deleterious 0.00 Probably damaging 1 Disease
rs201345576 W67R Deleterious 0.00 Probably damaging 1 Disease
rs72466458 C68Y Deleterious 0.00 Probably damaging 1 Disease
rs746734312 G83C Deleterious 0.00 Probably damaging 1 Disease
rs561124342 G83A Deleterious 0.00 Possibly damaging 0.67 Disease
rs561124342 G83V Deleterious 0.00 Probably damaging 1 Disease
rs759840221 G90R Deleterious 0.01 Probably damaging 1 Disease
rs549917500 H107Q Deleterious 0.00 Probably damaging 1 Disease
rs751243960 L108R Deleterious 0.03 Probably damaging 1 Disease
rs4986996 D122Y Deleterious 0.00 Probably damaging 1 Disease
rs559660817 D122G Deleterious 0.00 Probably damaging 1 Disease
rs764591879 G124V Deleterious 0.01 Probably damaging 1 Disease
rs72554616 Q145P Deleterious 0.03 Probably damaging 1 Disease
rs374177543 L152W Deleterious 0.01 Probably damaging 1 Disease
rs374761885 Y190C Deleterious 0.00 Probably damaging 1 Disease
rs749948990 G230V Deleterious 0.01 Probably damaging 1 Disease
rs778253810 G236R Deleterious 0.00 Probably damaging 1 Disease
rs777549905 L279R Deleterious 0.00 Probably damaging 1 Disease
Table A1. Continued.
SNP ID RI Probability Snps & GOPredection RI Probability SNPsAnalyze PMut Score
rs72466456 8 0.92 Disease 7 0.866 Disease Pathological 6
rs747536177 6 0.791 Disease 2 0.583 Disease Pathological 6
rs377338395 7 0.835 Disease 6 0.778 Disease Pathological 6
rs377338395 4 0.689 Disease 3 0.665 Disease Pathological 6
rs753310036 8 0.891 Disease 6 0.796 Disease Pathological 6
rs773371959 5 0.742 Disease 5 0.742 Disease Pathological 6
rs1805158 9 0.96 Disease 7 0.857 Disease Pathological 6
rs1801279 9 0.936 Disease 7 0.837 Disease Pathological 6
rs1019316375 9 0.951 Disease 8 0.878 Disease Pathological 6
rs201345576 4 0.72 Disease 5 0.757 Disease Pathological 6
rs72466458 9 0.973 Disease 9 0.925 Disease Pathological 6
rs746734312 9 0.928 Disease 7 0.854 Disease Pathological 6
rs561124342 5 0.806 Disease 6 0.758 Disease Pathological 6
rs561124342 8 0.902 Disease 7 0.851 Disease Pathological 6
rs759840221 5 0.75 Disease 0 0.518 Disease Pathological 6
rs549917500 8 0.889 Disease 7 0.865 Disease Pathological 6
rs751243960 7 0.843 Disease 1 0.569 Disease Pathological 6
rs4986996 8 0.908 Disease 7 0.832 Disease Pathological 6
rs559660817 8 0.839 Disease 7 0.755 Disease Pathological 6
rs764591879 7 0.848 Disease 6 0.798 Disease Pathological 6
rs72554616 3 0.646 Disease 0 0.509 Disease Pathological 6
rs374177543 4 0.714 Disease 0 0.52 Disease Pathological 6
rs374761885 4 0.678 Disease 2 0.607 Disease Pathological 6
rs749948990 6 0.791 Disease 4 0.723 Disease Pathological 6
rs778253810 7 0.861 Disease 5 0.728 Disease Pathological 6
rs777549905 6 0.816 Disease 2 0.582 Disease Pathological 6
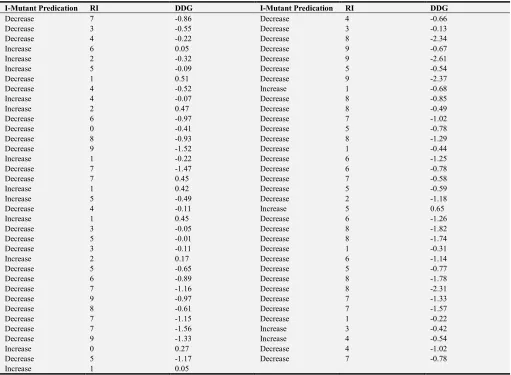
Table A2. Prediction of NAT2 protein stability using I-Mutant.
I-Mutant Predication RI DDG I-Mutant Predication RI DDG
Decrease 7 -0.86 Decrease 4 -0.66
Decrease 3 -0.55 Decrease 3 -0.13
Decrease 4 -0.22 Decrease 8 -2.34
Increase 6 0.05 Decrease 9 -0.67
Increase 2 -0.32 Decrease 9 -2.61
Increase 5 -0.09 Decrease 5 -0.54
Decrease 1 0.51 Decrease 9 -2.37
Decrease 4 -0.52 Increase 1 -0.68
Increase 4 -0.07 Decrease 8 -0.85
Increase 2 0.47 Decrease 8 -0.49
Decrease 6 -0.97 Decrease 7 -1.02
Decrease 0 -0.41 Decrease 5 -0.78
Decrease 8 -0.93 Decrease 8 -1.29
Decrease 9 -1.52 Decrease 1 -0.44
Increase 1 -0.22 Decrease 6 -1.25
Decrease 7 -1.47 Decrease 6 -0.78
Decrease 7 0.45 Decrease 7 -0.58
Increase 1 0.42 Decrease 5 -0.59
Increase 5 -0.49 Decrease 2 -1.18
Decrease 4 -0.11 Increase 5 0.65
Increase 1 0.45 Decrease 6 -1.26
Decrease 3 -0.05 Decrease 8 -1.82
Decrease 5 -0.01 Decrease 8 -1.74
Decrease 3 -0.11 Decrease 1 -0.31
Increase 2 0.17 Decrease 6 -1.14
Decrease 5 -0.65 Decrease 5 -0.77
Decrease 6 -0.89 Decrease 8 -1.78
Decrease 7 -1.16 Decrease 8 -2.31
Decrease 9 -0.97 Decrease 7 -1.33
Decrease 8 -0.61 Decrease 7 -1.57
Decrease 7 -1.15 Decrease 1 -0.22
Decrease 7 -1.56 Increase 3 -0.42
Decrease 9 -1.33 Increase 4 -0.54
Increase 0 0.27 Decrease 4 -1.02
Decrease 5 -1.17 Decrease 7 -0.78
Increase 1 0.05
∆∆ sign DDG Value: DG(Original Protein)-DG(Wild Type) in kcal/mle, NAT2 rate: DDG<0: decresase stability, DDG>0: increase stability, I-Mutant- SNPRI(Reliability Index): 0=10, where 0 is the lowest reliability and 10 is the highest reliability.
References
[1] Lee J-E, Choi JH, Lee JH, Lee MG. Gene SNPs and mutations in clinical genetic testing: haplotype-based testing and analysis. Mutation Research/Fundamental and Molecular Mechanisms of Mutagenesis. 2005; 573 (1-2): 195-204.
[2] Abdelraheem NE, Osman MM, Elgemaabi OM, Alla AAF, Ismail MM, Osman SA, et al. Computational Analysis of Deleterious Single Nucleotide Polymorphisms (SNPs) in Human MutS Homolog6 (MSH6) Gene. American Journal of Bioinformatics Research. 2016; 6 (2): 56-97.
[3] Engin HB, Hofree M, Carter H, editors. Identifying mutation specific cancer pathways using a structurally resolved protein interaction network. Pacific symposium on biocomputing co-chairs; 2014: World Scientific.
[4] Globyte V, Kim SH, Joo C. Single-Molecule View of Small RNA–Guided Target Search and Recognition. Annual review of biophysics. 2018; 47: 569-93.
[5] Zupa A, Sgambato A, Bianchino G, Improta G, Grieco V, La Torre G, et al. GSTM1 and NAT2 polymorphisms and colon,
lung and bladder cancer risk: a case-control study. Anticancer research. 2009; 29 (5): 1709-14.
[6] Wiemels JL, Smith RN, Taylor GM, Eden OB, Alexander FE, Greaves MF, et al. Methylenetetrahydrofolate reductase (MTHFR) polymorphisms and risk of molecularly defined subtypes of childhood acute leukemia. Proceedings of the National Academy of Sciences. 2001; 98 (7): 4004-9.
[7] Wang P, Li S, Wang M, He J, Xi S. Association of MTRR A66G polymorphism with cancer susceptibility: Evidence from 85 studies. Journal of Cancer. 2017; 8 (2): 266.
[8] Di Pietro G, Gadelha SR, Sousa SMB, de Melo PRS, Santos FR. N-acetyltransferase 2: Slow, intermediate or fast? A booming question of the molecular epidemiology in cancer research. Open Journal of Genetics. 2012; 2 (04): 221.
[9] Safaei A, Zaker F. Influences of Genetic Abnormality on the Risk of Acute Lymphoblastic Leukemia. Iranian Journal of Blood and Cancer. 2012; 4 (4): 169-78.
[11] Satoh T. Genetic polymorphism in drug metabolism and toxicity: Linking animal research and risk assessment in man. AATEX. 2007; 14: 443-5.
[12] Santos ECLd, Pinto AC, Klumb EM, Macedo JMB. Polymorphisms in NAT2 (N-acetyltransferase 2) gene in patients with systemic lupus erythematosus. Revista brasileira de reumatologia. 2016; 56 (6): 521-9.
[13] Borlak J, Reamon-Buettner SM. N-acetyltransferase 2 (NAT2) gene polymorphisms in colon and lung cancer patients. BMC medical genetics. 2006; 7 (1): 58.
[14] Guaoua S, Ratbi I, Laarabi FZ, Elalaoui SC, Jaouad IC, Barkat A, et al. Distribution of allelic and genotypic frequencies of NAT2 and CYP2E1 variants in Moroccan population. BMC genetics. 2014; 15 (1): 156.
[15] Mittal RD, Srivastava DS, Mandhani A. NAT2 gene polymorphism in bladder cancer: a study from North India. International braz j urol. 2004; 30 (4): 279-85.
[16] Gra O, Mityaeva O, Berdichevets I, Kozhekbaeva Z, Fesenko D, Kurbatova O, et al. Microarray-Based Detection of CYP1A1, CYP2C9, CYP2C19, CYP2D6, GSTT1, GSTM1, MTHFR, MTRR, NQO1, NAT2, HLA-DQA1, and AB0 Allele Frequencies in Native Russians. Genetic testing and molecular biomarkers. 2010; 14 (3): 329-42.
[17] Hein DW, Doll MA. Accuracy of various human NAT2 SNP genotyping panels to infer rapid, intermediate and slow acetylator phenotypes. Pharmacogenomics. 2012; 13 (1): 31-41.
[18] Khlifi R, Messaoud O, Rebai A, Hamza-Chaffai A. Polymorphisms in the human cytochrome P450 and arylamine N-acetyltransferase: susceptibility to head and neck cancers. BioMed research international. 2013; 2013.
[19] Warde-Farley D, Donaldson SL, Comes O, Zuberi K, Badrawi R, Chao P, et al. The GeneMANIA prediction server: biological network integration for gene prioritization and predicting gene function. Nucleic acids research. 2010; 38 (suppl_2): W214-W20.
[20] Vaser R, Adusumalli S, Leng SN, Sikic M, Ng PC. SIFT missense predictions for genomes. Nature protocols. 2016; 11 (1): 1.
[21] Alabid T, Kordofani AA, Atalla B, Altayb HN, Fadla AA, Mohamed M, et al. In silico Analysis of Single Nucleotide Polymorphisms (SNPs) in HumanVCAM-1 gene. 2016.
[22] Calabrese R, Capriotti E, Fariselli P, Martelli PL, Casadio R. Functional annotations improve the predictive score of human disease‐related mutations in proteins. Human mutation. 2009; 30 (8): 1237-44.
[23] Capriotti E, Fariselli P, Calabrese R, Casadio R. Predicting protein stability changes from sequences using support vector machines. Bioinformatics. 2005; 21 (suppl_2): ii54-ii8.
[24] Capriotti E, Fariselli P, Casadio R. I-Mutant2. 0: predicting stability changes upon mutation from the protein sequence or structure. Nucleic acids research. 2005; 33 (suppl_2): W306-W10.
[25] Meyer MJ, Lapcevic R, Romero AE, Yoon M, Das J, Beltrán JF, et al. mutation3D: cancer gene prediction through atomic clustering of coding variants in the structural proteome. Human mutation. 2016; 37 (5): 447-56.
[26] Saunders CT, Baker D. Evaluation of structural and evolutionary contributions to deleterious mutation prediction. Journal of molecular biology. 2002; 322 (4): 891-901.
[27] Bhattacharya A, Ziebarth JD, Cui Y. PolymiRTS Database 3.0: linking polymorphisms in microRNAs and their target sites with human diseases and biological pathways. Nucleic acids research. 2013; 42 (D1): D86-D91.
[28] Ziebarth JD, Bhattacharya A, Chen A, Cui Y. PolymiRTS Database 2.0: linking polymorphisms in microRNA target sites with human diseases and complex traits. Nucleic acids research. 2011; 40 (D1): D216-D21.
[29] Kamel AM, Ebid GT, Moussa HS. N-Acetyltransferase 2 (NAT2) polymorphism as a risk modifier of susceptibility to pediatric acute lymphoblastic leukemia. Tumor Biology. 2015; 36 (8): 6341-8.
[30] Li S LH, Jia Y, Deng Y, Zhang L, Lu Z, et al. A Novel SNPs detection method based on gold magnetic nanoparticles array and single base extension. Theranostics. 2012; 2: (10): 967– 75.
[31] Buffler PA, Kwan ML, Reynolds P, Urayama KY. Environmental and genetic risk factors for childhood leukemia: appraising the evidence. Cancer investigation. 2005; 23 (1): 60-75.
[32] Zheng Z, Qiao Z, Gong R, Yang B, Xu L, Zhang L, et al. Association between single nucleotide polymorphism of N-acetyltransferase 2 and susceptibility to acute lymphoblastic leukemia in Chinese Han children. INTERNATIONAL JOURNAL OF CLINICAL AND EXPERIMENTAL PATHOLOGY. 2017; 10 (6): 7052-8.