Published online May 30, 2013 (http://www.sciencepublishinggroup.com/j/ijepe) doi: 10.11648/j.ijepe.20130202.16
Numerical investigation of flow in generation IV pebble
bed gas cooled core reactors
André A. C. Santos, Franklin C. Costa, Amir Z. Mesquita*, Hugo C. Rezende
Nuclear Technology Development Center, Brazilian Nuclear Energy Commission (CDTN/CNEN), Belo Horizonte, Brazil
Email address:
[email protected](A. A. C. Santos), [email protected](F. C. Costa), [email protected](A. Z. Mesquita), [email protected](H. C. Rezende)
To cite this article:
André A. C. Santos, Franklin C. Costa, Amir Z. Mesquita, Hugo C. Rezende. Numerical Investigation of Flow in Generation IV Pebble Bed Gas Cooled Core Reactors. International Journal of Energy and Power Engineering. Vol. 2, No. 2, 2013; pp. 69-76.
doi: 10.11648/j.ijepe.20130202.16
Abstract:
This article presents a numerical investigation of thermal-fluid dynamics processes through the gaps of the spherical fuel elements (fuel pebbles) in the core of a Pebble Bed Reactor (PBR), using Computational Fluid Dynamics (CFD). The PBR is one of the most promising projects of the six classes of Generation IV Very High Temperature Reactor (VHTR). The results of two analyzes are presented. In the first case were evaluated two models of heat transfer to the spherical fuel. In this model is specified the volumetric heat generation, with thermal conduction in the fuel, and in the cladding. In the second model was specified a particular heat flux at the spherical fuel elements surface. In this analysis were performed simulations in two arrays of spheres i.e., the spheres into contact and spaced 2 mm. In the second analysis was also evaluated the influence of the spheres arrangement in the bed thermal-fluid dynamic behavior. The set of pebbles that constitute the core was modeled by representations of crystalline structure with different packing factors. The four simulations of the first analysis showed differences in flow and temperature profiles and maximum surface coating. There were also no significant differences in flow and heat transfer between the beads and the fluid in cases with different packing factors. These results show the importance of simulation of heat conduction inside the pebble fuel as well as the need to better assess the influence of the arrangement formed by pebbles fuel in PBR reactors thermal-fluid dynamics behavior.Keywords:
Very High Temperature Reactor (VHTR), Computational Fluid Dynamics (CFD), PBR Reactors1. Introduction
A Very High Temperature Gas-cooled Reactor (VHTR) is one of the renewed reactor designs to play a role in nuclear power generation. The Generation IV International Forum findings relative to the future nuclear systems (sustainability, security and reliability, economy, non-proliferation and physical protection) have given new impetus to graphite-moderated VHTRs. These reactors design concept is currently under consideration and development worldwide. The high modular VHTR concept exhibits inherent safety features due to the low power density and the large amount of graphite present in the core, which gives a large thermal inertia in the event of accidents as loss of coolant. These passive concepts were first introduced in German HTR-Module (pebble fuel) design [1, 2]. The fuel design of fissile kernels coated with carbon and silicon carbide layers mixed with graphite is suitable for reaching very high burn up and ensures a full confinement of volatile fission products during normal and abnormal
situations. The combination of coated particle fuel, inert helium gas as coolant and graphite moderated reactor makes possible to operate at high temperature yielding a high efficiency. Other characteristics of VHTR are the capability of providing high temperature heat and suitability for various power conversion cycles [3]. They will be capable of delivering high temperature helium (up to 950 °C) either for industrial heat application or directly to drive gas turbines for electricity (the Brayton cycle) with about 48% thermal efficiency possible. Technology developed in the last decade makes HTRs more practical than in the past, though the direct cycle will be a further technological step, which means that there must be high integrity of fuel and reactor components [4].
later imported by China and developed in the Republic of South Africa as the Pebble Bed Modular Reactor (PBMR) [5].
This paper presents a numerical investigation of flow and heat transfer between the coolant and fuel spheres present in the core of a PBR using the CFD code CFX 13.0 [6]. This study is an initial step in the development of procedures for the numerical simulation of transport phenomena and advanced reactors safety analysis under Brazilian Institute of Science and Technology (INCT).
2. The Pebble Bed Reactor (PBR)
In Pebble Bed Reactor (PBR) cores, the gas flows around randomly distributed spheres in the reactor vessel. Fuels are continually replaced in the core. The understanding of such complex unsteady flows is important. This requires a variety of analysis techniques and simulation tools. A model of the core of a PBR is shown in Fig. 1 [7].
Figure 1. Diagram of thePebble Bed Reactor (PBR) [7].
The basic design of pebble bed reactors features spherical fuel elements called pebbles. These tennis ball-sized pebbles are made of pyrolytic graphite (which acts as the moderator), and they contain thousands of micro fuel particles called TRISO particles. These TRISO fuel particles consist of a fissile material (such as 235U) surrounded by a coated ceramic layer of silicon carbide for structural integrity and fission product containment. In the PBR, thousands of pebbles are amassed to create a reactor core, and are cooled by helium, which does not react chemically with the fuel elements. Figure 2 shows the TRISO sphere and the pebble fuel [7].
Figure 2.The TRISO sphere and the pebble fuel [7].
This type of reactor is claimed to be passively safe (negative coefficient of reactivity) that is, it removes the need for redundant, active safety systems. Because the reactor is designed to handle high temperatures, it can cool by natural circulation and still survive in accident scenarios, which may raise the temperature of the reactor to 1600 °C. Because of its design, its high temperatures allow higher thermal efficiencies than possible in traditional nuclear power plants (up to 50%) and have the additional feature that the gases do not dissolve contaminants or absorb neutrons as water does, so the core has less in the way of radioactive fluids. [3]
Because of the multi layers, the pellets are extremely heat resistant, able to reach temperatures around 1600°C. In addition, due to the high durability of the pellets, it is difficult to remove the trapped fission products and ultimately discourages proliferation. Waste disposal also becomes easier as the fuel is concentrated. Figure 3 shows a TRISO fuel sphere.
In pebble bed reactor cores, the gas flows around randomly distributed spheres. The understanding of such complex unsteady flows is important. This requires a variety of analysis techniques and simulation tools. These range from simple one-dimensional models that do not capture all the significant physical phenomena to large scale three dimensional computational fluid dynamics (CFD) codes [2, 3, 7, 8, 9].
In these studies, the random arrangement of pebbles fuel inside the reactor vessel has simplified by representations of the crystalline structures. These structures are characterized by a packing factor, defined as the fraction of volume occupied by the solid spheres. Other considerations in the numerical simulations of the pebble bed reactors are the spacing between the balls and prescription of a heat flow on the surface of spherical fuel. These considerations reduce the number of mesh nodes, but not realistically reproduce the flow in this reactor.
crystalline structures of face-centered cubic (CFC), and body-centered cubic (CCC) given spacing between adjacent spheres of 1 mm and the estimated flow on its surface. Lee et al. [7] studied the simplification of the spacing between the fuel pebbles in the simulations. Hasan [3] studied the simulation of turbulent transport for the gas through the gaps of the spherical fuel elements using the large eddy simulation. He investigated a structure composed of 24 spheres in point contact and flux prescribed on their surfaces. Sobes et al. [9] suggested the investigation of flow structures with high packing factor, as the structures FCC and HC (hexagonal compact).
3. Metodology
Two analyzes were performed in this work. In the first analysis were evaluated two models the heat transfer to the fuel spheres. Being a model with volumetric heat generation with thermal conduction, in the fuel and in the cladding. In another model was estimated heat flux at the surface of the spheres, simplifying the simulation. For each of these models were studied two cases, one considering spacing of 2 mm between the balls (no contact - SC) and another considering contact between them (contact - CC). The aim of this study was to evaluate the differences between these two mechanisms of heat generation.
In the second analysis it was evaluated the influence of the arrangement of spheres in thermal and fluid dynamic behavior of the pebble bed. The assembly that constitutes the pebble bed was modeled representing the crystal structures. As the arrangement of spheres is variable in PBR core reactors, it was studied models with different packing factors [10]. In the following are described the details of the simulations performed in both analyzes.
2.1. Geometries and Boundary Conditions
Fuels and boundary parameters used in the two analyzes are at a Pebble Bed Modular Reactor - PBMR with a power of 400 MW(t) shown in Table 1 [11].
Table 1. Operational parameters of the PBMR - 400 MW reactor
Parameter Values
Core Reactor Power 400 MW(t)
Coolant Helium
Fluid Flow 185 kg/s
System Pressure 9 MPa
Inlet/Outlet Temperatures 500 / 900 oC
Number of fuel Spheres in the Core 451 000
Tank Diameter/Internal Reflector 3.7 / 2.0 m
The geometries simulated in the first phase of this study are composed of two spheres contained in a volume in the shape of a rectangular prism as shown in Figure 3. The
spheres are aligned in the y direction, and 60 mm from the top and equidistant from the vertical center line of the prism (x = 90 mm, y = 120 mm, z = z mm). The side faces of the prism walls were considered symmetrical. The top was defined as fluid inlet with uniform velocity of 5 m/s and a temperature of 900 °C, conditions on the bottom of the reference reactor core. The bottom was defined as output with zero relative pressure.
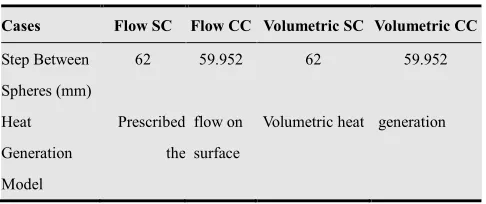
Four variations were simulated by varying the geometry of this distance between the centers of the spheres and the model of heat generation. Table 2 presents the data from the four simulated cases. In the case of volumetric heat generation in the fuel, three domains were created: one for the fluid, one for fuel and one for the cladding. In the case of estimated heat flux at the surface of the spheres was created just the domain of the fluid. The step between spheres is smaller than the diameter of the spheres in models with contact (CC Flow and CC Volumetric), which generates a circular contact area of a diameter of 2.4 mm. This contact area was estimated based on the deformation of the spheres caused by the gravitational load present in the lower region of the reactor [7]. In the regions of contact between spheres was not considered the heat transfer resistance. The surfaces of the spheres were considered smooth and without imperfections.
Figure 3. Geometry simulated in the first analysis
Table 2. Simulations
Cases Flow SC Flow CC Volumetric SC Volumetric CC
Step Between
Spheres (mm)
Heat
Generation
Model
62
Prescribed
the 59.952
flow on
surface
62
Volumetric heat
59.952
generation
It was adopted the values of 14.75 MW/m³ for the rate of volumetric heat generation in the fuel and 85.36 kW/m2 for the heat flux at the pebbles surface, based on data of Lee et al. [7].
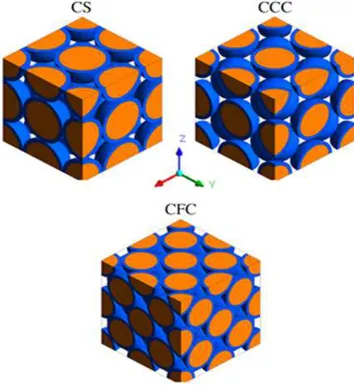
model suitable for simulation performed arrangements of spheres in the second analysis. Modeled in this study were based on the arrangements of spheres crystal structures: simple cubic (CS), the body centered cubic (CCC) and face-centered cubic (CFC), shown in Figure 4. The dimensions of the simulated cubes were calculated to be representative of the arrangement of spheres maintaining a sphere centered in the domain. Table 3 shows the characteristics of the simulated arrays.
The surface arrangements with higher Z were defined with inlet uniform temperature of 900 °C. The input flow in each model (mɺ model) was estimated according to Equation
1 considering the flow in the reactor (mɺ PMBR), the
cross-sectional area of the reactor core (APBMR), and
cross-sectional area of the model (Amodel).
(1)
The cross-sectional area of the reactor core was calculated using Equation 2 with the values of the diameter of the tank (DT) and the diameter of the reflector center
(DC).
(2)
The flow in the reactor core has been obtained from the data of Table 1. The cross-sectional area of each model is
ACS= 0.01438 m², ACCC = 0.01917 m², ACFC = 0.02875 m².
Therefore, the flow in each model is mɺ CS = 0.3495 kg/s, mɺ CCC = 0.466 kg/s, mɺ CFC = 0.699 kg/s.
The frontier output with lower Z face was set with zero relative pressure, where output and fluid inlet were permitted. The boundaries of adjacent field of fluid interfaces have been defined as translational periodicity to allow entry and exit of fluid. The faces of the fuel cladding and the edges of the field were considered as interfaces of symmetry.
Figure 4. Arrangements simulated spheres.
Table 4. Characteristics of simulated arrangements
Parameter CS CCC CFC
Packing Factor Cube Length (mm) Total Number of Simulated Spheres Number of Spheres in Contact with the
Central Sphere
0.52 120 8 6
0.68 138 16
8
0.74 170 32 12
2.2. Materials Properties
The thermodynamic properties of the fuel were found in Lee et al. [7] and evaluated using Equations 3 and 4, where
Kfuel is the fuel thermal conductivity fuel (J/mK) and cpthe
fuel specific heat (J/kgK).
(3)
(4)
The thermodynamic properties of graphite were obtained from Tak et al. [12]. The properties of helium were obtained from the NIST database [13].
Figure 5. Meshes used in the first analysis.
Were generated unstructured tetrahedral mesh for all cases of two analyzes. In all layers of mesh are generated prismatic elements, called Inflation to the surfaces of the pebbles in the domain of the fluid, and for cases with volumetric heat generation in the fluid-coating interface and coating-graphite in the field of fuel and fuel. There were five layers of specified Inflation with smooth transition between the last layer of tetrahedral mesh and the first prism and the growth rate of the layers of high
Inflation equal to 1.2. In cases of contact between the spheres used was a refinement edge contacts with pebbles fuel element size equal to 0.1 mm. Next the surfaces of the spheres the size of elements was set to 2 mm with an expansion allowable size of 1.2 to 5 mm. Node number of cases with volumetric heat generation and prescribed on the surface of the pebbles of the first analysis were equal to ~ 350,000 and ~ 230,000, respectively. Figure 5 shows the mesh used in the preliminary analysis of this study.
2.4. Numerical Parameters
The Reynolds-averaged Navier-Stokes equations (RANS) with the turbulence model k-ε and the energy equation were solved in the simulations using the code CFX 13.0 which is based on the method of finite volume [6].
The terms of all the equations have been discretized by high-resolution scheme, formally second order. In the simulations the transient temporal terms were discretized by Euler scheme of second order.
The calculations were performed in parallel for six Dell computers with two Intel Xeon 2.27 GHz processors and 24 GB of RAM memory each. The first analysis of the simulations was performed in steady-state. The virtual time step used was equal to 0.01 s for the fluid and 1 s to the solid [14].
In the second analysis the three arrangements were initially simulated in steady-state with virtual time step equal to 0.0001 s for the fluid and 1s to the solid. Simulations under permanent non-converged with 500 iterations, and it were decided to use the results of the 500th. iterations as initial condition for transient simulations. The full transient simulation for cases CS and CCC was equal to 1s with a time step equal to 0.005 s, achieving convergence with waste RMS of ~ 10-5. For the CFC arrangement, with greater difficulty convergence was simulated a total time equal to 0.1 s with a time step between 0.00025 s getting a RMS> 10-4.
3. Results
and Discussion
3.1. Results of the First Analysis
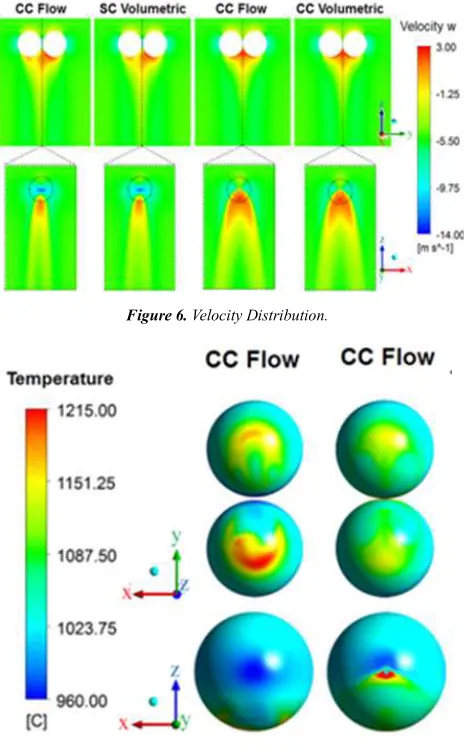
The velocity distribution in the central domain planes that cut through the center of the spheres, and the region between the spheres are shown in Figure 6. The figure shows that the velocity field varies with distance between the spheres and is less sensitive to the form of the generation of heat was considered. In case of "Flow SC" and "Volumetric SC", the
region of greatest absolute velocity was located in the space between the spheres, as this is a region of narrowing the flow. In cases, "Flow CC" and "Volumetric CC", the region of greatest absolute velocity was located near the contact point and the side of the ball. In all cases, lower absolute velocities were observed at the top of the spheres due to the stagnation of flow. The positive velocities in the lower spheres indicate gas recirculation.
Figure 7 shows the temperature distribution on the surface of the spheres. It can be observed that all cases showed different temperature distributions. Cases with constant flow on the wall showed higher temperatures and gradients present maximum temperature reaching 1911 °C for the case "CC Flow" at the point of contact between spheres and 1215 °C for the case "SC Flow" in the lower ball recirculating flow where there is seen in Figure 6. In cases with volumetric heat generation, observed surface temperatures were lower and the maximum temperatures are located in the lower spheres. The location of the hot spot can be explained by the vortex existing in this region that induces low convective heat exchange with the solid due to fluid stagnation.
Figure 7. Temperature profile at the surface of the spheres.
Figure 8 shows the distribution of heat flow on the surface of the pebbles with fuel cases of volumetric heat generation. The figure shows a distribution of highly variable heat flux at the pebbles surface, which makes it improper to use the prescribed uniform flow on these surfaces. A high rate of heat flow in the spacing between the balls in case "SC Volumetric" was observed due to the high rate of heat exchange by convection in the region. In the "CC Volumetric" the highest and lowest rate of heat flow were located, respectively, just above and just below the point of contact between the spheres. The differences in the distribution of temperature and heat flux at the surface of the spheres showed the need to model the fuel pebbles contact with each other and with volumetric heat generation in the numerical investigations.
Figure 8. Heat distribution on the surfaces of sphere.
3.1. Results of the Second Analysis
Based on the results of the first analysis were generated meshes arrangements CS, CCC and CFC, with the same characteristics of the meshes used in the first analysis
described in section 2.3, considering contact between the spheres and volumetric heat generation in each. The meshes generated in arrangements showed a high number of nodes in the region of contact between spheres, especially for the CFC arrangement, which has the largest number of contacts per sphere. The number of nodes of arrangements CS, CCC and CFC were equal to 2,174,794, 5,924,297 and 14,829,636, respectively. Figure 9 shows the mesh used in the second analysis of this study.
Figure 10 shows the temperature distribution on the surface of the sphere center of each pattern divided by the average surface temperature of the center of the sphere arrangement thereof. The surface temperatures averaged for the ball core CS cases, CCC and CFC were 945.11 °C, 932.60 °C and 918.82 °C respectively.
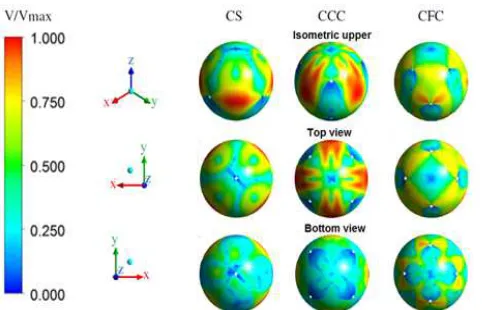
It is possible see in Figure 10 the highest temperatures occur in the region where there is contact between ball and recirculation and low velocity occur. This can be seen when comparing the distribution of the ratio of the friction velocity (τw/ρ)1/2 where τw is the shearing stress on the
wall) and local maximum adjacent the surface of the central sphere of each arrangement shown in Figure 11. The maximum friction velocity was 2.3 m/s, 3.6 m/s and 6.4 m/s for CS arrangements, CFC and CCC, respectively.
Figure 9. Meshes used in the second analysis.
Figure 11. Velocity distribution near the surface of the central sphere for each arrangement.
Temperature variations in the surface relative to the central spheres CS, CCC and CFC cases were 3.22%, 3.48% and 1.32%, respectively. The peak temperatures of the three cases were observed in the region of contact between the fuel pebbles, the largest being the simple cubic arrangement (CS), approximately 2% greater than the average surface temperature. They also observed significant reduction in the variation of temperatures in the arrangement of higher packaging (CFC). The curves in Figure 12 show the same temperature profile on the surface points on the lines defined for φ = 0 ° and φ = 90 °, indicating symmetry in this temperature distribution.
Figure 12. Surface T/Taverage of the central sphere for cases CS, CCC and
CFC in relation to the polar and azimuthal angles.
Figure 13 shows the temperature distributions in the central planes passing through the points of contact of each ball core arrangement evaluated. The temperatures are relative to the mean surface arrangements (Tcs =945.11 °C, Tccc= 932.60 °C and TcFc = 918.82 °C). It can be seen in Fig.
13 greater temperature gradient for the CFC arrangement in which the greatest difference was found between the central surface average temperatures in the center sphere (T/TcFc=1.097).
Figure 13. T/Taverage of the plane that cuts the center of the central sphere
for each arrangement.
Other factors evaluated for the three arrangements were the pressure drop and Nusselt number of the flow on the center sphere. Figure 14 shows the average absolute difference in pressure between the inlet and outlet of the array divided by the length of the model and the average Nusselt number for the flow in function of the central sphere packing factor. In calculating the Nusselt number (Nu = hL/k) it was used the average values around central sphere for the convection coefficient (h) and thermal conductivity (k) for helium, and adopted the radius of the pebble as characteristic length (L). Figure 14 shows a progressive increase of the pressure drop and the average Nusselt number of the central sphere in relation to the packing factor. The arrangement CFC showed an increase in the pressure drop of 1501.33% and 160.45% in the average Nusselt number arrangement in relation to the CS. As for the arrangement CCC was an increase of 369.23% in the pressure drop and 50.45% in average Nusselt number in relation to the arrangement CS. These results show that the gain in heat transfer is much lower than the increased flow resistance with increasing in the packing factor.
Figure 14. Dimensionless pressure loss and average Nusselt number in the central sphere as a function of packing factor.
4. Conclusion
It was performed a numerical investigation of flow and heat transfer between coolant and fuel spheres present in the core of a PBR using the CFD code CFX 13.0 [6]. The study was divided into two analyzes.
conduction in the fuel and in the cladding. In another model was prescribed heat flux at the surface of the spheres. In this analysis, simulations were performed in two arrays of spheres, one arrangement with contact between the spheres and the other assuming a spacing of 2 mm between them. Simulations with volumetric heat generation in the fuel and heat flux on the surface of the spheres, both in cases with spacing between the spheres as in cases of contact between them, significant differences in flow and temperature profiles and maximum surface coating. These preliminary assessments showed that the assumption of uniform heat flux on the surface of the pebbles as well as the presence of non-contact between the spheres in the simulations of the flow in the pebble bed reactor PBR may lead to unreliable results.
In the second analysis evaluated the influence of the arrangement of spheres and its degree of compaction in thermal and fluid dynamic behavior of the pebble bed fuel. The arrangement of pebbles fuel was simplified by the simple cubic crystal structures (CS), body-centered cubic (CCC) and face-centered cubic (CFC). It was analyzed the distribution of surface temperature of the central sphere, the average Nusselt number of the flow over the sphere and the central dimensionless pressure drop depending on the packing factor. It was observed that the arrangement CFC has the best thermal performance Also presented an average Nusselt number higher and an homogeneous surface temperature upper. However had the worst performance in terms of pressure loss as a function of the length. The results showed small surface temperature inhomogeneity in all arrangements, with peaks in the regions of the contacts. The largest of these temperature peaks was obtained in the arrangement of weak packaging (CS) value ~ 2% higher than the average temperature of the surface of the sphere
Acknowledgements
The following Brazilian institutions support this research project: Nuclear Technology Development Centre (CDTN), Brazilian Nuclear Energy Commission (CNEN), Research Support Foundation of the State of Minas Gerais (FAPEMIG), and Brazilian Council for Scientific and Technological Development (CNPq).
References
[1] Lohnert, G., “Technical design features and essential safety-related properties of the HTR-module”, Nuclear Engineering and Design. 121. 1990.
[2] Lohnert, G., and Reutler, H. “The modular HTR-a new design of high temperature pebble bed reactor”. J. Br. Nuclear
Energy Soc. 22 June (3). 197. 1983.
[3] Hassan, Y.A. “Large eddy simulation in pebble bed gas cooled core reactors”. Nuclear Engineering and Design, V. 238, I. 3, March 2008, p. 530-537. DOI: http://dx.doi.org/10.1016/j.nucengdes.2007.02.041.
[4] Hore-Lacy, I., Nuclear Energy in the 21st Century. 2nd Edition, Word Nuclear University, London, 2011.
[5] Duarte, J.P., Oliva, J.J.R. and Melo, P.F.F.F. “Generation IV Nuclear Systems: State of the Art and Current Trends with Emphasis on Safety and Security Features”. In: Current Research in Nuclear Reactor Technology in Brazil and Worldwide, Prof. Amir Mesquita (Ed.), InTech, Croatia. 2013. DOI: 10.5772/53140.
[6] ANSYS, “CFX-13.0 User Manuals”, ANSYS, 2010.
[7] Ben-Gurion University of the Negev. Available at <http://web.bgu.ac.il/Eng/engn/nuclear/research/NucEnergy/ GCR.htm>. Access in: April 2013.
[7] Lee, J.J., Park,G.C., Kim,K.Y., and Lee,W.J., “Numerical treatment of pebble contact in the flow and heat transfer analysis of a pebble bed reactor core”, Nuclear Engineering and Design, v. 237, p.2138-2196. 2007.
[8] Lee, J.J., Yoon,S.J., Park,G.C., and Lee,W.J., “Turbulence-Induced Heat Transfer in PBMR Core Using LES and RANS”. Journal of Nuclear Science and Technology, v. 44, n. 7, p. 985-996, 2007.
[9] Sobes,V,; Forgetb,B., and Kadakc,A., “Individual pebble temperature peaking factor due to local pebble arrangement in a pebble bed reactor core”. Nuclear Engineering and Design, v. 241, p. 124-133, 2011.
[10] Auwerda, G.J., Kloosterman, J.L., Winkelman, A.J.M., Groen, J. and van Dijk, V., “Comparison of Experiments and Calculation of Void Fraction Distributions in Randomly Stacked Pebble Beds”, PHYSOR 2010 – Advances in Reactor Physics to Power the Nuclear Renaissance. 2010.
[11] Matzner,H.D., ”PBMR project status and the way ahead”. 2nd International Topical Meeting on High Temperature Reactor Technology, Beijing, China, September. 2004.
[12] Tak, N.I., Kim,Y.W., Choi, J.H., and Lee, W. J., “Termo-fluid investigation on a double- side-cooled annular fuel for the prismatic very high temperature gas-cooled reactor”, Nuclear Engineering and Design, v. 238, p. 2821-2827, 2008.
[13] NIST, “Thermophysical properties of fluid systems”, National Institute of Standards and Technology - NIST, http://webbook.nist.gov/chemistry/fluid/, 2013.
[14] Costa, F.C., Navarro, M.A., and Santos, A.A.C. “Numerical Investigation of Flow in Bed Pebbles Gas Cooled High Temperature Reactors”. In: International Nuclear Atlantic Conference - INAC. Belo Horizonte (in Portuguese). 2011.
![Figure 2. The TRISO sphere and the pebble fuel [7].](https://thumb-us.123doks.com/thumbv2/123dok_us/8488174.1715785/2.595.63.295.319.583/figure-the-triso-sphere-and-the-pebble-fuel.webp)