http://www.sciencepublishinggroup.com/j/ijmsa doi: 10.11648/j.ijmsa.20190801.12
ISSN: 2327-2635 (Print); ISSN: 2327-2643 (Online)
Dielectric and Ferroelectric Properties of Ho
2
O
3
Doped
Barium Strontium Titanate Ceramics
Mengyuan Zhang, Congyu Li, Fangxu Chen, Long Chen, Jianhua Liu, Tianyu Chen, Chen Zhang
*Department of Materials Science and Engineering, Jiangsu University of Science and Technology, Zhenjiang, China
Email address:
*
Corresponding author
To cite this article:
Mengyuan Zhang, Congyu Li, Fangxu Chen, Long Chen, Jianhua Liu, Tianyu Chen, Chen Zhang. Dielectric and Ferroelectric Properties of Ho2O3 Doped Barium Strontium Titanate Ceramics. International Journal of Materials Science and Applications.
Vol. 8, No. 1, 2019, pp. 12-20. doi: 10.11648/j.ijmsa.20190801.12
Received: July 16, 2018; Accepted: August 2, 2018; Published: June 26, 2019
Abstract:
The crystalline structure, surface morphology, dielectric and ferroelectric properties of 0~10wt% Ho2O3 doped(Ba0.75Sr0.25) TiO3 ceramics prepared by conventional solid state method were studied using X-ray diffractometer, scanning
electron microscopy, LCR measuring system and ferroelectric property test systems aiming for ceramic capacitor applications. It is found that proper amount of Ho2O3 can refine grains of the system. With the increase of Ho2O3 doping content, the average
grain size of (Ba0.75Sr0.25) TiO3 ceramics decreases. When Ho2O3>8 wt%, (Ba0.75Sr0.25) TiO3 based ceramic samples are
multi-phase compounds with typical perovskite structure accompanied by the appearance of cylindrical grains. The Ho3+ ions substitute the host A sites and B sites of (Ba0.75Sr0.25) TiO3 perovskite lattice, resulting in the lattice distortion of the system and
the change of the relative dielectric constant and dielectric loss at room temperature. With the increase of Ho2O3 doping content,
the relative dielectric constant at room temperature of the system increases first and then decreases. The maximum of relative dielectric constant at room temperature can be found in the 1 wt% Ho2O3 doped (Ba0.75Sr0.25) TiO3 ceramics. When Ho2O3>1
wt%, the maximum of relative dielectric constant εrmax decreases and the temperature corresponding to the maximum of relative
dielectric constant Tm shifts toward lower temperature with the increase of Ho2O3 doping content. The (Ba0.75Sr0.25) TiO3
ceramics with high Ho2O3content show relaxor-like behavior which is characterized by the typical diffuse phase transition and
frequency dispersion of dielectric constant. However, the (Ba0.75Sr0.25) TiO3 ceramics with low Ho2O3 content do not exhibit
permittivity frequency dispersion. According to the P-E hysteresis loops of Ho2O3 doped (Ba0.75Sr0.25) TiO3 ceramics, the
ferroelectricity was increased and then decreased with the increase of Ho2O3 doping content. With the increase of Ho2O3 doping
content, the P-E relationships turn out to be straight lines, implying the paraelectric phase for (Ba0.75Sr0.25) TiO3 ceramics with
high Ho2O3 content.
Keywords:
Barium Strontium Titanate, Perovskite, Relaxor Characteristic, Ferroelectric Properties1. Introduction
Barium strontium titanate ((Ba1-xSrx) TiO3, BST), as an
infinite solid solution of BaTiO3 and SrTiO3, maintains
perovskite structure (ABO3) similar to BaTiO3, and has
outstanding properties such as high dielectric constant, low dielectric loss and excellent ferroelectric properties [1-2]. In addition, its Curie temperature can be adjusted over a wide range of temperature by changing Ba/Sr ratio, making the BST systems become one of the basic ceramic materials for ceramic capacitors [3].
As an important component of electronic products, ceramic
compensation) [10-11].Three point defect reactions can be identified: '' '' Ti o Ti Ba 2 3
2O +3TiO 4RE +3Ti +12O +V
2RE → • (1) '' Ba o Ti Ba 2 3
2O +3TiO 2RE +3Ti +9O +V
RE → • (2) ' 2 o Ti Ba 2 3
2O +4TiO 4RE +4Ti +12O +O +4e
2RE → • ↑ (3)
When the RE3+ ions enter the B site of the perovskite lattice, charge imbalance is created which must be compensated by the oxygen vacancies [10]. The point defect reaction can be seen as follows:
• • • O O Ba 3
2O 2Ba +2RE +5O +V
RE +
2BaO → Ti (4)
In general, the large size RE3+ ions tend to occupy the A site; The small size RE3+ ions tend to occupy the B site; The middle size RE3+ ions have the amphoteric behavior occupying both A and B site [12]. Y. Li et al. studied on the dielectric properties of Sm2O3 doped Ba0.68Sr0.32TiO3 ceramics, and proposed that
the substitution preference of Sm3+ in the lattice also depends on Sm2O3 doping content [13]. C. Zhao et al. prepared Y2O3
and Dy2O3 doped Ba0.7Sr0.3TiO3 ceramics with comprehensive
properties (ɛr=3.66×10³, tanδ=9.3×10⁻³, ∆ɛr/ɛr=14.1%) [14].
In addition, some researchers studied the effect of grain size on dielectric and ferroelectric properties of Ba0.80Sr0.20TiO3
ceramics [15-16].
In our present work, 0~10 wt% Ho2O3 doped (Ba0.75Sr0.25)
TiO3 ceramics were prepared by solid state reaction method.
The effects of Ho2O3 doping content on crystalline structure,
surface morphology, dielectric and ferroelectric properties of the system were investigated. The substitution characteristics of Ho3+ ionsin (Ba0.75Sr0.25) TiO3 perovskite lattice will be
determined and the interrelationship between the macroscopic dielectric constant, dielectric loss, temperature-dependent properties and microscopic defect behavior will also be established.
2. Experimental
2.1. Sample Preparation
In this paper, high purity BaCO3 (>99.0%), SrCO3 (>99.0%)
and TiO2 (>98.0%) powders used as starting raw materials
were proportionally weighed according to the formula (Ba0.75Sr0.25) TiO3 and ball-milled for 24 h. After drying, the
obtained powders were calcined at 1080°C for 2 h to form main crystalline phase. The calcined powders were mixed with 0.2 wt% MgO (≥98.5%)、0.2 wt% ZnO (≥99.0%) and
0~10 wt% Ho2O3(>99.0%), reground for 24 h, dried and
added with 5 wt% polyvinyl alcohol (PVA) as a binder for granulation. The mixtures were sieved through 40-mesh screen and then pressed into pellets 10mm in diameter and 2~3 mm in thickness. Sintering was conducted in air at 1400°C for 2 h, and the sintering regime was illustrated on Figure 1. For dielectric properties measurement, both the flat
surfaces of the sintered samples were coated with BQ-5311 silver paste after ultrasonic bath cleaning and then fired at 800°C for 10 min.
Figure 1. Sintering regime for the samples.
2.2. Equipment and Characterization
The crystal structures of the samples were confirmed by X-ray diffraction analysis (XRD, Rigaku D/max 2500v/pc) with Cu Kα radiation; The phase and plane index (hkl) were obtained by search/match using Jade 6.0. The surface morphologies of the gold-sprayed ceramic samples were observed using the SEM (JSM-6480 ESEM). The capacitance quantity (C) and dissipation factor (D) were measured with TZDM-200-300B testing system. The relative dielectric constant (εr) and dielectric loss (tanδ) were calculated by the
following Equations:
2 14.4
Φ Ch
εr = (5)
D δ =
tan (6) where C is the capacitance quantity (pF); h is the thickness (cm); Φ is the diameter of the electrode (cm); D is the dissipation factor. The temperature dependence of dielectric parameters was measured at 1~100 kHz from −150 to 150°C. The P-E hysteresis loops of Ho2O3 doped (Ba0.75Sr0.25) TiO3
ceramics at room temperature was obtained using the ferroelectric property test system.
3. Results and Discussion
3.1. XRD Analysis
The XRD patterns of Ho2O3 doped (Ba0.75Sr0.25) TiO3
ceramics are shown in Figure 2. It appears that all samples are single phase solid solutions with typical perovskite structure. No obvious secondary phase is found even for the 10 wt% Ho2O3 doped (Ba0.75Sr0.25) TiO3 ceramics based on the XRD
Figure 2. XRD patterns of Ho2O3 doped (Ba0.75Sr0.25) TiO3 ceramics.
3.2. SEM Analysis
Figure 3 shows the SEM images of Ho2O3 doped
(Ba0.75Sr0.25) TiO3 ceramics. It appears that all samples
exhibit dense microstructures and possess uniform grain size. With the increase of Ho2O3 doping content, the average grain
size of (Ba0.75Sr0.25) TiO3 ceramics decreases. The reason is
that Ho3+ ions are easily segregated near the grain boundary, which hinders the further grain growth [17].However, the cylindrical grains indicating the appearance of secondary phase (marked using red circles in Figure 3 (g) and (h)) which is not detected by XRD due to its small amount exist in the 9 and 10 wt% Ho2O3 doped (Ba0.75Sr0.25) TiO3 ceramics.
Figure 3. SEM images of Ho2O3 doped (Ba0.75Sr0.25) TiO3 ceramics: (a) Ho2O3=0 wt%; (b) Ho2O3=1 wt%; (c) Ho2O3=3 wt%; (d) Ho2O3=5 wt%; (e) Ho2O3=7
wt%; (f) Ho2O3=8 wt%; (g) Ho2O3=9 wt%; (h) Ho2O3=10 wt%.
3.3. Dielectric Properties at Room Temperature
In the ABO3 type perovskite structure, the coordination
numbers of A and B site are 12 and 6, respectively. The radius of Ho3+ ion (1.23 Å, in 12 coordination) is smaller than that of
Ba2+ ion (1.61 Å, in 12 coordination) and Sr2+ ion (1.44 Å, in 12 coordination); The radius of Ho3+ ion (0.90 Å, in 6 coordination) is bigger than that of Ti4+ ion (0.61 Å, in 6 coordination) [18]. Therefore, Ho3+ ion can substitute the A or B site of (Ba0.75Sr0.25) TiO3 perovskite lattice. When Ho
3+
substitutes the A site, the point defect reaction is as follows:
' 2 o Ti 2
3
2O +4TiO 4Ho +4Ti +12O +O +4e
2Ho
Ba
↑
→ • (7)
When Ho3+ ion begins to substitute the B site, the point defect reaction can be expressed as follows:
• • •
O O Ba
3
2O 2Ba +2Ho +5O +V
Ho +
2BaO → Ti (8)
Figure 4 shows the relative dielectric constant and dielectric loss of (Ba0.75Sr0.25) TiO3 ceramics at room temperature with
variation of Ho2O3 content. It is obvious that all ceramics
possess high relative dielectric constant (εr≥1.69×10³) and low
dielectric loss (tanδ≤6.4×10⁻³) at room temperature. With the increase of Ho2O3 doping content, the relative dielectric
constant of the system increases first and then decreases. The maximum of relative dielectric constant at room temperature can be found in the 1 wt% Ho2O3 doped (Ba0.75Sr0.25) TiO3
ceramics. The dielectric loss of the system increases first, then decreases, and finally increases with the increase of Ho2O3
doping content.
Figure 4. εr and tanδ of Ho2O3 doped (Ba0.75Sr0.25) TiO3 ceramics at room temperature.
When Ho2O3≤1 wt%, Ho3+ ions tend to substitute the A
site ions of the perovskite lattice. The difference of the ionic radius causes the shrinkage deformation of the perovskite unit cells and the increase of the internal stress which result in the increase of relative dielectric constant [19]. When Ho2O3=1~8 wt%, Ho3+ ions gradually enter the
B site. The bigger Ho3+ ions in the B site restrict the activity of B site ions and thus weaken the spontaneous polarization, which causes the relative dielectric constant decrease significantly with the increase of Ho2O3 doping content.
When Ho2O3>8 wt%, non-ferroelectric secondary phase
induced by the excessive Ho2O3 addition dilutes the
ferroelectric phase, which makes the relative dielectric constant further decrease with the increase of Ho2O3 doping
content [20].
As for the dielectric loss, When Ho3+ ions enter the A site of the perovskite lattice, the electrons as shown in Equation (7) are trapped by Ti4+ to form Ti3+, leading to the increase of the dielectric loss gradually [21]. When Ho2O3=1~5 wt%, the
weakened spontaneous polarization results in the decrease of
the dielectric loss significantly with the increase of Ho2O3
doping content. On the other hand, the oxygen vacancies as shown in Equation (8) have pinning effect on the ferroelectric domains, which also causes the decrease of dielectric loss [22-24].
3.4. Temperature Dependence of the Relative Dielectric Constant and Dielectric Loss at Various Frequencies
Figure 5 shows the temperature dependence of the relative dielectric constant and dielectric loss at 1kHz~100kHz for Ho2O3 doped (Ba0.75Sr0.25) TiO3 ceramics. When Ho2O3
content is higher than 5 wt%, the temperature corresponding to the maximum of relative dielectric constant (Tm) for
(Ba0.75Sr0.25) TiO3 ceramics shifts toward higher temperature
obviously and the relative dielectric constant (in the T<Tm
range) decreases with the increase of test frequency, which is known as the frequency dispersion [25]. However, as indicated in Figure 5 (a)~(d), the (Ba0.75Sr0.25) TiO3 ceramics
dispersion. As shown in Figure 5 (c)~(h), the tanδ increases significantly with the increase of test frequency at low temperature; the tanδ is almost unaffected by the test frequency at high temperature, and the tanδ remains at a low
value over a wide temperature range (room temperature~150°C), indicating that Ho2O3 doped (Ba0.75Sr0.25)
TiO3 ceramics are promising for the application in capacitors
Figure 5. Temperature dependence of the relative dielectric constant and dielectric loss of Ho2O3 doped (Ba0.75Sr0.25) TiO3 ceramics: (a) Ho2O3=0 wt%; (b)
Ho2O3=1 wt%; (c) Ho2O3=3 wt%; (d) Ho2O3=5 wt%; (e) Ho2O3=7 wt%; (f) Ho2O3=8 wt%; (g) Ho2O3=9 wt%; (h) Ho2O3=10 wt%.
The maximum of relative dielectric constant (εrmax) and the
temperature corresponding to this maximum (Tm) of
(Ba0.75Sr0.25) TiO3 ceramics with variation of Ho2O3 content
are shown in Figure 6. When Ho2O3>1 wt%, the Tm shifts
toward lower temperature and the εrmax decreases with the
increase of Ho2O3 doping content. The local deformation
caused by Ho2O3 doping gives rise to the reduction of Tm. On
the other hand, the non-ferroelectric layer in grain boundary of ferroelectric ceramics makes the ferroelectricity decrease, which causes Tm and εrmax decrease. As mentioned previously,
the average grain size of Ho2O3 doped (Ba0.75Sr0.25) TiO3
ceramics decreases with the increase of Ho2O3 doping content,
which means that the grain boundary effect [26] is enhanced with the increase of Ho2O3 doping content and consequently
makes the Tm and εrmax decrease.
Since the diffuse phase transition is generally characterized by broadening in the dielectric constant (ε) versus temperature (T) curve, the full-width of half-maximum (FWHW) of εr-T curve is here calculated and listed in Table 1.
It is notable that the FWHW increases from 31°C to 222.8°C when Ho2O3 content increases from 1wt% to 10wt%. In other
words, the Curie peaks of high Ho2O3 concentration ceramics
are more diffused and broadened than that of low Ho2O3
concentration ones. Since the typical diffuse phase transition and frequency dispersion of dielectric constant occurred in the (Ba0.75Sr0.25) TiO3 ceramics with high Ho2O3 content, it can be
concluded that with the increase of Ho2O3 doping content,
(Ba0.75Sr0.25) TiO3 ceramics are transformed into a relaxor-like
ferroelectrics.
Table 1. The FWHW of Ho2O3 doped (Ba0.75Sr0.25) TiO3 ceramics.
W (Ho2O3)/% 0 1 3 5 7 8 9 10
FWHW/°C 41.1 31 56.1 65.9 159 166.9 197.8 222.8
3.5. Ferroelectric Properties
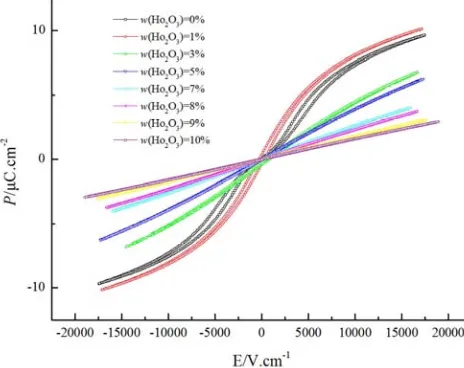
Figure 7 shows the P-E hysteresis loops of (Ba0.75Sr0.25)
TiO3 ceramics with different Ho2O3 doping content measured
at room temperature. The typical P-E hysteresis loops can be found for undoped and 1 wt% Ho2O3 doped (Ba0.75Sr0.25) TiO3
ceramics. Especially, compared with the undoped (Ba0.75Sr0.25)
TiO3 ceramics, the ferroelectricity of the 1 wt% Ho2O3 doped
(Ba0.75Sr0.25) TiO3 ceramics is enhanced, which exactly
explains that the εrmax of the 1 wt% Ho2O3 doped (Ba0.75Sr0.25)
TiO3 ceramics achieve the maximum as shown in Figure 6.
With the increase of Ho2O3 doping content, the P-E
relationships turn out to be straight lines, implying the paraelectric phase for (Ba0.75Sr0.25) TiO3 ceramics with high
Ho2O3 content.
Figure 7. P-E hysteresis loops of Ho2O3 doped (Ba0.75Sr0.25) TiO3 ceramics.
4. Conclusions
The Ho2O3 doped (Ba0.75Sr0.25) TiO3 ceramics were
prepared by solid state reaction method and their crystalline structure, surface morphology, dielectric and ferroelectric properties were investigated. The results show that:
(1) The proper Ho2O3 doping content is beneficial to
obtaining fine grain structure. When Ho2O3>8 wt%,
ceramic samples are multi-phase compounds with typical perovskite structure.
(2) Ho3+ ions enter the A and B site of perovskite lattice, causing lattice distortion of the system and affecting
the relative dielectric constant and dielectric loss at room temperature. In addition, the electrons and oxygen vacancies produced in the substitution process also have a certain effect on the dielectric loss. (3) The diffuse phase transition and frequency dispersion
of dielectric constant reveal a relaxor characteristic of high Ho2O3 doped (Ba0.75Sr0.25) TiO3 ceramics.
(4) According to the P-E hysteresis loops, the ferroelectricity is increased and then decreased with the increase of Ho2O3 doping content.
Acknowledgements
This work is supported by the Priority Academic Program Development of Jiangsu Higher Education Institutions and also sponsored by Suzhou Pant Piezoelectric Tech. Co. Ltd, China.
References
[1] A. Kaura, L. Singha, K. Asokan, Electrical relaxation and conduction mechanisms in iron doped barium strontium titanate, Ceramics International, (2007), doi: 10.1016/j.ceramint.2017.11.158.
[2] A. Kaur, A. Singh, L. Singh, S. K. Mishra, P. D. Babu, K. Asokan, S. Kumar, C. L. Chen, K. S. Yang, D. H. Wei, Structural, magnetic and electronic properties of iron doped barium strontium titanate, RSC Adv., 6 (2016) 112363–112369, doi: 10.1039/C6RA21458D.
[3] A. Ioachim, M. I. Toacsan, M. G. Banciu, L. Nedelcu, A. Dutu, S. Antohe, C. Berbecaru, L. Georgescu, G. Stoica, H. V. Alexandru, Transitions of barium strontium titanate ferroelectric ceramics for different strontium content, Thin solid Films, 515 (2007) 6289–6293, doi: 10.1016/j.tsf.2006.11.097.
[4] M. Paredes-Olguıín, I. A. Lira-Hernández, C. Gó mez-Yáñez, F. P. Espino-Cortés, Compensation mechanisms at high temperature in Y-doped BaTiO3, Physica B, 410 (2013)
157-161, doi: 10.1016/j.physb.2012.11.001.
[5] Y. Tsur, A. Hitomi, I. Scrymgeour, C. A. Randall, Site occupancy of rare-earth cations in BaTiO3, Japanese Journal of
Applied Physics, 40 (2001), doi: 10.1143/jjap.40.255. [6] D. Y. Lu, M. Sugano, M. Toda, High-permittivity double rare
[7] D. Kim, J. Kim, T. Noh, J. Ryu, Y. N. Kim, H. Lee, Dielectric properties and temperature stability of BaTiO3 co-doped La2O3
and Tm2O3, Curr. Appl. Phys., 12 (2012) 952–956, doi:
10.1016/j.cap.2011.12.016.
[8] L. Li, M. Wang, D. Guo, R. Fu, Q. Meng, Effect of Gd amphoteric substitution on structure and dielectric properties of BaTiO3-based ceramics, J Electroceram, 30 (2013) 129-132,
doi: 10.1007/s10832-012-9773-9.
[9] M. Borah, D. Mohanta, Effect of Gd3+ doping on structural, optical and frequency-dependent dielectric response properties of pseudo-cubic BaTiO3 nanostructures, Appl. Phys. A, 115
(2014) 1057–1067, doi: 10.1007/s00339-013-7941-7. [10] N. Masó, H. Beltrán, E. Cordoncillo, D. C. Sinclair, A. R. West,
Polymorphism and dielectric properties of Nb-doped BaTiO3. J.
Am. Ceram. Soc., 91 (2008) 144-150, doi: 10.1111/j.1551-2916.2007.02083.x.
[11] F. D. Morrison, A. M. Coats, D. C. Sinclair, A. R. West, Charge compensation mechanisms in La doped BaTiO3, Journal of
Electroceramics, 6 (2001) 219-232, doi: 10.1023/a:1011400630449.
[12] D. Y. Lu, Study on the modification of barium titanate ceramic structure by lanthanide ions in the field of dielectric, Journal of jilin institute of chemical technology, 25 (2008) 34-41, doi: 10.16039/j.cnki.cn22-1249.2008.01.006.
[13] Y. L. Li, Y. F. Qu, Dielectric properties and substitution mechanism of samarium-doped Ba0.68Sr0.32TiO3 ceramics,
Materials Research Bulletin, 44 (2009) 82-85, doi: 10.1016/j.materresbull.2008.03.030.
[14] C. Zhao, X. Y. Huang, H. Guan, C. H. Gao, Effect of Y2O3 and
Dy2O3 on dielectric properties of Ba0.7Sr0.3TiO3 series capacitor
ceramics, Journal of Rare Earths, 25 (2007) 197-200, doi: 10.1016/S1002-0721 (07) 60468-2.
[15] W. Yang, A. M. Chang, B. C. Yang, Effect of grain size on dielectric and ferroelectric Properties of Ba0.80Sr0.20TiO3
ceramics, Journal of the Chinese Ceramic Society, 3 (2002) 390-397, doi: 10.3321/j.issn:0454-5648.2002.03.024.
[16] Z. Li, P. Zhao, X. H. Xue, Z. T. Li, Z. Wang, L. Xu,H. Q. Fan, Structure and Electrical Properties of Bal-xSrxTiO3 Ceramics
with Various Sintering Processes, Materials Review, 30 (2016) 55-59, doi: 10.11896/j.issn.1005-023X.2016.16.012.
[17] Y. P. Pu, S. F. Ning, W. Chen, Influence of Dy2O3 doping on the
structure and properties of BaTiO3 ceramics, Journal of Xi'an
Jiao Tong University, 38 (2004) 424-427, doi: 10.3321/j.issn:0253-987X.2004.04.024.
[18] F. Zhou, G. F. Liu, J. B. Wang, J. Li, X. B. Cao, Influence of doping on dielectric properties of barium strontium titanate ceramics, Insulating material, 42 (2009) 46-48, doi: 10.16790/j.cnki.1009-9239.im.2009.03.011.
[19] C. Zhang, Y. F. Qu, Dielectric properties and phase transitions of La2O3 and Sb2O3 doped barium strontium titanate ceramics,
Trans. Nonferrous Met. Soc. China, 22 (2012) 2742-2748, doi: 10.1016/S1003-6326 (11) 61527-6.
[20] X. Y. Huang, R. K. XING, S. J. Guo, Influence of Nd2O3
content on the low temperature sintering of BST ceramic. Electronic Components and Materials, 33 (2014) 10-16, doi: 10.14106/j.cnki.1001-2028.2014.12.003.
[21] W. Li, J. Qi, Y. Wang, L. Li, Z. Gui, Doping behaviors of Nb2O5
and Co2O3 in temperature stable BaTiO3 ceramics, Materials
Letters, 57 (2002) 1-5, doi: 10.1016/S0167-577X (02) 00687-0.
[22] B. Su, T. W. Button, Microstructure and dielectric properties of Mg-doped barium strontium titanate ceramics, Journal of Applied Physics, 95 (2004) 1382-1385, doi: 10.1063/1.1636263.
[23] Y. Li, R. Wang, X. Ma, Z. Li, R. Sang, Y. Qu, Dielectric behavior of samarium doped BaZr0.2Ti0.8O3 ceramics, Materials
Research Bulletin, 49 (2014) 601-607, doi: 10.1016/j.materresbull.2013.10.001.
[24] C. Zhang, Z. X. Ling, G. Jian, F. X. Chen, Dielectric properties and point defect behavior of antimony oxide doped Ti deficient barium strontium titanate ceramics, Trans. Nonferrous Met. Soc. China, 27 (2017) 2656-2662, doi: 10.1016/S1003-6326 (17) 60294-2.
[25] K. Wang, A. Hussain, W. Jo, J. Rodel, Temperature-dependent properties of (Bi1/2Na1/2) TiO3- (Bi1/2K1/2) TiO3- SrTiO3
lead-free piezoceramics, J. Am. Ceram. Soc., 95 (2012) 2241-2247, doi: 10.1111/j.1551-2916.2012.05162.x.
[26] C. Zhang, Z. X. Ling, G. Jian, The defect chemistry and dielectric properties of Sb2O3 doped non- stoichiometric