http://www.sciencepublishinggroup.com/j/ajim doi: 10.11648/j.ajim.20180606.14
ISSN: 2330-4316 (Print); ISSN: 2330-4324 (Online)
Prediction of Post-Tuberculosis Lung Function Impairment
Eric Walter Pefura-Yone
1, 2, *, Adamou Dodo Balkissou
3, Amadou Djenabou
4,
Virginie Poka-Mayap
2, Boniface Moifo
5, Marie-Chantal Madjoumessi
6, Brenda Tanyi
7,
Christopher Kuaban
8, André Pascal Kengne
91Department of Internal medicine, Faculty of Medicine and Biomedical Sciences, The University of Yaounde 1, Yaounde, Cameroon 2
Pneumology A Service, Yaounde Jamot Hospital, Yaounde, Cameroon
3
Faculty of Medicine and Biomedical Sciences of Garoua, University of Ngaoundéré, Garoua, Cameroon
4Approved Treatment Center for HIV, Yaounde Jamot Hospital, Yaounde, Cameroon 5
Department of Radiology and Medical Imaging, Faculty of Medicine and Biomedical Sciences, The University of Yaounde 1, Yaounde, Cameroon
6
Institut Supérieur de Technologie Médicale, Yaounde, Cameroon
7Faculty of Medicine and Biomedical Sciences, The University of Yaounde 1, Yaounde, Cameroon 8
Faculty of Health Sciences, University of Bamenda, Bambili, Cameroon
9
Medical Research Council, Cape Town, South Africa
Email address:
*
Corresponding author
To cite this article:
Eric Walter Pefura-Yone, Adamou Dodo Balkissou, Amadou Djenabou, Virginie Poka-Mayap, Boniface Moifo, Marie-Chantal Madjoumessi, Brenda Tanyi, Christopher Kuaban, André Pascal Kengne. Prediction of Post-Tuberculosis Lung Function Impairment. American Journal of Internal Medicine. Vol. 6, No. 6, 2018, pp. 170-181. doi: 10.11648/j.ajim.20180606.14
Received: December 9, 2018; Accepted: December 25, 2018; Published: January 18, 2019
Abstract:
Objective: The aim of this study was to establish prediction equations for post-tuberculosis residual lung function in patients successfully treated for pulmonary tuberculosis (PTB). Methods: This study took place at the Yaounde Jamot Hospital of Yaounde (YJH) and used data from three cross-sectional studies conducted from January to July 2015 (7 months), December 2015 to May 2016 (6 months) and from January to May 2017 (5 months). Adults successful treated for bacteriologically proven pulmonary TB were included. Spirometric indices including forced expiratory volume in 1s (FEV1), forced vital capacity (FVC) and FEV1/FVC ratio were measured using standard methods. Predicted values were estimated using the reference spirometric equations of the Global Lung Initiative equations (GLI) 2012. General linear models were used to establish prediction equations of post-tuberculous residual lung function. Internal validation of the derived models used the bootstrap resampling procedures. A difference was considered significant if p < 5%. Results: In this study, 400 patients (53.5% men) were included. The median age (25th -75th percentiles) of men was 40 (31-50) years and that of women was 36(27.8-46) years (p=0.002). Determinants of the post-tuberculosis spirometric indices vary according to each indice and include age, weight, height, body mass index, smoking, duration of symptoms before TB treatment, persistent of respiratory symptoms after TB treatment, persistent of cavity lesions and extension of lung sequelae. The prediction equations of the spirometric indices have been established separately for men and women to account for significant differences in the absolute values of spirometric parameters in men and women. The prediction equations of residual lung function parameters were in the form: lung function parameters = Intercept + β1*P1 + β2*P2 +…βn*Pn; βn is regression coefficient for corresponding predictor (Pn), for categoricalvariables Pn is 1 if the modality is present and 0 if the modality is absent. For each of the spirometric variable, differences in
Keywords:
Tuberculosis, Residual Lung Function, Spirometry, Sequelae, Obstructive Lung Disease, Restrictive Pattern1. Introduction
Tuberculosis (TB) remains a major public health problem in spite of existing prevention and control strategies [1]. The most recent World Health Organization (WHO) 2018 global TB report estimated a total of 10 million new (incident) TB cases worldwide in 2017, with a death toll of 1.6 million people [2]. In Cameroon, 24905 TB cases including 83% of pulmonary TB (PTB) were notified in 2017 [3].
Even after a well conducted treatment, pulmonary tuberculosis (PTB) leaves parenchymal sequelae of variable degrees due to its fibrogenic nature [4–6]. A chest X-Ray (CXR) is the most used exam in the detection of pulmonary sequelae in PTB. The prevalence of CXR sequelae at the end of a TB treatment is elevated, varying between 66.2% and 88% [6, 7]. These sequelae are dominated by interstitial infiltrates, residual cavities and fibro-nodular opacities [4, 5, 8]. These sequelae can have a permanent repercussion on lung function, altering the quality of life of patients. Lung function impairment observed in sequelae phase are variable, with certain authors reporting a predominance of obstructive disorders [7, 9, 10]; and others, a predominance of restrictive disorders [11] or mixed disorders [6].
Some risk factors for post-tuberculosis lung function impairment (PTB-LFI) have been reported and include radiographic extension of lesions [12, 13], age [14] and duration of symptoms prior to TB treatment [10]. However, to our knowledge, there is no specific study carried out, aiming to predict post-tuberculosis spirometric parameters. This prediction could be used to select patients with a high probability of impaired lung function and requiring pulmonary function tests (PFT) as a priority. This should be particularly relevant in resource-limited settings where there is an inadequacy between the incidence of TB and the resources allocated for the management of patients with the condition.
2. Methods
2.1. Setting and Participants
This study used data from three cross-sectional studies conducted from January to July 2015 (7 months), from December 2015 to May 2016 (6 months) and from January to May 2017 (5 months). The study took place at the Yaounde Jamot Hospital (YJH). YJH is the reference center for the management of TB and respiratory diseases for Yaounde (capital city of Cameroon) and its surroundings. The management of TB in this center is based on the international recommendations [15].
The data used in the above studies were collected using non probabilistic, consecutive and exhaustive sampling method during the specified period. Using Austin and Steyerberg rules for a minimum subjects per variables in
linear regression analysis, the minimum of subjects to be included is 180 in each group, considering a maximum of 6 predictors per dependent variables and 10 subjects for each independent variable [16].
The adults’ patients successfully treated for bacteriologically proven pulmonary TB at the Diagnosis and Treatment Center (DTC) of YJH were included. Patients with the following criteria were excluded: comorbidities (respiratory infection, chronic obstructive airway disease, asthma, interstitial lung disease, lung cancer and lung resection, congestive heart failure); contraindications to PFT (recent myocardial infarction, pneumothorax, pregnancy at third trimester, recent thoracic or abdominal surgery, a seriously altered general state or severe dyspnea limiting the correct execution of the spirometry maneuvers); inappropriate spirometry maneuvers. Ethical clearances were obtained from the Institutional Ethics Committee of the Faculty of Medicine and Biomedical Sciences of the University of Yaounde I (Data collected from January to July 2015, and from January to May 2017) and from Institutional Ethics Committee of Faculty of Medicine and Pharmaceutical Sciences of University of Douala (Data collected from December 2015 to May 2016). A research authorization was equally obtained from the administrative authorities of the YJH.
2.2. Data Collection
2.2.1. Baseline Data
The following social and demographic data were collected: age, sex, marital status, place of residence (urban, semi-urban and rural), higher level of formal education. Past medical history and lifestyles included HIV status; history of respiratory diseases such as pneumonia, PTB; other comorbidities influencing the respiratory function: diabetes mellitus and heart failure; tobacco smoking was evaluated in packets/years. Categories of tobacco smoking were: former smokers (stopped smoking for more than 6 months at least), never-smokers; active smokers; concerning alcohol consumption, patients having stopped drinking for at least 12 months were considered former drinkers, occasional drinkers (alcohol use less than a day/week), regular drinkers and non-drinkers were also distinguished; exposure to biomass, evaluated by the type of fuel or combustible used to cook food in household.
heels joined together and arms along the body. Body mass index in kg/m2 was calculated as the ratio of weight (kg) to height squared (squared meter).
Standard full-size postero-anterior chest X-ray (CXR) was used to quantify the extent of lung remodeling in patients. The nature, distribution, and extent of abnormalities were noted for initial and final CXR. Type of lesions collected include: cavities, infiltrates, nodules, fibrotic lesions, miliary lesions, patchy or confluent consolidation and associated pleural effusion. Extension of radiographic lesions was appreciated by using total percentage of lung affected by any pathology on the initial and final chest X-ray (at the end of treatment). To grade the percentage of affected lung, visual estimation of the extent of opacification, cavitation or other pathology as a percentage of visible lungs was made. To evaluate this, each lung field was subdivided into three zones (upper, middle and lower zone) according to the method employed by Ralph et al [18]. The delimitation was done by two horizontal lines: the first is the horizontal line passing through the upper border of the chondro-costal junction of the anterior arch of the second rib to the lateral thoracic wall; the second is the horizontal line passing through the upper border of the chondro-costal junction of the anterior arch of the 4th rib to the lateral thoracic wall. Dense opacification of an entire zone was graded as 100% of that zone, while patchy consolidation within a zone attracted scores <100% depending on the extent of consolidation. An average percentage of lesions per lung field was then evaluated and an average of the two lung fields deduced to determine the total percentage of affected lung (% of pulmonary tuberculosis lung sequelae).
2.2.2. Spirometric Data
Spirometry was performed on eligible participants as per standard [19], using a turbine pneumotachograph (spiro USB, care fusion, Yorba Linda-USA), thereby respecting the American Thoracic Society (ATS) 1994 standards. The exam was done by pulmonary function test (PFT) technicians or by well-trained final year medical student.
All measurements were performed after at least 15 min rest, with the participant in a seated position, the back straight up, and nose clipped to allow air flow only by mouth. The American Thoracic Society/European Respiratory Society (ATS/ERS) acceptability and reproducibility criteria were applied [19]. Instructions were explained before every maneuver; at least three tests were done per participant with the maximum being eight tests, while observing a rest period of at least one minute between consecutive tests to establish the forced vital capacity (FVC) curve. Spirometry variables measured included: forced expiratory volume in 1s (FEV1), forced vital capacity (FVC) and the FEV1/FVC ratio.
FEV1 and FVC values retained were the best out of the three tests which fulfilled the acceptability criteria (maximal difference below 5% or 150 ml). All these measurements were expressed in absolute values and as a percentage of the theoretical or predicted value. Predicted or theoretical values were estimated using Global Lung Initiative (GLI) 2012
references value [20]. Quality control was done by regularly supervising investigators who performed spirometry. Spirometric curves were reviewed weekly by one of the experienced chest physicians working in YJH and feedback was made to investigators.
2.3. Data Analysis
The data was analyzed using IBM-SPSS software for Windows version 23 (IBM, Chicago, US). Categorical variables were expressed as counts and proportions. Quantitative variables were summarized in terms of mean (standard deviation) when the distribution was considered normal; otherwise they were expressed in terms of median (25th -75th percentiles). The groups comparison used Chi-2 or Fisher exact test for proportions and Student t-test or non-parametric equivalent for continuous variables (Mann-Whitney U test or median test). Bivariate Pearson’s or Spearman’s correlation tests and matrix graph were used to investigate the shape and significance of the associations of quantitative candidate predictors with each of the spirometric indices (FEV1, FVC, FEV1/FVC ratio, % predicted FEV1 and % predicted FVC). General linear models were used to establish prediction equations of post-tuberculous spirometric parameters.
2.3.1. Prediction Models Development
Significant predictors in bivariate association (p-value<0.10 for the correlation test and for association between categorical variables and spirometric parameters) were entered all together in the same multivariable general linear models and backward elimination procedures were used to retain the most significant predictors in the final model (based on a p-value<0.05). General linear models were used to relate each of the five targeted spirometric variables with potential predictors, separately in men and women.
Candidate continuous predictors included age, weight, height which are all known to be related with the spirometric indices, duration of symptoms and % of lung sequelae. Candidate categorical variables included residency, level of formal education, marital status, smoking, persistent of respiratory symptoms, persistent of cavity lesions. Appropriate procedures were used to check the adequacy of the final models. These procedures included residuals analysis (plots analysis), Cook statistics and multicolinearity detection (inflation factor of variance).
2.3.2. Validation of Prediction Models
interest. The difference in the performance measures of the model on the bootstrap sample and the original population was then recorded and averaged across the 2000 replicates to characterize the optimism. A prediction model would always tend to perform better when it is tested on the same sample used to develop the model (self-fulfilling prophecy), as opposed to when the same model is tested on a new sample. Optimism reflects the drop in the observed models’
performance on the derivation sample that should be expected when the model is tested on a new sample.
On the basis of these prediction equations, it will be possible to know if a given patient has a high probability of presenting a PTB-LFI, by comparing the value of the spirometric parameter found with the prediction equations with the theoretical threshold (LLN or fixed threshold).
3. Results
3.1. Study Population
Figure 1. Flow diagram of participant’s inclusion.
A total of 513 patients were invited to participate in the study. Seventy six patients were excluded for unavailability of lung function testing and 37 patients for unusable spirometry curves. In overall, 400 participants were definitively included in the study. The flow chart of participant’s inclusion is shown on the figure 1.
3.2. Baseline Characteristics of Study Participants
The baseline characteristics of participants are shown in Table 1. In this study, 214 (53.5%) men and 186 (46.5%) women were included. The median age (25th -75th percentiles) of men was 40 (31-50) years and that of women was 36 (27.8-46) years (p=0.002). The majority of participants had reached the secondary school level of education (274 participants, 68.5%). In this study, 100 (25%) participants were active smokers and 70 (17.6%) consumed alcohol regularly. The prevalence of smoking was higher in
Table 1. Demographic and radio-clinical data of participants.
Characteristics Overall N=400 (%) Men N=214 (%) Women N=186 (%) p-value
Age, years 38(29-49) 40(31-50) 36 (27.8-46)
Residency
Urban 314 (78.5) 167 (78) 147 (79) 0.967
Semi-urban 49 (12.3) 20(9.3) 17 (9.1)
Rural 37 (9.3) 27 (12.6) 22 (11.8)
Level of education
No formal education 19 (4.8) 7 (3.3) 12 (6.5) 0.143
Primary 107 (26.8) 51 (23.8) 56 (30.1)
Secondary 198 (49.5) 110 (51.4) 88 (47.3)
University 76 (19) 46 (21.5) 30 (16.1)
Marital Status
Non-unionized 226/398 (56.8) 112 (52.6) 114 (61.6) 0.069
Unionized 172/398 (43.2) 101 (47.4) 71 (38.4)
Smoking
Current 83 (20.8) 75 (35) 8 (4.3) <0.001
Ex-smokers 14 (3.5) 12 (5.6) 2 (1.1)
Non smokers 303 (75.8) 127 (59.3) 176 (94.6)
Biomass exposure 148/397 (37.3) 82/212 (38.7) 66/185 (35.7) 0.537
Alcohol consumption
Regular 70/398 (17.6) 62 (29.1) 8 (4.3) <0.001
Occasional 124/398 (31.2) 71 (33.3) 53 (28.6)
Ex-drinker 87/398 (21.9) 45 (21.1) 42 (22.7)
Non drinker 117/398 (29.4) 35 (16.4) 82 (44.3)
Previous history of TB 36(9) 25(11.7) 11(5.9) 0.044
Past history of pneumonia 5(1.3) 0(0) 5(2.7) 0.021
Duration of respiratory symptoms, weeks, m (25th -75th percentiles) 8(4-16) 8(4-12) 8(4-16) 0.017
Persistent respiratory symptoms 111(27.8) 56(26.2) 55(29.6) 0.449
Weight, kg, m (25th -75th percentiles) 62(56-69.8) 65(59.6-72) 58(54-64) <0.001
Height, cm, m (25th -75th percentiles) 168(163-173.8) 168(164-178) 160(156-167) <0.001
BMI, Kg/m2 , m (25th -75th percentiles) 22 (20.2-24.1) 22.1(20.4-24.1) 220(20.2-24.2) 0.836
HIV infection 141/397 (35.5) 67(31.6) 141(35.5) 0.081
Radiographic sequelae
No sequelae 118 (29.5) 58 (27.1) 60 (32.3) 0.259
Significant pleural thickness 11 (2.8) 8 (3.7) 3 (1.6) 0.195
Fibro-nodular sequelae 212 (53) 118 (55.1) 94 (50.5) 0.358
Persistent cavity lesions 85 (21.3) 46 (21.5) 39 (21) 0.898
Parenchymal destruction 14 (3.5) 8 (3.7) 6 (3.2) 0.781
Extension of pulmonary sequelae, %, m (25th -75th percentiles) 5 (0.8-15.8) 5.81 (1-16.2) 5 (0.7-15.3) 0.306
TB, tuberculosis; m, median; BMI, body mass index; HIV, human immunodeficiency virus; PA, pack-years; BMI, body mass index; HIV, human immunodeficiency virus.
3.3. Spirometric Data
The absolute values of FEV1 of FVC were higher in men than in women (p<0.001). Mean (standard deviation: SD) of FEV1/FVC ratio was 0.80 in men and 0.83 in women (p=0.002). However, when FEV1 and FVC were related to
predicted values (% predicted), no difference was found between men and women. The mean (SD) of % predicted FEV1 was 74.6% (22.9%) in men and 75.6% (19%) in women (p=0.835). The equivalents figure for FVC were 75.8% (21.3%) in men and 76.2 (17.2%) in women (p=0.889), Table 2.
Table 2. Spirometric data of the study population.
Variables Overall Men Women p-value
Absolute values
FEV1,L, m(25th -75th percentiles) 2.22 (1.72-2.72) 2.51 (1.88-3.08) 2.04 (1.59-2.39) <0.001
EV1, L, M(SD) 2.26 (0.75) 2.48 (0.83) 2.00 (0.53) <0.001
FVC , L, m(25th -75th percentiles) 2.71 (2.18-3.31) 3.13 (2.41-3.73) 2.44 (2.04-2.81) <0.001
FVC, L, M(SD) 2.77 (0.85) 3.08 (0.93) 2.40 (0.56) <0.001
FEV1/FVC, m(25th -75th percentiles) 0.83 (0.78-0.88) 0.82 (0.76-0.87) 0.85 (0.79-0.89) 0.002
FEV1/FVC, M(SD) 0.82 (0.10) 0.80 (0.10) 0.83 (0.09) 0.002
% predicted
FEV1, %, m(25th -75th percentiles) 76.8 (61.1-89.2) 76.6 (58.9-92.3) 77.9 (62.8-87.6) 0.616
FEV1, %, M(SD) 75.1 (21.2) 74.6 (22.9) 75.6 (19.0) 0.835
FVC, %, m(25th -75th percentiles) 76.1 (64.2-88.8) 75.7 (62.5-91.5) 76.4 (65.5-87.6) 0.764
FVC, %, M(SD) 75.9 (19.5) 75.8 (21.3) 76.2 (17.2) 0.889
3.4. Determinants of Post-Tuberculosis Residual Lung Function
We found a low to moderate negative correlation between spirometric parameters and age in men. A low to moderate positive correlation was also found between weight and spirometric parameters in men. In women, we found a low to moderate negative correlation between absolute values of FEV1 and FVC with age. FEV1 and FVC were positively correlated with weight in women. Correlation coefficients and accompanied p-values for correlation between spirometric parameters and age, and anthropometric predictors are summarized in supplementary Table A1.
Spirometric parameters were negatively associated to duration of symptoms prior to TB treatment and to proportion of extension of lung sequelae except for association between FEV1/FVC ratio and duration of symptoms. The correlation was moderate-to-high between FEV1 or FVC and extension of lung TB sequelae (Supplementary Table A2).
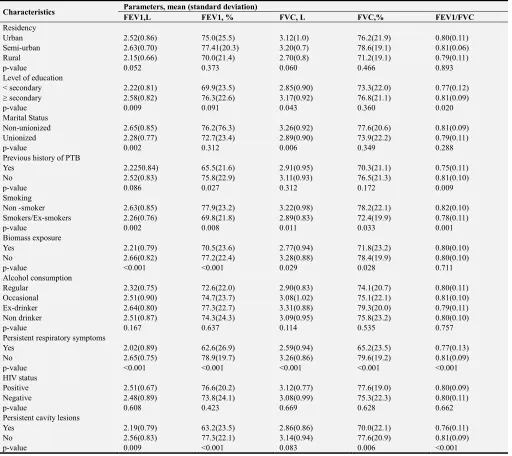
Association between spirometric parameters and categorical predictors in men is presented in supplementary Table A3. Absolute value of FEV1 was significantly associated with residency, level of formal education, marital status, previous history of PTB, smoking, biomass exposure, alcohol use, persistent respiratory symptoms and persistent cavity lesions. Absolute value of FVC was significantly associated to residency, level of education, marital status, smoking, biomass exposure, persistent respiratory symptoms and persistent cavity lesions. FEV1/FVC ratio was associated to level of education, previous history of pulmonary TB, smoking, persistent respiratory symptoms and persistent
cavity lesions.
Association between spirometric parameters and categorical predictors in women is presented in Supplementary Table A4. Absolute value of FEV1 was significantly associated with level of formal education, biomass exposure, previous history of PTB, persistent respiratory symptoms and persistent cavity lesions. Absolute value of FVC was significantly associated with previous history of pulmonary TB, persistent respiratory symptoms and persistent cavity lesions. FEV1/FVC ratio was associated with level of education, previous history of PTB, persistent respiratory symptoms and persistent cavity lesions.
3.5. Prediction Models of Post-Tuberculosis Residual Lung Function Parameters
Using linear general models, the prediction equations of residual lung function parameters were in the form: lung function parameters = Intercept + β1*P1 + β2*P2 +…βn*Pn ;
βn is regression coefficient for corresponding predictor (Pn),
for categorical variables Pn is 1 if the modality is present and
0 if the modality is absent.
3.5.1. Prediction Models of Post-Tuberculosis Residual Lung Function Parameters in Men
Regression coefficients for different predictors of each spirometric parameter in men are shown in Table 3. For example the prediction equation of absolute value of FEV1 in men was: FEV1(L) = 1.987 – 0.017 * age(years) + 0.025 * weight(kg) - 0.004 * duration of symptoms – 0.028 * % lung sequelae (%) – 0.238 (if smoking).
Table 3. Prediction of post-tuberculosis residual spirometric parameters in men.
Parameters FEV1, L % predicted FEV1 FVC, L % predicted FVC FEV1/FVC
Intercept 1.987 54.104 2.576 88.294 0.888
β1 age, years -0.017 0 -0.019 0 -0.001
β2 weight, kg 0.025 -0.531 0.025 0 0
β3 height, cm 0 0 0 0 0
β4 body mass index, kg/m2 0 3.116 0 0 0
β5 duration of symptoms, weeks -0.004 -0.168 0 -0.115 -0.001
β6 % lung sequelae, % -0.028 -0.871 -0.029 -0.837 -0.001
β7 smoking -0.238 0 0 0 -0.033
β8 persistent respiratory symptoms 0 -7.182 -0.264 -7.465 0
β9 persistent cavities 0 0 0 0 -0.052
RSD 0.57925 16.99827 0.68467 17.50059 0.09348
R2 0.516 0.433 0.450 0.328 0.167
Adjusted R2 0.504 0.419 0.439 0.318 0.143
FEV1, forced expiratory volume in 1 s FVC, forced vital capacity; TB, tuberculosis, RSD, residual standard deviation; R2, determination coefficient, Parameters estimation = Intercept + β1*P1 + β2*P2 +…βn*Pn, βn, regression coefficient for corresponding predictor (Pn)
3.5.2. Prediction Models of Post-Tuberculosis Residual Lung Function Parameters in Women
Regression coefficients for different predictors of each spirometric parameter in women are shown in Table 4. For example the prediction equation of predicted FVC in women was:
Table 4. Prediction of post-tuberculosis residual spirometric parameters in women.
Parameters FEV1, L % predicted FEV1 FVC % predicted FVC FEV1/FVC
Intercept 1.763 191.676 1.935 197.969 0.843
β1 age, years -0.012 0 -0.013 0 0
β2 weight, kg 0.015 0.503 0.019 0.516 0
β3 height, cm 0 -0.854 0 -0.890 0
β4 body mass index, kg/m2 0 0 0 0 0
β5 duration of symptoms, weeks 0 0 0 0 0
β6 % lung sequelae, % -0.015 -0.621 -0.017 -0.467 -0.001
β7 smoking 0 0 0 -12.712 0
β8 persistent respiratory symptoms -0.203 0 0 -5.403 0
β9 persistent cavities 0 0 0 0 0
RSD 0.40475 15.66114 0.44079 13.63932 0.09118
R2 0.408 0.323 0.381 0.368 0.028
Adjusted R2 0.394 0.312 0.371 0.347 0.023
FEV1, forced expiratory volume in 1 s FVC, forced vital capacity; TB, tuberculosis, RSD, residual standard deviation; R2, determination coefficient, Parameters estimation = Intercept + β1*P1 + β2*P2 +…βn*Pn,
βn, regression coefficient for corresponding predictor (Pn)
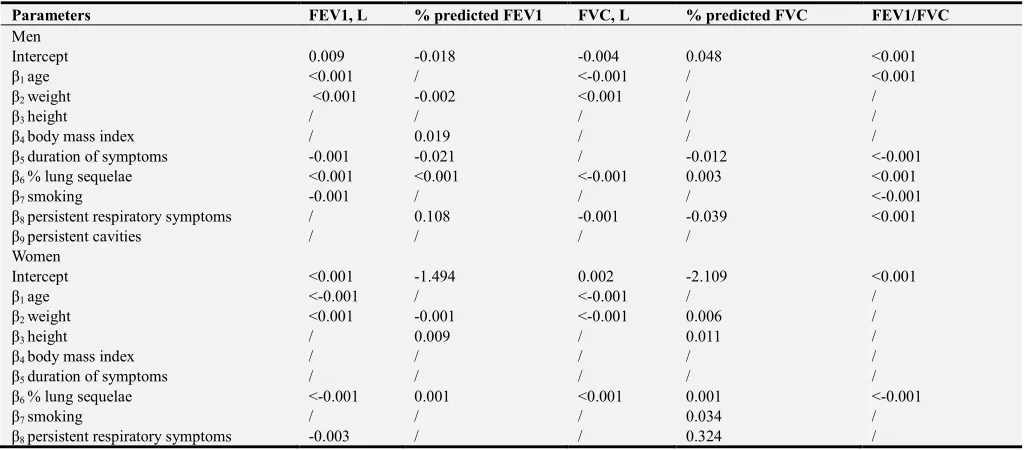
3.5.3. Models Validation
The summary statistics for internal validation of models using boostrap procedure are provides in Table 5. For each of the spirometric variable, differences in performance measures (optimism) were mostly marginal. Indeed, the average of the regression coefficients across boostrap samples was not appreciably different from those obtained on the original population, indicating that any gain from shrinking those coefficients would be marginal.
Table 5. Optimism in bootstrap internal validation of prediction models in men and women.
Parameters FEV1, L % predicted FEV1 FVC, L % predicted FVC FEV1/FVC
Men
Intercept 0.009 -0.018 -0.004 0.048 <0.001
β1 age <0.001 / <-0.001 / <0.001
β2 weight <0.001 -0.002 <0.001 / /
β3 height / / / / /
β4 body mass index / 0.019 / / /
β5 duration of symptoms -0.001 -0.021 / -0.012 <-0.001
β6 % lung sequelae <0.001 <0.001 <-0.001 0.003 <0.001
β7 smoking -0.001 / / / <-0.001
β8 persistent respiratory symptoms / 0.108 -0.001 -0.039 <0.001
β9 persistent cavities / / / /
Women
Intercept <0.001 -1.494 0.002 -2.109 <0.001
β1 age <-0.001 / <-0.001 / /
β2 weight <0.001 -0.001 <-0.001 0.006 /
β3 height / 0.009 / 0.011 /
β4 body mass index / / / / /
β5 duration of symptoms / / / / /
β6 % lung sequelae <-0.001 0.001 <0.001 0.001 <-0.001
β7 smoking / / / 0.034 /
β8 persistent respiratory symptoms -0.003 / / 0.324 /
FEV1, forced expiratory volume in 1 s FVC, forced vital capacity.
4. Discussion
The purpose of this study was to establish the prediction equations of residual spirometric indices FEV1, FVC and FEV1/FVC ratio in patients treated for pulmonary tuberculosis. The main findings resulting from this study are: 1) the prediction equations of the spirometric indices have been established separately for men and women to account for significant differences in the absolute values of spirometric parameters in men and women; 2) post-tuberculosis spirometric indices can be estimated from demographic (age) and anthropometric (weight, height, body
mass index), behavioral (smoking) and clinical (duration of symptoms before TB treatment, persistence of respiratory signs after TB treatment) and chest X-ray data (persistence of cavities and extension of lung sequelae); 3) The equations were developed for absolute values and for predicted values estimated from theoretical norms for the blacks using the Global Lung Initiative equations 2012 [20].
from 44 to 100 kg for weight and 140 to 183 cm for height. The estimation of post-tuberculosis spirometric indices should take into account the limits of validity of the anthropometric parameters. In fact, the normal spirometric indices depend on these parameters [20–24]. These equations should not be applied to people who do not have the characteristics of the population studied, in the absence of validation of these equations in these groups. Application outside populations with similar characteristics to those used for development may be misleading.
The absolute values of FEV1 and FVC found in this study are higher in men than in women. These findings corroborate the variation of these indices when they are obtained in healthy subjects. Indeed, in black, Caucasian, Asian or mixed populations, the normative absolute values of FEV1 and FVC are higher in men than in women even if the other parameters (age, height) are otherwise identical [25, 26]. In contrast, the mean FEV1/FVC ratio was 0.80 in men and 0.83 in women with a significant difference. This difference is explained by a larger decline in FVC compared to FEV1 in men.
The other main predictors of each spirometric indice are variable and include: smoking, clinical and radiographic data. Tobacco use was associated with a lower FEV1 and FEV1/FVC for men, as well as a lower FVC as a percentage of predicted value (% predicted FVC). In fact, smoking has a known deleterious effect on the decline of lung function and is the main risk factor for the occurrence of chronic obstructive pulmonary disease, COPD [27]. In a study conducted in a low-smoking Indian women population (smoking prevalence at 5% and 73.6% of participants cumulating less than 2.5 pack-years), smoking was associated with lower FEV1 [28].
A longer duration of respiratory symptoms before TB treatment was associated with a lower spirometric parameters in men but not in women. Indeed, a longer duration of symptoms of PTB is associated with larger radiographic lesions, sources of pulmonary sequelae [29]. The persistence of respiratory symptoms at the end of TB treatment was also associated with a decrease in FEV 1 and FVC. This persistence of respiratory symptoms should prompt an investigation of impaired respiratory function. Persistence of respiratory signs in patients treated for PTB is associated with distal obstruction, indicating distal lung function impairment in subjects with no proximal airflow limitation [30].
In this study, the radiographic extension of sequelae of TB summarized in terms of the proportion of radiographic sequelae is negatively correlated with all spirometric parameters in men and women with correlation coefficients ranging from -0.173 to - 0.608. Few studies have investigated the association between the extent of initial radiographic lesions or radiographic sequelae and impaired lung function. Radovic et al. on a small sample size (n = 40 patients) showed that initial radiographic extension is associated with low FEV1 and post-tuberculous airflow obstruction [31]. In another study, including 591 patients in 21 hospitals in South Korea, the number of pulmonary lobes affected by TB sequelae was negatively correlated with FEV1 and FVC [31]. There are three types of post-tuberculosis lung function
impairment: restrictive pattern, airflow limitation or obstructive lung disease, and the mixed pattern associating restrictive pattern and obstructive lung disease [32]. The pathogenic and pathophysiology mechanisms explaining these alterations are not completely understood. Anatomically, the restrictive pattern is due to pulmonary fibrotic lesions, loss of parenchymal elasticity, broncho-vascular distortion and pleural sequelae. Obstructive post-tuberculous lung disease may be related to bronchial stenosis, diffuse bronchial inflammation, para-cicatricial emphysema, or bronchiectasis [32].
Progress has been made in understanding the inflammatory mechanisms that are likely responsible for tissue damage and impairment of lung function. Inflammatory mediators involved in cavity formation and airflow obstruction are tumor necrosis factor-α (TNF-α), interleukins 1β, 6, 8, 12, hypoxia inducible factor (HIF), nuclear factor (NF) , matrix metalloproteinases 1, 3, 8, 9, 12 and interferon γ. The immune factors associated with fibrosis and restriction include transforming growth factor β (TGF-β), TNF-α, and interleukins-1 β, 6, 8, 12 [32].
The equations developed for FEV1 and FVC can be used in two ways. The first way is to determine the residual absolute value of FEV1 and FVC and then compare these values to normative values using specific prediction equations. This method can be used regardless of the set of reference equations chosen. The second way is to use equations based on the predicted values (% predicted) to directly obtain FEV1 and FVC values based on the theoretical values for blacks according to the 2012 GLI reference equations [20]. For the FEV1/FVC ratio, the absolute value found from the prediction equations will be compared to the lower limit of the expected normal value to define post-tuberculous airflow obstruction.
For example, considering a 30-year-old smoking man with the following characteristics after treatment of PTB: duration of symptoms= 9 weeks, no persistence of symptoms after treatment, height = 170 cm, weight = 60 kg, persistence of a pulmonary cavity, extension of pulmonary sequelae = 10%. His residual post-tuberculosis FEV1 will be 2.42 L. Using the 2012 GLI equations; the normal theoretical FEV1 value will be 3.47 L. He has a predicted post-tuberculosis residual FEV1 of 70% (2.42 L/3.47 L). Similarly, the other values are: tuberculous FVC = 3.22 L, % predicted FVC post-tuberculosis = 78% (3.22 L/4.13 L), FEV1/FVC = 0.75 (compared to the predicted value of 0.84). This patient should perform lung function test to investigate possible ventilatory abnormalities, in particular the airflow obstruction given a low value of post-tuberculosis FEV1/FVC ratio.
clinicians to perform spirometry to investigate possible restrictive pattern. In this case, FEV1/FVC ratio approaches the expected value (0.83) and airflow obstruction is unlikely the main type of lung function impairment.
Overall, the coefficient of determination (R2) is higher for FEV1 and FVC than for FEV1/FVC ratio. Thus, the equations developed in this work are more robust for FEV 1 and FVC. Obtaining an abnormal FEV1 or FVC value regardless of the value of the FEV1/ FVC ratio should prompt clinicians to request functional lung investigations for their patients.
The boostrap method was used to validate the prediction equations. The boostrap validation method is validated and allows the use of the entire sample available for development. The validation is done by a multiple replication of random choice of subsamples (n = 2000) to check the stability of the developed model. A weak and non-significant optimism makes it possible to conclude on the stability of the model in spite of the multiple replications [33].
5. Conclusions
The prediction equations for post-tuberculous residual lung
function have been established in this study. Determinants of the post-tuberculosis spirometric indices vary according to each indice and include age, weight, height, body mass index, smoking, duration of symptoms before TB treatment, persistent of respiratory symptoms after TB treatment, persistent of cavity lesions and extension of lung sequelae. The equations developed and validated in this study could help the selection of patients in whom spirometry should be a priority after TB treatment. The models had good performance in the derivation sample and during internal validation using bootstrap resampling methods.
These prediction equations can be used to select patients in whom PFT should be a priority. Successful application of the models in routine TB care settings can assist the identification of a group of patients whose risk of development of lung function impairment is high. Therefore corrective measures will be taken to treat the observed deteriorations and improve the quality of life of these patients. Like any newly developed model, results from this study are just preliminary findings. Models will require independent external validation to establish the performance both in the study setting and in other settings including.
Appendix
Supplementary Tables (Prediction of Post-Tuberculosis Lung Function Impairment)
Table A1. Correlation coefficients (r) and p-values between spirometric parameters, and age/anthropometric predictors.
Parameters Age
r (p-value)
Weight r (p-value)
Height r (p-value)
BMI r (p-value)
Men
FEV1, L -0.404(<0.001) 0.451(<0.001) 0.208(0.002) 0.358(<0.001)
FEV1, % predicted -0.110(0.277) 0.312(<0.001) -0.106(0.123) 0.420(<0.001)
FVC, L -0.370(<0.001) 0.435(<0.001) 0.235(0.001) 0.326(<0.001)
FVC, % predicted -0.128(0.061) 0.274(<0.001) -0.114(0.097) 0.387(<0.001)
FEV1/FVC -0.188(0.006) 0.136(0.046) -0.049(0.473) 0.146(0.033)
Women
FEV1, L -0.296(<0.001) 0.333(<0.001) 0.119(0.105) 0.279(<0.001)
FEV1, % predicted 0.021(0.781) 0.270(<0.001) -0.149(0.042) 0.371(<0.001)
FVC, L -0.286(<0.001) 0.363(<0.001) 0.152(0.039) 0.286(<0.001)
FVC, % predicted -0.067(0.360) 0.256(<0.001) -0.178(<0.015) 0.367(<0.001)
FEV1/FVC -0.133(0.071) -0.040(0.586) -0.019(0.801) -0.014(0.852)
r, correlation coefficient; FEV1, forced expiratory volume in 1 s FVC, forced vital capacity.
Table A2. Correlation coefficient (r) and p-values between spirometric parameters and continuous clinical and radiological predictors.
Parameters Duration of symptoms
r (p-value)
% lung TB sequelae r (p-value)
Men
FEV1, L -0.325(<0.001) -0.575(<0.001)
FEV1, % predicted -0.322(<0.001) -0.608(<0.001)
FVC, L -0.297(<0.001) -0.557(<0.001)
FVC, % predicted -0.282(<0.001) -0.583(<0.001)
FEV1/FVC -0.198(0.004) -0.173(0.011)
Women
FEV1, L -0.223(0.002) -0.466(<0.001)
FEV1, % predicted -0.148(0.044) -0.428(<0.001)
FVC, L -0.224(0.002) -0.455(<0.001)
FVC, % predicted -0.140(0.058) -0.415(<0.001)
FEV1/FVC -0.052(0.423) -0.187(0.011)
Table A3. Association between spirometric parameters and categorical predictors in men.
Characteristics Parameters, mean (standard deviation)
FEV1,L FEV1, % FVC, L FVC,% FEV1/FVC
Residency
Urban 2.52(0.86) 75.0(25.5) 3.12(1.0) 76.2(21.9) 0.80(0.11)
Semi-urban 2.63(0.70) 77.41(20.3) 3.20(0.7) 78.6(19.1) 0.81(0.06)
Rural 2.15(0.66) 70.0(21.4) 2.70(0.8) 71.2(19.1) 0.79(0.11)
p-value 0.052 0.373 0.060 0.466 0.893
Level of education
< secondary 2.22(0.81) 69.9(23.5) 2.85(0.90) 73.3(22.0) 0.77(0.12)
≥ secondary 2.58(0.82) 76.3(22.6) 3.17(0.92) 76.8(21.1) 0.81(0.09)
p-value 0.009 0.091 0.043 0.360 0.020
Marital Status
Non-unionized 2.65(0.85) 76.2(76.3) 3.26(0.92) 77.6(20.6) 0.81(0.09)
Unionized 2.28(0.77) 72.7(23.4) 2.89(0.90) 73.9(22.2) 0.79(0.11)
p-value 0.002 0.312 0.006 0.349 0.288
Previous history of PTB
Yes 2.2250.84) 65.5(21.6) 2.91(0.95) 70.3(21.1) 0.75(0.11)
No 2.52(0.83) 75.8(22.9) 3.11(0.93) 76.5(21.3) 0.81(0.10)
p-value 0.086 0.027 0.312 0.172 0.009
Smoking
Non -smoker 2.63(0.85) 77.9(23.2) 3.22(0.98) 78.2(22.1) 0.82(0.10)
Smokers/Ex-smokers 2.26(0.76) 69.8(21.8) 2.89(0.83) 72.4(19.9) 0.78(0.11)
p-value 0.002 0.008 0.011 0.033 0.001
Biomass exposure
Yes 2.21(0.79) 70.5(23.6) 2.77(0.94) 71.8(23.2) 0.80(0.10)
No 2.66(0.82) 77.2(22.4) 3.28(0.88) 78.4(19.9) 0.80(0.10)
p-value <0.001 <0.001 0.029 0.028 0.711
Alcohol consumption
Regular 2.32(0.75) 72.6(22.0) 2.90(0.83) 74.1(20.7) 0.80(0.11)
Occasional 2.51(0.90) 74.7(23.7) 3.08(1.02) 75.1(22.1) 0.81(0.10)
Ex-drinker 2.64(0.80) 77.3(22.7) 3.31(0.88) 79.3(20.0) 0.79(0.11)
Non drinker 2.51(0.87) 74.3(24.3) 3.09(0.95) 75.8(23.2) 0.80(0.10)
p-value 0.167 0.637 0.114 0.535 0.757
Persistent respiratory symptoms
Yes 2.02(0.89) 62.6(26.9) 2.59(0.94) 65.2(23.5) 0.77(0.13)
No 2.65(0.75) 78.9(19.7) 3.26(0.86) 79.6(19.2) 0.81(0.09)
p-value <0.001 <0.001 <0.001 <0.001 <0.001
HIV status
Positive 2.51(0.67) 76.6(20.2) 3.12(0.77) 77.6(19.0) 0.80(0.09)
Negative 2.48(0.89) 73.8(24.1) 3.08(0.99) 75.3(22.3) 0.80(0.11)
p-value 0.608 0.423 0.669 0.628 0.662
Persistent cavity lesions
Yes 2.19(0.79) 63.2(23.5) 2.86(0.86) 70.0(22.1) 0.76(0.11)
No 2.56(0.83) 77.3(22.1) 3.14(0.94) 77.6(20.9) 0.81(0.09)
p-value 0.009 <0.001 0.083 0.006 <0.001
FEV1, forced expiratory volume in 1 s FVC, forced vital capacity; TB, tuberculosis.
Table A4. Association between spirometric parameters and categorical predictors in women.
Characteristics Parameters, mean (standard deviation)
FEV1,L FEV1, % FVC, L FVC,% FEV1/FVC
Residency
Urban 2.02(0.55) 75.2(19.3) 2.42(0.58) 75.6(17.6) 0.84(0.09)
Semi-urban 2.00(0.48) 76.3(19.8) 2.45(0.54) 78.1(18.0) 0.82(0.08)
Rural 1.82(0.39) 78.2(16.9) 2.25(0.43) 78.8(13.8) 0.81(0.09)
p-value 0.195 0.297 0.980 0.806 0.172
Level of education
< secondary 1.80(0.51) 74.0(20.2) 2.21(0.57) 74.1(18.4) 0.82(0.09)
≥ secondary 2.11(0.50) 76.6(18.45) 2.51(0.53) 77.4(16.4) 0.84(0.09)
p-value <0.001 <0.001 0.354 0.165 0.113
Marital Status
Non-unionized 1.98(0.53) 75.1(18.6) 2.37(0.56) 75.5(16.8) 0.84(0.09)
Unionized 2.02(0.52) 76.4(19.9) 2.45(0.56) 77.3(17.8) 0.82(0.09)
p-value 0.999 0.555 0.976 0.665 0.406
Previous history of PTB
Characteristics Parameters, mean (standard deviation)
FEV1,L FEV1, % FVC, L FVC,% FEV1/FVC
No 2.02(0.52) 76.3(18.9) 2.42(0.56) 76.5(17.1) 0.84(0.09)
p-value 0.016 0.150 0.059 0.554 0.017
Smoking
Non -smoker 2.01(0.52) 76.1(68.0) 2.42(0.55) 76.8(16.8) 0.83(0.09)
Smokers/Ex-smokers 1.77(0.63) 68.0(22.9) 2.04(0.67) 65.8(20.9) 0.86(0.08)
p-value 0.252 0.077 0.296 0.091 0.235
Biomass exposure
Yes 1.88(0.52) 74.9(19.9) 2.30(0.55) 76.3(17.9) 0.82(0.10)
No 2.06(0.52) 76.0(18.7) 2.45(0.56) 76.1(16.9) 0.84(0.10)
p-value 0.049 0.093 0.866 0.805 0.173
Alcohol consumption
Regular 1.92(0.55) 75.5(21.4) 2.27(0.53) 73.4(15,1) 0.85(0.14)
Occasional 1.99(0.48) 74.9(17.5) 2.41(0.52) 75.8(16.7) 0.82(0.08)
Ex-drinker 1.95(0.58) 75.6(20.9) 2.39(0.59) 77.2(17.5) 0.81(0.01)
Non-drinker 2.03(0.53) 76.0(19.2) 2.04(0.58) 76.2(17.8) 0.86(0.09)
p-value 0.758 0.988 0.916 0.965 0.032
Persistent respiratory symptoms
Yes 1.74(0.50) 67.1(18.2) 2.16(0.56) 69.6(17.7) 0.80(0.10)
No 2.11(0.50) 79.2(18.3) 2.50(0.53) 79.0(16.2) 0.84(0.09)
p-value <0.001 <0.001 <0.001 <0.001 0.008
HIV status
Positive 1.98(0.51) 76.8(18.5) 2.35(0.57) 76.1(17.2) 0.84(0.10)
Negative 2.00(0.54) 74.8(19.5) 2.43(0.55) 76.2(17.2) 0.82(0.09)
p-value 0.743 0.394 0.428 0.880 0.070
Persistent cavity lesions
Yes 1.74(0.48) 66.5(17.8) 2.16(0.60) 68.2(18.1) 0.82(0.09)
No 2.06(0.51) 78.1(18.7) 2.47(0.53) 78.3(16.3) 0.83(0.09)
p-value 0.001 <0.001 0.004 0.002 0.094
FEV1, forced expiratory volume in 1 s FVC, forced vital capacity; TB, tuberculosis.
References
[1] World Health Organization. Global tuberculosis report 2016. WHO. 2017.
http://apps.who.int/medicinedocs/en/d/Js23098en/. Accessed September 5, 2018.
[2] World Health Organization. Global tuberculosis report 2018.
WHO. 2018.
http://www.who.int/tb/publications/global_report/en/. Accessed December 23, 2018.
[3] WHO. Countries profile 2018.
https://www.who.int/countries/cmr/en/. Accessed December 23, 2018.
[4] Al-Hajjaj MS, Joharjy IA. Predictors of radiological sequelae of pulmonary tuberculosis. Acta Radiol. 2000;41:533–7.
[5] N’dri K, Ake A AC, Konate I, Konan A, Chiedi AS, Abby B CB. Les aspects radiographiques des sequelles de la tuberculose pulmonaire. Med. Afr. Noire. 2006;53:704–8.
[6] Ramos LMM, Sulmonett N, Ferreira CS, Henriques JF, de Miranda SS. Functional profile of patients with tuberculosis sequelae in a university hospital. J. Bras. Pneumol. 2006;32:43–7.
[7] Ehrlich RI, Adams S, Baatjies R, Jeebhay MF. Chronic airflow obstruction and respiratory symptoms following tuberculosis: a review of South African studies. Int. J. Tuberc. Lung Dis. 2011;15:886–91.
[8] Tchaou M , Sonhaye L, Kotosso A, Adjenou K,
Agoda-Koussema L, N’Timon B, Amadou A, Djagnikpo O.. Aspects radiographiques des séquelles de la tuberculose chez les personnes vivant avec le VIH/SIDA à Lomé –Togo. J Fran Viet Pneu. 2012;3:28–31.
[9] Jung CY, Jeon YJ, Rho BH. RAdiologic findings and lung function in patients with tuberculous destroyed lung. Chest. 2011;140:766A–766A.
[10] Mbatchou Ngahane BH, Nouyep J, Nganda Motto M, Mapoure Njankouo Y, Wandji A, Endale M, et al. Post-tuberculous lung function impairment in a tuberculosis reference clinic in Cameroon. Respir. Med. 2016;114:67–71.
[11] Ngahane BHM, Wandji A, Endalle M, Nouyeb J, Ze EA. Facteurs associés à la survenue d’anomalies ventilatoires post-tuberculeuses à Douala, Cameroun. Rev. Mal. Respir. 2015;32, Supple:A230.
[12] Báez-Saldaña R, López-Arteaga Y, Bizarrón-Muro A, Ferreira-Guerrero E, Ferreyra-Reyes L, Delgado-Sánchez G, et al. A novel scoring system to measure radiographic abnormalities and related spirometric values in cured pulmonary tuberculosis. PLoS One. 2013;8:e78926.
[13] Lee EJ, Lee SY, In KH, Yoo SH, Choi EJ, Oh YW, et al. Routine pulmonary function test can estimate the extent of tuberculous destroyed lung. ScientificWorld Journal. 2012;2012:835031.
[14] Pasipanodya JG, Miller TL, Vecino M, Munguia G, Garmon R, Bae S, et al. Pulmonary impairment after tuberculosis. Chest. 2007;131:1817–24.
[16] Austin PC, Steyerberg EW. The number of subjects per variable required in linear regression analyses. J. Clin. Epidemiol. 2015;68:627–36.
[17] Mahler DA, Wells CK. Evaluation of clinical methods for rating dyspnea. Chest. 1988;93:580–6.
[18] Ralph AP, Ardian M, Wiguna A, Maguire GP, Becker NG, Drogumuller G, et al. A simple, valid, numerical score for grading chest x-ray severity in adult smear-positive pulmonary tuberculosis. Thorax. 2010;65:863–9.
[19] Miller MR, Hankinson J, Brusasco V, Burgos F, Casaburi R, Coates A, et al. Standardisation of spirometry. Eur. Respir. J. 2005;26:319–38.
[20] Quanjer PH, Stanojevic S, Cole TJ, Baur X, Hall GL, Culver BH, et al. Multi-ethnic reference values for spirometry for the 3-95-yr age range: the global lung function 2012 equations. Eur. Respir. J. 2012;40:1324–43.
[21] Pellegrino R, Viegi G, Brusasco V, Crapo RO, Burgos F, Casaburi R, et al. Interpretative strategies for lung function tests. Eur. Respir. J. 2005;26:948–68.
[22] Stanojevic S, Wade A, Stocks J. Reference values for lung function: past, present and future. Eur. Respir. J. 2010;36:12–9.
[23] Ratomaharo J, Linares Perdomo O, Collingridge DS, Andriamihaja R, Hegewald M, Jensen RL, et al. Spirometric reference values for Malagasy adults aged 18-73 years. Eur. Respir. J. 2015;45:1046–54.
[24] Pefura-Yone EW, Kanko-Nguekam NF, Kengne AP, Balkissou AD, Kuaban C. Équations spirométriques de référence des Bantous camerounais. Rev. Mal. Respir.
[25] Bougrida M, Ben Saad H, Kheireddinne Bourahli M, Bougmiza I, Mehdioui H. [Spirometric reference equations for Algerians aged 19 to 73 years]. Rev. Mal. Respir. 2008;25:577–90.
[26] Hankinson JL, Odencrantz JR, Fedan KB. Spirometric Reference Values from a Sample of the General U. S. Population. Am. J. Respir. Crit. Care Med. 1999;159:179–87.
[27] Vijayan VK. Chronic obstructive pulmonary disease. Indian J. Med. Res. 2013;137:251–69.
[28] Arora S, Rasania S, Bachani D, Gandhi A, Chhabra S. Air pollution and environmental risk factors for altered lung function among adult women of an urban slum area of Delhi: A prevalence study. Lung India. 2018;35:193.
[29] Pefura-Yone EW, Kuaban C, Assamba-Mpom SA, Moifo B, Kengne AP. Derivation, validation and comparative performance of a simplified chest X-ray score for assessing the severity and outcome of pulmonary tuberculosis. Clin. Respir. J. 2015;9:157–64.
[30] Pefura-Yone EW, Kengne AP, Tagne-Kamdem PE, Afane-Ze E. Clinical significance of low forced expiratory flow between 25% and 75% of vital capacity following treated pulmonary tuberculosis: a cross-sectional study. BMJ Open. 2014;4:e005361.
[31] Radovic M, Ristic L, Ciric Z, Dinic-Radovic V, Stankovic I, Pejcic T, et al. Changes in respiratory function impairment following the treatment of severe pulmonary tuberculosis - limitations for the underlying COPD detection. Int. J. Chron. Obstruct. Pulmon. Dis. 2016;11:1307–16.
[32] Ravimohan S, Kornfeld H, Weissman D, Bisson GP. Tuberculosis and lung damage: from epidemiology to pathophysiology. Eur. Respir. Rev. 2018;27.