Evaluation of the Efficiency by DEA: A Case Study of Hospital Sectors
Kh. Ghaziani1,, B. Ejlaly2, S. F. Bagheri3
1Department of Mathematics, Ayandegan Insttitute of Higher Education, Tonekabon, Iran.
2Department of Engineering, Amirkabir University, Tehran, Iran. 3Department of Mathematics, Azad University, Branch Lahijan, Guilan, Iran.
A B S T R A C T
Data Envelopment Analysis (DEA) is a nonparametric technique used to determine the relative efficiency of Decision Making Units (DMUs). Results from DEA analysis yield important information regarding the optimal operating capabilities of each unit. This paper studies DEA to hospital sectors and identifies their rankings during a period of six years. Data for the study comes from a hospital in the North of Iran. This article compares the performance of different parts of the hospital over the years. It can also aid improve hospital performance.
Keywords: DEA, Efficiency, Super-efficiency method, Hospital sector.
Article history: Received: 12 May 2019 Revised: 30 August 2019 Accepted: 05 September 2019
1. Introduction
The analysis of hospital industry provides an important contribution to the comparison of health care system performance. Hospital efficiency is one of the key indicators of hospital performance. Manifold efforts have been undertaken to evaluate and compare the hospital efficiency within a particular country. The analysis of the efficiency of health production, without the focus on hospital sectors, using parametric and nonparametric approaches has been attempted previously. The available studies performed the efficiency analysis using nonparametric approaches such as Data Envelopment Analysis (DEA) and directional distance function. DEA was developed to measure the performance of decision making units in multiple inputs and output setting. The seminal paper of [4] introduced DEA a linear programming approach to performance evaluation when production is characterized by constant return to scale and developed in [2] by variable return to scale. In other words, DEA extends the theoretical discussion of technical efficiency of [8] into direct measurability by developing the observed data to determine a best-practice frontier. This technique assigns a
Corresponding author
E-mail address: [email protected] DOI:10.22105/riej.2018.128451.1040
International Journal of Research in Industrial
Engineering
Organizational structure of health system in Iran includes ministry of health and medical education, social security organization, government hospitals, private hospitals (non-profit), private hospitals (for-profit) and private teaching hospitals. The University of medical sciences plays an important role both in medical education and the provision of health services in province level in Iran. In addition, Social Security Organization (SSO) provides the medical services to its beneficiaries through their hospitals. Furthermore, the private sector provides 10 to 20% of the health care services
In 2000, the World Health Organization (WHO) reported that Iranian health system performance was ranked ninety-three among other countries [6]. Mismanagement of resources can be a reason for this issue [5]. In 2014, Iranian Health Sector Evolution Plan (HSEP) was initiated by the ministry of health. This plan included some packages to the following: increasing coverage of basic health insurance, increasing quality of care, reducing Out-Of-Pocket (OOP) payments for inpatient services, and increasing quality of primary healthcare [11]. Healthcare providers concerns potentially about the sustainability and efficiency of HSEP in Iran [11].
Low hospital efficiency is deemed as one of the most important problems of Iranian health system. The studies conducted through many Iranian researchers were conducted in hospital efficiency evolution. In most of these studies, the efficiency indicator was reported low [10]. According to a study conducted in Iran, the hospital efficiency was better than that of before the implementation of HSEP [5]. Research results in some countries indicated that the hospital efficiency was low [5, 6]. In some studies, high hospital efficiency has been reported [5]. Hospitals are important economic enterprises. Therefore, measuring its financial performance is a key action toward improving resource management [5]. Efficiency means the maximum use of resources to generate returns. Two non-parametric and parametric approaches were introduced to measure the efficiency. DEA is an applied and frequent nonparametric technique used to measure the efficiency of units. Inefficient units and reason of the inefficiency can be assessed through the DEA methods [7]. Considering the importance of hospital performance measurement, this study is aimed to analyze the efficiency of public hospitals through DEA technique.
2. Methods
DEA is used to find the relative efficiency for medical systems. Since DEA allows multiple inputs and outputs simultneously, the consideration here will be the data manner. The usual output per input definition of efficiency may be used to judge the relative efficiency for medical sectors. DEA was developed on the seminal work of [8] which quantifys an efficiency score as the ratio of single output to a single input. However, hospitals are not single input-outputs systems. There are a number of equivalent formulation for DEA. The mosr direct formulation of DEA are as follows. Let Xi b the vector of inputs into DMUj. let
i
Ybe the vector of outputs into DMUj. Let Xo be the inputs into DMUofor which we want
0. Y Y X X . t . s Min o i i o i i
(1)Whereiis the weight given toDMUjin its ffort to dominateDMUoandis the efficiency of
o
DMU . The optimalcannot possibly be more than one. Performance units 1 is called efficient, otherwise the units are inefficient. The formulation above are called CCR input-oriented formulation. One important assumption to make when performing DEA is whether to use an input or output orientation. An input-oriented models holds the current level of output constant and minimize inputs, whereas an output-oriented model maximizes output keeping the amount of inputs constant. [7] did not specify a formal definition of the contemporary “Farrell measure” of the technical efficiency of production and did not standardize the two differentmeasures of technical efficiency. Deprins and Simar () defined the input technical efficiency as a measure between zero and one, whereas output technical efficiency as a measure greater than one. Another important theoretical assumption in DEA is whether it applys constant or variable returnt to scale. The CCR model for efficiency measurement assumed the Constant Return to Scale (CRS). Later on, the [12] incorporated the Variable Return to Scale (VRS) to account for firms, which do not operate at their optimal scale. The VRS model is as follows:
0. 1 Y Y X X . t . s Min i o i i o i i
(2)Eq. (2) is called BCC input-oriented formulation. These models are basic models of DEA. Usually as the number of input and output increases, more DMUs tend to get an efficiency rating one as they become too specialized to be evaluated with respect to other units. So the ranking of efficient units take an important place in DEA literature. The first model which was suggested for ranking efficient DMUs introduced by [1] with development of CCR model. This model is formulated as follows:
We see that the difference between the super-efficiency and the original DEA models is that theDMUounder evaluation is excluded from the reference set, i.e. the super efficiency DEA models are based on a reference technology constructed from all other units. The super-efficiency DEA models are always feasible and equivalent to the original DEA models when under evaluation DMU belongs to efficient points which are not extreme or belongs to weakly efficient reference set or inefficient units. Thus we only need to consider the situation when under evaluated unit belongs to extreme efficient DMUs. Study [12] showed that if the super-efficiency CCR model is infeasible, the under evaluated unit belongs to extreme efficient DMUs. However, he failed to recognize that the output-based super-efficient CCR model is always feasible for the trivial solution which has all variables set equal to zero. Moreover, [12] showed that the input-based super-efficient CCR model is infeasible if and only if a certain pattern of zero data occurs in the inputs and outputs, e.g. DMUohas some zero inputs
which are positive for all other DMUs or DMUohas some positive outputs which are equal to zero for all other DMUs.
3. Variables and Data Specification
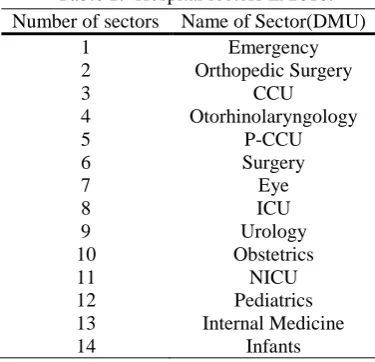
Data for analysis are driven from an Iranian hospital, in North region of Iran in years 2010 and 2019. The hospital consists of fourteen units in 2010 and fifteen units in 2019. In this paper, the performance of these fourteen units and fifteen units are interpreted as the activity efficiency to increase the satisfaction of patients. Table 1 and Table 2 present the specified units of this hospital.
Table 1. Hospital sectors in 2010.
Number of sectors Name of Sector(DMU)
1 Emergency
2 Orthopedic Surgery
3 CCU
4 Otorhinolaryngology
5 P-CCU
6 Surgery
7 Eye
8 ICU
9 Urology
10 Obstetrics
11 NICU
12 Pediatrics
13 Internal Medicine
Table 2. Hospital sectors in 2019. Name of Sector(DMU) Number of sectors
Emergency 1
Orthopedic Surgery 2
CCU 3
Otorhinolaryngology 4
P-CCU 5
Surgery 6
Eye 7
ICU 8
Urology 9
Obstetrics 10
NICU 11
Pediatrics 12
Internal Medicine 13
Infants 14
Neurology 15
The ideal measure of final output in hospital care would be some measures of the health gain of the individual patients. However, these data are not readily available. So, the output variables involve percentage of occupied beds and the number of patients. The first variable is calculated by the following formula:
days total -days of number
days occupied
-beds of number
100 .
The ratio records the indicated total days that each bed was occupied by each patient during a determined period of time. Also, total days express as multiply of total number of available beds in each section and the number of determined period of time. As for input variables, the number of active beds in each section, full or empty, represents a measure of resources, which are available for providing service to inpatients in hospitals. Moreover, the number of physician and nurses can be treated as representing the variation in service technology among different sectors in hospitals. The next section argues the results.
4. Results and Discussion
procedure in ranking units is done for BCC models. It is clear that we have ignored some factors due to lack of information, though, the selected outputs are less controlled by hospital administrative. As a result, the input-oriented DEA models are recommended. Also. DEA-solver software is used to investigate the results of information is collected. Two basic DEA models were selected for calculating efficiency scores: CCR-I and BCC-I. A brief description about the efficiency scores in three years of applied input-oriented models were recorded in Table 3.
Table 3. Efficiency score and ranking in case study application in year 1389.
DMU CCR Efficiency Score BCC Efficiency Score CCR -Ranking
1 Internal Medicine 0.46 0.48 0.46(12)
2 CCU 1 1 1.56(3)
3 Infants 0.38 0.46 0.38(14)
4 0.47 0.52 0.47(11)
5 NICU 0.76 1 0.76(9)
6 1 1 1.22(6)
7 Surgery 0.69 0.71 0.61(10)
8 Urology 0.85 1 0.85(7)
9 1 1 1.23(4)
10 Eye 1 1 1.23(5)
11 Orthopedic Surgery 1 1 2.52(2)
12 Emergency 1 1 3.38(1)
13 P-CCU 0.82 0.84 0.82(8)
14 ICU 0.46 0.78 0.46(13)
Table 3 shows that six units of fourteen units are evaluated as efficient units in CCR input oriented
evaluations. It can be seen that BCC models presents more than six units as efficient ones. It can be seen that there is six MPSS in the set of determined sectors. Recall that MPSS is a DMU, which exhibits the most productive scale size. In order to make a closer look to results and for more investigation between efficient units, the super-efficiency method is applied for ranking DMUs. The last column shows that unit # has the first rank in the sample. For the next two years, 1390 and 1391, Table 4 and Table 5 depict the efficiency score and ranking of units, respectively.
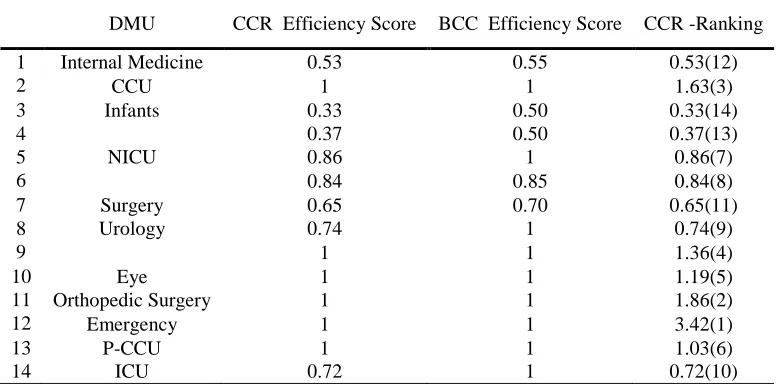
Table 4. Efficiency score and ranking in case study application in year 1390. DMU CCR Efficiency Score BCC Efficiency Score CCR -Ranking
1 Internal Medicine 0.53 0.55 0.53(12)
2 CCU 1 1 1.63(3)
3 Infants 0.33 0.50 0.33(14)
4 0.37 0.50 0.37(13)
5 NICU 0.86 1 0.86(7)
6 0.84 0.85 0.84(8)
7 Surgery 0.65 0.70 0.65(11)
8 Urology 0.74 1 0.74(9)
9 1 1 1.36(4)
10 Eye 1 1 1.19(5)
11 Orthopedic Surgery 1 1 1.86(2)
12 Emergency 1 1 3.42(1)
13 P-CCU 1 1 1.03(6)
Table 4 represents six efficient units in CCR model and nine efficient units in BCC model. MPSS units are units #2, #9, #10, #11, #12, and #13. Obviously, BCC model demonstrates more efficient units. Top of all, the unit #12 has the highest rank between the data set evaluated in this year. Testing the data set of third year, Table 4 records the relative efficiency scores and ranking orders in this year.
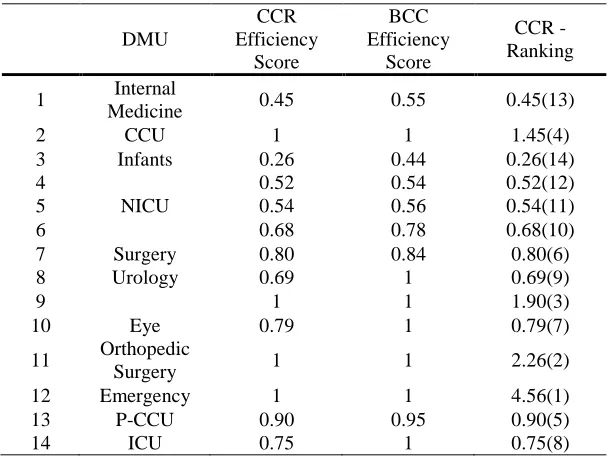
Table 5. Efficiency score and ranking in case study application in year 1391.
DMU
CCR Efficiency
Score
BCC Efficiency
Score
CCR -Ranking
1 Internal
Medicine 0.45 0.55 0.45(13)
2 CCU 1 1 1.45(4)
3 Infants 0.26 0.44 0.26(14)
4 0.52 0.54 0.52(12)
5 NICU 0.54 0.56 0.54(11)
6 0.68 0.78 0.68(10)
7 Surgery 0.80 0.84 0.80(6)
8 Urology 0.69 1 0.69(9)
9 1 1 1.90(3)
10 Eye 0.79 1 0.79(7)
11 Orthopedic
Surgery 1 1 2.26(2)
12 Emergency 1 1 4.56(1)
13 P-CCU 0.90 0.95 0.90(5)
14 ICU 0.75 1 0.75(8)
Table 6. Efficiency score and ranking in case study application in year 1395. DMU CCR Efficiency Score BCC Efficiency Score CCR -Ranking
1 Internal Medicine 0.71 0.72 0.71(11)
2 CCU 1 1 1.70(4)
3 Infants 0.59 0.67 0.59(12)
4 0.50 0.55 0.50(13)
5 NICU 0.80 1 0.80(10)
6 1 1 1.34(6)
7 Surgery 0.51 0.53 0.48(14)
8 Urology 0.85 1 0.85(9)
9 1 1 1.35(5)
10 Eye 1 1 2.53(3)
11 Orthopedic Surgery 1 1 3.28(1)
12 Emergency 0.98 0.94 0.98(7)
13 P-CCU 0.91 0.92 0.91(8)
14 ICU 0.40 0.73 0.40(15)
15 Neurology 1 1 3.25(2)
Table 6 shows six out of fourteen units are evaluated as efficient units in CCR input oriented
evaluations. It can be seen that BCC models present more than six units as efficient ones. It can be seen that there is six MPSS in the set of determined sectors. Recall that MPSS is a DMU which exhibits the most productive scale size. In order to make a closer look to results and for more investigation between efficient units, the super-efficiency method is applied for ranking DMUs. The last column shows that unit # has the first rank in the sample. For the next two years, 1396 and 1397, Table 7 and Table 8 depict the efficiency score and ranking of units, respectively.
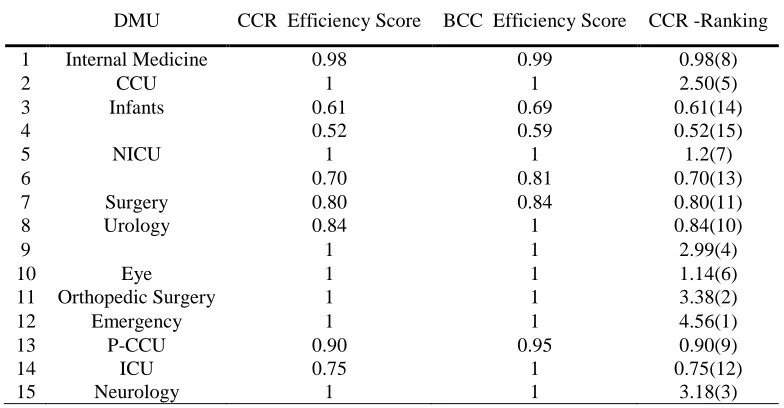
Table 7. Efficiency score and ranking in case study application in year 1396. DMU CCR Efficiency Score BCC Efficiency Score CCR -Ranking
1 Internal Medicine 0.98 0.99 0.98(8)
2 CCU 1 1 2.50(5)
3 Infants 0.61 0.69 0.61(14)
4 0.52 0.59 0.52(15)
5 NICU 1 1 1.2(7)
6 0.70 0.81 0.70(13)
7 Surgery 0.80 0.84 0.80(11)
8 Urology 0.84 1 0.84(10)
9 1 1 2.99(4)
10 Eye 1 1 1.14(6)
11 Orthopedic Surgery 1 1 3.38(2)
12 Emergency 1 1 4.56(1)
13 P-CCU 0.90 0.95 0.90(9)
14 ICU 0.75 1 0.75(12)
15 Neurology 1 1 3.18(3)
Table 7 represents seven efficient units in CCR model and nine efficient units in BCC model.
more efficient units. Top of all, the unit #12 has the highest rank between the data set evaluated in this year. Testing the data set for the third year.
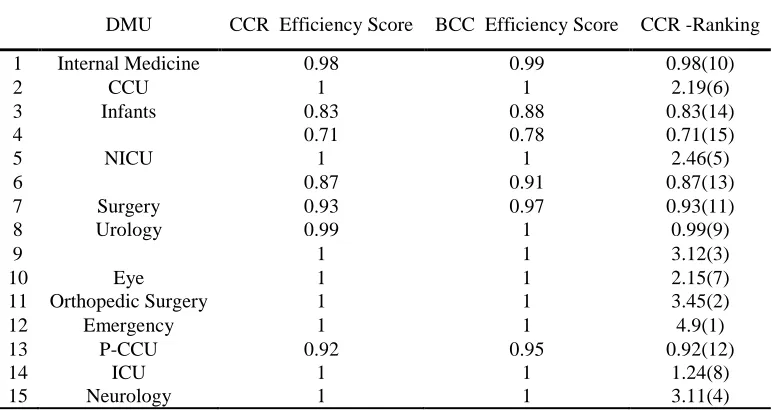
Table 8. Efficiency score and ranking in case study application in year 1397. DMU CCR Efficiency Score BCC Efficiency Score CCR -Ranking
1 Internal Medicine 0.98 0.99 0.98(10)
2 CCU 1 1 2.19(6)
3 Infants 0.83 0.88 0.83(14)
4 0.71 0.78 0.71(15)
5 NICU 1 1 2.46(5)
6 0.87 0.91 0.87(13)
7 Surgery 0.93 0.97 0.93(11)
8 Urology 0.99 1 0.99(9)
9 1 1 3.12(3)
10 Eye 1 1 2.15(7)
11 Orthopedic Surgery 1 1 3.45(2)
12 Emergency 1 1 4.9(1)
13 P-CCU 0.92 0.95 0.92(12)
14 ICU 1 1 1.24(8)
15 Neurology 1 1 3.11(4)
As the Table 8 records, this year they were made 8 sectors efficient by the CCR model, although the number of efficient units increases to nine units in BBC model. As Table 8 shows, unit #12 has the highest order in the data set. However, a sample of a hospital is not a sufficiently good basis for performing such kind of studies. The present research should be extended either by more hospitals or by analyzing the longer period of time to get more observations in regress or progress. Besides, the regrouping of hospitals could be executed in order to form clusters with an approximately equal number of objects. What’s more, surveying the RTS situations of efficient units and considering the data set used in this study from an inverse DEA view can be worth studying in addition, the nature of productivity is important when designing policies to improve resource allocation. Many factors can influence the relative rankings of such a wide variety of hospital sectors.
5. Conclusion
Resources
Andersen, P., & Petersen, N. C. (1993). A procedure for ranking efficient units in data envelopment analysis. Management science, 39(10), 1261-1264.
Barouni, M., Amiresmaieli, M. R., Shahravan, A., & Amini, S. (2017). The efficiency assessment of dental units using data envelopment analysis approach: The case of Iran. Iranian journal of public
health, 46(4), 552.
Charnes, A., Cooper, W. W., & Rhodes, E. (1978). Measuring the efficiency of decision making units. European journal of operational research, 2(6), 429-444.
Charnes, A., Cooper, W. W., Wei, Q. L., & Huang, Z. M. (1989). Cone ratio data envelopment analysis and multi-objective programming. International journal of systems science, 20(7), 1099-1118. Cooper, W. W., Seiford, L. M., & Zhu, J. (Eds.). (2011). Handbook on data envelopment
analysis (Vol. 164). Springer Science & Business Media.
Cribari-Neto, F., & Zeileis, A. (2009). Beta regression in R. Department of statistics and mathematics x, WU Vienna University of Economics and Business, Vienna.
Cheng, Z., Cai, M., Tao, H., He, Z., Lin, X., Lin, H., & Zuo, Y. (2016). Efficiency and productivity measurement of rural township hospitals in China: a bootstrapping data envelopment analysis. BMJ open, 6(11), e011911.
Flokou, A., Aletras, V., & Niakas, D. (2017). A window-DEA based efficiency evaluation of the public hospital sector in Greece during the 5-year economic crisis. PloS one, 12(5), e0177946.
Ghaem Panah, M., & Alaedin, F. (2002). Establishment of performance-based management in hospital
emergency Zyayyan. Tehran: Institute of Health Researchers.
Jia, T., & Yuan, H. (2017). The application of DEA (data envelopment analysis) window analysis in the assessment of influence on operational efficiencies after the establishment of branched hospitals. BMC health services research, 17(1), 265.
Moradi, G., Piroozi, B., Safari, H., Nasab, N. E., Bolbanabad, A. M., & Yari, A. (2017). Assessment of the efficiency of hospitals before and after the implementation of health sector evolution plan in Iran based on Pabon Lasso model. Iranian journal of public health, 46(3), 389.