Publication Date: July. 25, 2018
DOI: 10.14738/abr.67.4903.
Dunlop, M. (2018). The College Scorecard, College Rankings, and Return on Investment. Archives of Business Research, 6(7), 119-135.
The College Scorecard, College Rankings, and Return on
Investment
Michael Dunlop, MBA, Ed.D.
Instructor of Information Systems & Operations Management Sawyer Business School, Suffolk University
ABSTRACT
This paper explores the relationship between the College Scorecard, college ranking systems, and return on investment. Historically, there has been an emphasis, as well as popularity in ranking higher education institutions in terms of quality and job outcomes. This study utilized data from the United States Department of Education’s Federal College Scorecard and institutional ranking data from College Factual. A multiple regression analysis was used on the dependent variable of salary after attending, with the independent variables of college rank, graduation rate, and average annual cost. Best subsets regression modeling was used to determine the significance for each of the overall regression models, as well as the significance for each of the independent variables. The study included higher education institutions in the state of Massachusetts, USA. Analysis of the results offer several practical applications, interpretations, as well as recommendations for future research.
Keywords: College Scorecard, College Rankings, Higher Education Return on Investment
INTRODUCTION
Institutions of higher education are increasingly being assessed on their ability to generate a positive return on investment (ROI) for their graduates. Transparency in higher education in terms of economic return is important. Fortunately, there has been momentum within the higher education landscape where “parents, students, college leaders, journalists, policy makers, and researchers are now empowered to more empirically evaluate thousands of U.S. post-secondary institutions in terms of their contributions to student economic success” (Rothwell, 2015a).
A variety of stakeholders use the ROI and similar metrics in the college decision-making process. Yet, with the increased interest and emphasis on rating related metric criteria, a single standardized rating criterion is difficult to obtain. College decision-making should include an analysis of a variety of resources and institutional attributes, which are unique to each student and family. However, it can be overwhelming given the multitude of data that exists within higher education. Of particular importance are the numerous studies that have addressed the growing need to quantify the ROI of colleges and universities. A leading resource is the United States Department of Education’s interactive College Scorecard. The Scorecard provides students and families with useful data to make more informed decisions on higher education institutions. The launch of the Scorecard in 2013 illustrated former President Barack Obama’s commitment to provide consumers with information about college costs and value in an easy-to-read format (U.S. Department of Education, 2013).
important to note, that collectively these trends hold true, but on an individual level, students majoring in fields in high demand (such as the “STEM” disciplines of Science, Technology, Engineering, & Math) are doing fairly well (Abel, et. al., 2014).
Many factors can be used to assess the value of a baccalaureate degree at a particular higher education institution. This study specifically explored the College Scorecard and the specific constructs of average annual cost, graduation rate, and salary after attending. In addition to the Scorecard, each institution’s respective college rank was also analyzed using college ranking data from College Factual.
The College Scorecard
In 2013, former President Barack Obama as part of his State of the Union address, announced the increased need for transparency in higher education, which precipitated the inception of The College Scorecard (Rothwell, 2015a). Designed as a resource for students and families, the Scorecard is a tool to help navigate the pros and cons of a particular institution. One caveat, is that the Scorecard only accounts for those students who receive some form of federal financial aid. Yet, Rothwell (2015a) still asserts that the Scorecard is a valuable asset to the public and should be continued with annual updates that reflect new data. In addition to basic information such as average annual cost and graduation rate, Turner (2015, para. 6) agrees that “there’s also lots of useful new information; you can now see how much students earn 10 years after entering a school (thanks to a joint effort between the departments of Education and the Treasury).” The three constructs used in this study were based on the Scorecard’s average annual cost, graduation rate, and salary after attending, respectively.
The Average Annual Cost.
The Scorecard, quantifies the “average annual cost” as the average annual net price (cost) for federal financial aid recipients, after aid from the school, state, and/or federal government. For public higher education institutions, the tuition was calculated using the in-state student rate.
Graduation Rate.
The Scorecard, measures “graduation rate” as those students who graduate within six years upon entering college as a first-year student.
Salary After Attending.
The Scorecard, calculates “salary after attending” as the median earnings of former students who received federal financial aid, at 10 years after entering the college as a first-year student. Further explanation of these Scorecard constructs were provided by Chingos and Whitehurst (2015), where they pointed out that the Scorecard was only reflective of those students who received federal financial aid. The first construct on the Scorecard is the average annual cost. Net of any federal, state, and institutional grant aid; this cost to students includes tuition, fees, books, supplies, room, and board. The tuition at public institutions use the in-state tuition rate. Therefore, the remaining amount represents the average annual cost, including loans, a student must contribute from their own financial resources. The second construct of graduation rate accounts for the proportion of first-year, full-time students who, upon initial full-time enrollment, graduate within six years. Finally, the construct of salary after attending is the median earned income of students 10 years after initial enrollment.
Copyright © Society for Science and Education, United Kingdom 121
attending was gathered from different information sources and managed by different U.S. Department of Education offices (Chingos and Whitehurst, 2015).
One of the Scorecard’s major weaknesses was that it only reports earnings data on undergraduate students who receive federal financial aid, which approximately applied to half of all students (Rothwell, 2015b). The New England Board of Higher Education (2016) makes it clear that “significant variation exists from student to student and college to college in terms of the sources and amounts of financial aid, which can make predicting and tracking what students pay difficult” (p. 2). Nevertheless, “there is no doubt that the Scorecard is a leap forward from previous government data collections on colleges and universities, which focused on inputs such as number of faculty and student characteristic and the immediate outcomes of retention and graduation rather than longer term outcomes including earnings in the labor market” (Chingos and Whitehurst, 2015, para. 9).
College Ranking Systems
College ranking systems can serve as a simple and quick way to find a college or university that meet certain search criteria (Campus Explorer, 2018). Although college rankings are intended to help prospective students in their search for top colleges, often overlooked are schools that are especially strong in specific majors or programs (Campus Explorer, 2018). There is an inherent popularity of ranking institutions with a convenient ordinal numbering system. Numerous college ranking systems have conveniently ranked institutions, often with their own weighted metrics, underlying assumptions, and other subjectively derived underpinnings. All of this in an attempt to objectively quantify a school’s respective rank in comparison to the competition. Campus Explorer (2018) is quick to mention that many of the popular college ranking systems are inherently biased and utilize vague ranking criteria. Such arbitrary measures raise questions to the legitimacy of using a college ranking system.
And, there have been several popular and well established, albeit debatable, rating systems developed and promulgated by organizations such as U.S. News and World Report, the Princeton Review, Forbes College Rankings, and College Factual, to name a few. College rankings often overlook more tangible outcomes, including job placements and the quality of those job placements (Campus Explorer, 2018).
On the other hand, Carey (2007) draws an analogy between reducing institutions to a single number with the reality of the consumer marketplace; where full-time students can only choose to attend one single university. No one can ever fully comprehend the totality of an institution as rich and complicated as a university, yet as long as ranking systems maintain transparency in the underlying data elements and their respective weights, then this can facilitate comprehension and comparison (Carey, 2007).
College Factual
“Student Body Caliber
1. Average test scores (high impact) – the average of the 25th and 75th percentile math and reading SAT scores as reported by IPEDS is calculated” (para. 2).
“Educational Resources
2. Average faculty compensation (medium impact) – competitive salaries and benefits can attract the best of the best to a college or university.
3. Expenditures per student (medium impact) – this is focused on spending that can directly benefit students, such as instruction, academic support, research and student services.
4. Student to faculty ratio (low impact) – the student to faculty ratio measures how many students each instructional faculty member must support on average (a lower ratio is preferred).
5. Percent full-time teachers (low impact) – this metric includes all instructional employees, including adjuncts, which gives a more complete measure of how many teachers are focused on full-time instruction” (para. 3).
“Degree Completion
6. Freshmen retention rate (high impact) – the higher the number of freshmen returning to the same school for their sophomore year the better.
7. Six year graduation rate (high impact) – this measures the percent of students that started as freshmen and graduated with their four-year degree from a given school within six years after starting (a higher graduation rate is preferred).
8. Expected vs. actual graduation rate (low impact) – this metric accounts for the fact that colleges with highly selective acceptance rates are more likely to have higher
graduation rates. Since this may be more reflective of the student and not the
institution, a higher than expected graduation rate is indicative that the school is doing a good job at graduating students” (para. 4).
“Post-Graduation Earnings
9. Student loan default rate (high impact) – a large majority of students rely on student loans to earn a degree, with the expectation that their education will provide them with gainful employment opportunities. Therefore, the lower the default rate on student loans the better.
10.Starting salary boost (medium impact) – this measures the college’s impact on early career earnings, with a comparison of specific majors from college to college. 11.Mid-career salary boost (medium impact) – this metric is similar to the early career
earnings, however, this is focused more on the longer term impact the college might have on mid-career earnings” (para. 5).
Return on Investment
Copyright © Society for Science and Education, United Kingdom 123
and a college education includes returns that extend far beyond the obvious monetary ones (Payscale, 2018).
From an economic perspective, finding a particular educational institution’s return on investment (ROI) is challenging. Yet, the financial aspects of evaluating college ROI cannot be ignored (Payscale, 2018). “College is now the second-largest financial expenditure for many families, surpassed only by purchasing a home, so it isn’t surprising that taking an in-depth look at the costs and payoffs of a particular college is of paramount importance” (Money, 2015, para. 1). Dickler (2017) agrees that aside from purchasing a home, college is now the second-largest expense an individual will make during their lifetime. Vasel (2014) echoes a similar sentiment that, aside from buying a home, college tuition is the biggest expense most people face, yet while most buyers know the total cost involved in buying a home and can plan accordingly, consumers rarely know the final price tag of a college education. Conversely, and based on the fact that as college tuition prices continually outpace inflation and student loan levels reach record highs, more colleges and universities are offering fixed-rate tuition plans (Vasel, 2014). Regardless of future tuition trends, the fact still remains that college is an investment and maximizing one’s return on that investment is imperative. “When you’re trying to determine which college you can afford, the most important number is the school’s ‘net price;’ and that is why every college offering federal financial aid programs is required to provide a Net Price Calculator on its website, and why you should understand how to incorporate this handy tool into your college planning research” (Massachusetts Educational Financing Authority, n.d., para. 1). U.S. News and World Report (2017) provides further information on every college and university with respect to their online net price calculators. Even though these net price calculators are helpful, they only account for the investment (cost) and not the short and longer term financial gains (benefits). From this cost-benefit perspective, “many graduates expressed buyer’s remorse regarding their education, according to a recent study where 57 percent of students said they regret taking out as many loans as they did, and 36 percent said they would not have gone to college if they fully understood the associated costs” (Dickler, 2016, para. 4). A compounding factor is that student debt is still rising for new graduates, according to a 2014 report released by the Project on Student Debt at The Institute for College Access and Success (TICAS). “At public and nonprofit colleges in 2014, seven in 10 graduating seniors (69%) had student loans, and their average debt was $28,950; up two percent compared to the Class of 2013” (TICAS, 2014, p. 1). Lindsay (2018), in a new report claims the dire student-loan debt crisis in the U.S. has increased the default rate. However, there is evidence that suggests that the type of degree completed may be a more relevant factor related to the default rather than the amount students borrow (Lindsay, 2018). “The reason total debt is not related to the likelihood of default is because while borrowing more may make it difficult to repay one’s loans, students who complete degrees also borrow more than students who drop out, and degree completion is a major factor related to default” (Velez, 2018. Para. 8). Velez (2018) found that “students who obtained a bachelor’s degree borrow more than their counterparts who obtain an associate’s degree or certificate; and those that drop out of college borrow less, on average, than those who attain a bachelor’s or associate’s degree, but more than those who attain a certificate” (para. 9).
Dunlop (2016) calculated the NPV (net present value) of institutions in Massachusetts using salary after attending compounded over 10 years. This 10-year NPV is an important ROI calculation since a majority of graduates face important financial challenges within the first decade after graduation, such as paying off student loans, purchasing a first home, and starting a family (Dunlop, 2016).
far more than where they study it” (para. 13). Schneider further emphasizes that “graduates with degrees in technology, math and engineering are at the top of the earnings distribution – and graduates with these degrees from regional campuses probably will earn far more than their peers with liberal arts degrees from the nation’s most prestigious campuses (2016, para. 14). These types of claims arguably call into question the legitimacy and usefulness of college ranking systems. Rothwell (2015b) states that no ranking system is perfect and there are many limitations and caveats of any such system. However, Rothwell also asserts that value-added measures may assist in filling information voids and still be useful strategy tools focused on improving higher education quality, as well as identifying institutions that are contributing the most to student economic advancement. The American Institutes for Research developed a tool entitled College Measures in an effort to increase student success by making data more useful and usable (n.d.). “College Measures has a commitment to improving higher education in the United States, and operates under the belief that data is underexposed and underused by students, parents, policymakers, and even by institutions themselves” (n.d., para. 2). “Through its Economic Success Metrics (EMS) Project, College Measures assists state agencies in their efforts to make information about the earnings of graduates from their higher education programs publicly accessible” (Institute for Higher Education Policy, 2016, p. 1).
METHODOLOGY
This study focused on elements from the U.S. Department of Education’s College Scorecard and college ranking data provided by College Factual. These open-access data sets provided further insight into several important, and often debatable, measures of college quality and the metric quantification of economic factors at a particular educational institution. Given that there is no agreed-upon single measure, this study investigated various constructs related to an institution’s ROI.
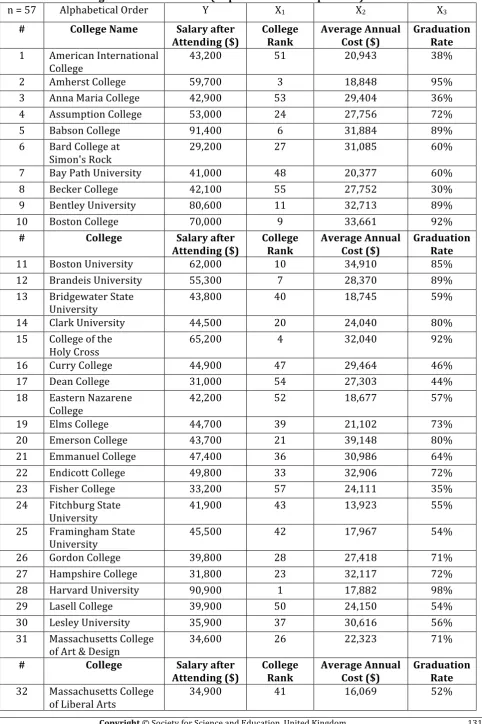
Based on the delimitations of the study, the usable sample size was 57 (n = 57). Table 1 summarizes the column descriptions for the dependent and independent variables. Table 2 (Appendix) provides a complete and detailed list of all 57 institutions included in the study. The column descriptions for Table 1 included the following:
Table 1: College Data and Variables (Dependent and Independent) – Summary Table
n = 57 Alphabetical Order Y X1 X2 X3
# College Name Salary after Attending ($)
College Rank
Average Annual Cost ($)
Graduation Rate
Constructs
The operational constructs in this study included the dependent and independent variables. The dependent variable, Y, of “salary after attending,” was measured by the College Scorecard. The dependent variable was correlated against the independent variables of “college rank,” “average annual cost,” and “graduation rate;” X1, X2, and X3 respectively. All of the independent variables were derived from the College Scorecard, expect for college rank, which was calculated by College Factual.
The multiple regression equation was stated as follows:
Y = b
0 + b1X1 + b2X2 + b3X3 Where:
Y= dependent variable (response variable)
Copyright © Society for Science and Education, United Kingdom 125
b
0= intercept (value of Y when all X’s = 0) b1,2,3= coefficient of each independent variable
Procedures
A multiple regression analysis with all three independent variables was initially conducted. Then stepwise regression via backward elimination was used to determine the best subset regression model. Based on the successive regression models, each of the independent variables p-value was tested at a confidence level of 95% (alpha, α = 0.05).
Research Hypothesis.
The hypothesis for the overall regression model was stated as: Null Hypothesis:
H
0:
b
1=
b
2=
b
3
= 0
Alternative Hypothesis:
H
1:
At least oneb
i is not zeroThe hypothesis for the overall regression model was tested, at a confidence level of 95%, by comparing the Significance F (p-value) to the significance level 0.05 (alpha, α = 0.05).
Delimitations
This study researched four-year undergraduate higher education institutions located in the state of Massachusetts using the College Scorecard, as well as ranking data from College Factual. In order for an institution to be included in the study, the institution must have complete Scorecard information on all three constructs (average annual cost, graduation rate, & salary after attending) and must be ranked in College Factual.
The College Scorecard.
Based on the constructs of average annual cost, graduation rate, and salary after attending, this study was delimited based on the following Scorecard search criteria:
Degree = 4 year (Bachelor’s)
Control = Public and Private (non-profit) Size = Any
Program = Any
Location = Massachusetts
Excluded = For-profit controlled institutions and institutions with incomplete data available
College Factual.
Each institution that had complete Scorecard data was cross-referenced with College Factual ranking data. Any institution not ranked by College Factual was excluded from the study. Since this study only included institutions located in the state of Massachusetts, the Microsoft Excel function “Rank.EQ” was used to properly rank order the 57 institutions included in the study. This critical function returns the rank of a number in a list of numbers with its size relative to other values in the list.
RESULTS
The adjusted R2 statistic and the Significance F (p-value) were both used to identify the best regression model. Furthermore, the p-value for each independent variable was computed for all of the regression model subsets and tested for statistical significance. All of the statistical tests were conducted at 95% confidence levels (α = 0.05).
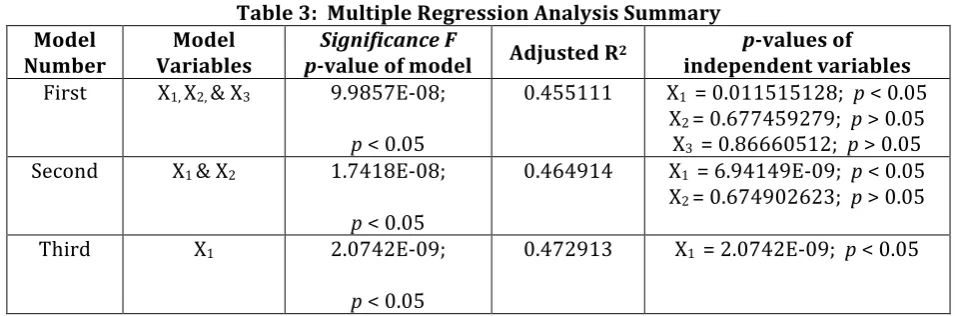
Table 3 overviews the multiple regression analyses and the key metrics that were calculated for each regression model. The dependent variable (Y) was salary after attending and the three independent variables were X1 as college rank, X2 as average annual cost, and X3 as graduation rate. The first regression model included all three independent variables (X1, X2, & X3). The second regression model eliminated the X3 variable, and therefore, only included two variables (X1 & X2). After eliminating the X2 variable; the third, and final, regression model was found to be the best model and included only the X1 variable of college rank.
Table 3: Multiple Regression Analysis Summary Model
Number
Model Variables
Significance F
p-value of model Adjusted R2
p-values of independent variables
First X1, X2, & X3 9.9857E-08;
p < 0.05
0.455111 X1 = 0.011515128; p < 0.05
X2 = 0.677459279; p > 0.05
X3 = 0.86660512; p > 0.05
Second X1 & X2 1.7418E-08;
p < 0.05
0.464914 X1 = 6.94149E-09; p < 0.05
X2 = 0.674902623; p > 0.05
Third X1 2.0742E-09;
p < 0.05
0.472913 X1 = 2.0742E-09; p < 0.05
Copyright © Society for Science and Education, United Kingdom 127 Table 4: MS Excel Summary Output: College Rank
SUMMARY OUTPUT
Regression Statistics
Multiple R 0.694496
R Square 0.482325
Adjusted R
Square 0.472913
Standard Error 11117.64
Observations 57
ANOVA
df SS MS F Significance F
Regression 1 6.33E+09 6.33E+09 51.2442201 2.0742E-09
Residual 55 6.8E+09 1.24E+08
Total 56 1.31E+10
Coefficients Standard Error t Stat P-value Lower 95% Upper 95%
Intercept 69795.43 2984.318 23.3874 2.9613E-30 63814.7195 75776.13
College Rank -640.738 89.50716 -7.15851 2.0742E-09 -820.113978 -461.361
The “XY” scatterplot which depicts the relationship between the independent variable of college rank (X1) and the dependent variable of salary after attending (Y) is illustrated in Figure 1. The Appendix includes “XY” scatterplots (Figure 2 and Figure 3) for the other two independent variables of average annual cost and graduation rate, respectively.
Figure 1: College Rank Plotted Against Salary After Attending
Another important analysis determined if there was any explanatory relationship among the independent variables. Generally, a correlation coefficient of +/- 0.70 may indicate multicollinearity. Table 7 summarizes all three independent variables and their corresponding relationships. From the table, it appears that there was a strong negative relationship between the independent variables of graduation rate (X3) and college rank (X1). In other words, the value of -0.9386 indicates that higher graduation rates are correlated with a lower college rank (where #1 was the best rank and #57 was the worst rank).
Table 7: Multicollinearity Analysis
College Rank Average Annual Cost Graduation Rate
College Rank 1
Average Annual Cost -0.322855597 1
Graduation Rate -0.938622603 0.302394701 1
0 50,000 100,000
0 20 40 60
Sa
la
ry
a
ft
er
A
tt
en
di
ng
College Rank
College Rank Line Fit Plot
Salary after Attending
CONCLUSION
Given the need for greater transparency in higher education and the popularity of quantitatively derived metrics, the results of this study provided further insight into several important variables. Information was gleaned by analyzing the data elements of salary after attending, average annual cost, and graduation rate, which was enumerated by the College Scorecard. Additional insight was collected upon analysis and investigation of College Factual’s rank ordering of higher education institutions in the state of Massachusetts, USA.
Multiple regression analysis and stepwise regression provided several model subsets. The best regression model subset was identified by calculating the statistical significance of each regression model’s Significance F and adjusted R2 values. In addition, p-values were computed in order to determine which independent variables were statistically significant. Finally, multicollinearity analysis was conducted to determine if relationships existed among the independent variables.
In summary, and despite the challenges of a one-size fits all methodology when determining the return on investment (ROI) of a particular higher education institution, this study provided evidence that college ranking systems are useful in determining an institution’s ROI. This study provides a framework for conducting similar future analyses. Not only could this study be replicated by using Scorecard data from other states, it could also use data provided by other ranking systems (e.g., the Princeton Review, Forbes College Rankings, etc.). Additionally, future research could expand to include other types of institutions (e.g., two-year colleges, for-profit/proprietary, etc.), as well as specific programs of study. Furthermore, international higher education systems could conduct similar research based on the techniques and metrics offered in this study.
References
Abel, J., Deitz, R., and Su, Y. (2014). Are recent college graduates finding good jobs. Federal Reserve Bank of New York. Current Issues in Economics and Finance, 20(1). Retrieved from
https://www.newyorkfed.org/medialibrary/media/research/current_issues/ci20-1.pdf
American Institutes for Research (n.d.). Improving higher education outcomes in the United States. American Institutes for Research, College Measures. Retrieved from https://www.air.org/center/college-measures/ Campus Explorer (2018). The pros and cons of using college rankings. Campus Explorer. Retrieved from https://www.campusexplorer.com/college-advice-tips/24CA24E9/The-Pros-and-Cons-of-Using-College-Rankings/
Carey, K. (2007). In defense of college rankings. American Institutes for Research. Retrieved from https://www.air.org/edsector-archives/publications/defense-college-rankings
Chingos, M. and Whitehurst, G. (2015). Deconstructing and reconstructing the College Scorecard. The Brookings Institution, October 15, 2015. Retrieved from https://www.brookings.edu/research/deconstructing-and-reconstructing-the-college-scorecard/
College Factual (2018). Best colleges: Massachusetts. College Factual. Retrieved from https://www.collegefactual.com/rankings/best-colleges/new-england/massachusetts/ College Factual (n.d.). College Factual FAQ. College Factual. Retrieved from
https://inside.collegefactual.com/faq/#who-is-college-factual
College Scorecard (n.d., a). U.S. Department of Education, College Scorecard. Retrieved from https://collegescorecard.ed.gov/
College Scorecard (n.d., b). College Scorecard Communications Toolkit. Retrieved fromhttps://collegescorecard.ed.gov/assets/College-Scorecard-Toolkit.pdf
Copyright © Society for Science and Education, United Kingdom 129
Dickler, J. (2017). Student loan balances jump nearly 150 percent in a decade. CNBC, College Game Plan, August 29, 2017. Retrieved from https://www.cnbc.com/2017/08/29/student-loan-balances-jump-nearly-150-percent-in-a-decade.html
Dunlop, M. (2016). The College Scorecard and return on investment: A net present value analysis of business schools in Massachusetts. The New England Journal of Higher Education. August 9, 2016. Retrieved from http://www.nebhe.org/thejournal/the-college-scorecard-and-return-on-investment/
Ed Quest (2017). A College Ranking source admits that college rankings are misleading while publishing
misleading rankings. Educated Quest. January 5, 2017. Retrieved from https://www.educatedquest.com/college-ranking-source-admits-college-rankings-misleading-publishing-misleading-college-ranking/
Hout, M. (2012). Social and economic returns to college education in the United States. The Annual Review of Sociology, Volume 38, 2012, 379-400. Retrieved from
https://www.collegetransitions.com/wp-content/uploads/2014/05/hout-returns-to-college-education.pdf
Institute for Higher Education Policy (2016). College measures economic success metrics project. Institute for Higher Education Policy, Fact Sheet, March 2016. Retrieved from
http://www.ihep.org/sites/default/files/uploads/postsecdata/docs/resources/ihep_factsheet_economicmetrics_ final.pdf
Lindsay, T. (2018). New report: The U.S. student-loan debt crisis is even worse than we thought. Forbes, May 24, 2018. Retrieved from https://www.forbes.com/sites/tomlindsay/2018/05/24/new-report-the-u-s-student-loan-debt-crisis-is-even-worse-than-we-thought/#5e1c5147e438
Massachusetts Educational Financing Authority (n.d.). Using net price calculators. Massachusetts Educational Financing Authority. Retrieved from https://www.mefa.org/using-net-price-calculators/
McWilliam, J. (2013). An overview of College Factual’s best colleges rankings. College Factual, March 27, 2013. Retrieved from https://inside.collegefactual.com/methodologies/best-colleges-rankings-overview
Money Magazine (2015). How Money ranked colleges: An in-depth look at our methodology. Money Magazine, Family Finance, July 13, 2015. Retrieved from
http://time.com/money/3952002/best-colleges-money-methodology
New England Board of Higher Education (2016). New England Fast Facts, the Price of Public Colleges in New England, March 2016. Retrieved from
http://www.nebhe.org/info/pdf/policy/New_England_Fast_Facts_Public_Tuition_Region_States_2015-16.pdf Payscale (2018). 2018 College ROI Report: Best Value Colleges. Retrieved from
https://www.payscale.com/college-roi
Rothwell, J. (2015a). Understanding the College Scorecard. The Brookings Institution, September 28, 2015. Retrieved from https://www.brookings.edu/opinions/understanding-the-college-scorecard/
Rothwell, J. (2015b). Using earnings data to rank colleges: A value-added approach updated with College Scorecard data. The Brookings Institution, October 29, 2015. Retrieved from
https://www.brookings.edu/research/using-earnings-data-to-rank-colleges-a-value-added-approach-updated-with-college-scorecard-data/
Schneider, M. (2016). Best colleges don’t guarantee higher pay, better life. American Institutes for Research, January 11, 2016. Retrieved from https://www.air.org/resource/best-colleges-dont-guarantee-higher-pay-better-life
The Institute for College Access and Success (2015). Student loan debt averages $28,950 for class of 2014. The Institute for College Access and Success, the Project on Student Debt, October 27, 2015. Retrieved from
https://ticas.org/sites/default/files/pub_files/student_debt_and_the_class_of_2014_nr_0.pdf
Turner, C. (2015). President Obama’s new ‘College Scorecard’ is a torrent of data. National Public Radio, Inc., September 12, 2015. Retrieved from https://www.npr.org/sections/ed/2015/09/12/439742485/president-obamas-new-college-scorecard-is-a-torrent-of-data
U.S. News & World Report (2017). Find out your net price of college. U.S. News & World Report, Education, November 27, 2017. Retrieved from https://www.usnews.com/education/best-colleges/features/net-price-calculator
Vasel, K. (2014). Demystifying college costs: Fixed-rate tuition plans. FOX Business, College Planning, January 17, 2014. Retrieved from https://www.foxbusiness.com/features/demystifying-college-costs-fixed-rate-tuition-plans Velez, E. (2018). Newly released student loan data bust several myths about student loan repayment. The EvoLLLution, Today’s Learner, May 9, 2018. Retrieved from
https://evolllution.com/attracting-students/todays_learner/newly-released-student-loan-data-bust-several-myths-about-student-loan-repayment/
APPENDIX TABLES AND FIGURES
Tables
Table 1: College Data and Variables (Dependent and Independent) – Summary Table
n = 57 Alphabetical Order Y X1 X2 X3
# College Salary after
Copyright © Society for Science and Education, United Kingdom 131 Table 2: College Data and Variables (Dependent and Independent) – Detailed Table
n = 57 Alphabetical Order Y X1 X2 X3
# College Name Salary after
Attending ($) College Rank Average Annual Cost ($) Graduation Rate
1 American International
College 43,200 51 20,943 38%
2 Amherst College 59,700 3 18,848 95%
3 Anna Maria College 42,900 53 29,404 36%
4 Assumption College 53,000 24 27,756 72%
5 Babson College 91,400 6 31,884 89%
6 Bard College at
Simon's Rock
29,200 27 31,085 60%
7 Bay Path University 41,000 48 20,377 60%
8 Becker College 42,100 55 27,752 30%
9 Bentley University 80,600 11 32,713 89%
10 Boston College 70,000 9 33,661 92%
# College Salary after
Attending ($) College Rank Average Annual Cost ($) Graduation Rate
11 Boston University 62,000 10 34,910 85%
12 Brandeis University 55,300 7 28,370 89%
13 Bridgewater State
University 43,800 40 18,745 59%
14 Clark University 44,500 20 24,040 80%
15 College of the
Holy Cross
65,200 4 32,040 92%
16 Curry College 44,900 47 29,464 46%
17 Dean College 31,000 54 27,303 44%
18 Eastern Nazarene
College 42,200 52 18,677 57%
19 Elms College 44,700 39 21,102 73%
20 Emerson College 43,700 21 39,148 80%
21 Emmanuel College 47,400 36 30,986 64%
22 Endicott College 49,800 33 32,906 72%
23 Fisher College 33,200 57 24,111 35%
24 Fitchburg State
University 41,900 43 13,923 55%
25 Framingham State
University 45,500 42 17,967 54%
26 Gordon College 39,800 28 27,418 71%
27 Hampshire College 31,800 23 32,117 72%
28 Harvard University 90,900 1 17,882 98%
29 Lasell College 39,900 50 24,150 54%
30 Lesley University 35,900 37 30,616 56%
31 Massachusetts College
of Art & Design 34,600 26 22,323 71%
# College Salary after
Attending ($)
College Rank
Average Annual Cost ($)
Graduation Rate
32 Massachusetts College
33 Massachusetts Institute of Technology
94,200 2 22,968 92%
34 Massachusetts
Maritime Academy 79,300 25 17,224 71%
35 Mount Holyoke
College 46,100 17 23,760 83%
36 Nichols College 48,100 49 27,124 46%
37 Northeastern
University 64,000 15 28,869 83%
38 Pine Manor College 35,600 56 22,810 32%
39 Regis College 45,300 38 26,083 46%
40 Salem State University 41,000 45 16,884 48%
41 Simmons University 49,000 22 29,461 70%
42 Smith College 44,900 14 27,880 87%
43 Springfield College 43,000 32 27,047 70%
44 Stonehill College 58,700 16 28,388 85%
45 Suffolk University 51,800 34 29,563 56%
46 Tufts University 66,500 5 29,565 93%
47 University of
Massachusetts Amherst
49,700 18 18,869 77%
48 University of
Massachusetts Boston 47,000 35 11,789 42%
49 University of
Massachusetts Lowell 50,800 29 18,005 55%
50 Wellesley College 60,100 12 25,429 92%
51 Wentworth Institute
of Technology 60,300 30 35,232 65%
52 Western New England
University
54,900 31 28,053 59%
# College Salary after
Attending ($) College Rank Average Annual Cost ($) Graduation Rate
53 Westfield State
University 43,900 46 16,808 63%
54 Wheaton College 46,700 19 31,172 78%
55 Williams College 54,100 8 23,924 95%
56 Worcester Polytechnic
Institute
82,600 13 37,002 85%
57 Worcester State
Copyright © Society for Science and Education, United Kingdom 133 Table 3: Multiple Regression Analysis Summary
Model Number
Model Variables
Significance F
p-value of model Adjusted R2
p-values of independent variables
First X1, X2, & X3 9.9857E-08;
p < 0.05
0.455111 X1 = 0.011515128; p < 0.05
X2 = 0.677459279; p > 0.05
X3 = 0.86660512; p > 0.05
Second X1 & X2 1.7418E-08;
p < 0.05
0.464914 X1 = 6.94149E-09; p < 0.05
X2 = 0.674902623; p > 0.05
Third X1 2.0742E-09;
p < 0.05
0.472913 X1 = 2.0742E-09; p < 0.05
Table 4: MS Excel Summary Output: College Rank
SUMMARY OUTPUT
Regression Statistics
Multiple R 0.694496
R Square 0.482325
Adjusted R
Square 0.472913
Standard Error 11117.64
Observations 57
ANOVA
df SS MS F Significance F
Regression 1 6.33E+09 6.33E+09 51.2442201 2.0742E-09
Residual 55 6.8E+09 1.24E+08
Total 56 1.31E+10
Coefficients
Standard
Error t Stat P-value Lower 95% Upper 95%
Intercept 69795.43 2984.318 23.3874 2.9613E-30 63814.7195 75776.13
Table 5: MS Excel Summary Output: College Rank & Average Annual Cost
SUMMARY OUTPUT
Regression Statistics
Multiple R 0.695718
R Square 0.484024
Adjusted R Square 0.464914
Standard Error 11201.68
Observations 57
ANOVA
df SS MS F Significance F
Regression 2 6.36E+09 3.18E+09 25.32803 1.7418E-08
Residual 54 6.78E+09 1.25E+08
Total 56 1.31E+10
Coefficients Standard Error t Stat P-value Lower 95% Upper 95%
Intercept 72891.43 7933.261 9.188078 1.25E-12 56986.1958 88796.66
College Rank -653.711 95.2865 -6.86048 6.94E-09 -844.749293 -462.673
Average Annual
Cost -0.10618 0.251767 -0.42172 0.674903 -0.61093893 0.398588
Table 6: MS Excel Summary Output: College Rank, Avg. Annual Cost & Graduation Rate
SUMMARY OUTPUT
Regression Statistics
Multiple R 0.695918
R Square 0.484301
Adjusted R Square 0.455111
Standard Error 11303.82
Observations 57
ANOVA
df SS MS F Significance F
Regression 3 6.36E+09 2.12E+09 16.59107 9.9857E-08
Residual 53 6.77E+09 1.28E+08
Total 56 1.31E+10
Coefficients Standard Error t Stat P-value Lower 95% Upper 95%
Intercept 76764.62 24303.36 3.158602 0.002618 28018.2662 125511
College Rank -695.52 265.705 -2.61764 0.011515 -1228.4566 -162.583
Average Annual
Cost -0.10626 0.254064 -0.41824 0.677459 -0.6158476 0.403327
Copyright © Society for Science and Education, United Kingdom 135 Table 7: Multicollinearity Analysis
College Rank Average Annual Cost Graduation Rate
College Rank 1
Average Annual Cost -0.322855597 1
Graduation Rate -0.938622603 0.302394701 1
Figures
Figure 1: College Rank Plotted Against Salary After Attending
Figure 2: Average Annual Cost Plotted Against Salary After Attending
Figure 3: Graduation Rate Plotted Against Salary After Attending 0
50,000 100,000
0 20 40 60
Sa la ry a ft er A tt en di ng College Rank
College Rank Line Fit Plot
Salary after Attending Predicted Salary after Attending 0 50,000 100,000
0 20,000 40,000 60,000
Sa la ry a ft er A tt en di ng
Average Annual Cost
Average Annual Cost Line Fit
Plot
Salary after Attending Predicted Salary after Attending 0 50,000 100,0000% 50% 100% 150%
Sa la ry a ft er A tt en di ng Graduation Rate
Graduation Rate Line Fit Plot
Salary after Attending