Development of a Decision Support System
for Road Maintenance Scheduling
Akindele Opeyemi Areegbe
1, Abiodun Alani Ogunseye
2,
Naheem Olakunle Adesina
3,
Thomas Kokumo Yesufu
41,2,3,4 Department of Electronic and Electrical Engineering, Obafemi Awolowo University,
Ile-Ife, Nigeria.
Abstract: The work developed and evaluated the performance of a vehicle vibration monitoring system for road maintenance scheduling. The developed system consist of an ADXL335 three-axis accelerometer to detect vehicle vibration; an Arduino Uno microcontroller board for data conditioning and storage; and a GPSMAP 78s Global Positioning System (GPS) receiver for obtaining the geographical coordinates of the location and the vehicle velocity. The developed system, attached to a test vehicle, samples the vehicle vibration signal, conditions, stores and sends the sampled data to a personal computer (PC) via a USB connection. The International Roughness Index (IRI) and Road Quality Index (RQI) of the test road sections were calculated from the standard deviation of the acquired vehicle vibration data with a MATLAB program running on the PC. The RQI result showed that the roads can be classified into excellent, smooth and rough road sections per selected road. For a selected road with five (5) classified sections having an overall “smooth” outlook, the highest and lowest value of RQIs were 1.691 and 1.436 respectively; for another selected road having an overall “rough” outlook with ten (10) classified sections, the highest and lowest RQIs were 1.940 and 0.000 respectively. The study concluded by developing a system that can be used to prioritize the maintenance of failing road sections. This can aid road maintenance agencies to schedule road maintenance work appropriately.
Keywords — Road Surface Roughness, Scheduling, Road Quality Index, Roughness index, microcontroller.
I. INTRODUCTION
The concept of maintenance is necessary in prolonging the life span of any system or infrastructure. One of such infrastructures which play a vital role in the economic, social and political development of any nation is the road network.
Road surface condition information is useful in the decision making processes of road users [1]. Road surface condition is generally described as the irregularity in the pavement surface that can
hence the comfort of the vehicle occupants. The irregularities in the form of potholes, road crack, bumps, expansion joints, can cause damage to vehicles, increase fuel consumption, increase road user cost, create unpleasant driving experience and cause traffic accidents [2].
Different technologies have been used for road anomalies and condition detection, of which the most prominent ones are vision based, radio based and vibration based methods. Vision based anomaly detection method uses digital camera as its main sensor. Koch and Brilakis in [3] presented a method for automated pothole detection in pavement images. Li et. al in [4] introduced a real-time system to detect road anomalies such as shoving, pothole etc, using laser scanning equipment and adigital camera. Jog et al. (2012) in [5] also presented a new approach of detecting and measuring road anomalies that is based on two-dimensional (2D) and three-dimensional (3D) image recognition using monocular camera. However, vision based approaches are costly and require high computation effort. They are also limited by the available illumination level and weather conditions.
Radio based method uses the principle of operation of ground penetrating radar. It can detect the internal damages in road pavements but it requires the use of specialized vehicles and expensive equipment [6].
Vibration based method can be phone-based or based on the use of a dedicated sensors like an accelerometer. The road anomaly is sensed as a vibration of a test vehicle that is driven through a road segment. This approach requires low processing time and has a low maintenance cost.
More recent works focus on using accelerometers for pothole detection. An accelerometer is a device which is able to detect both static and dynamic acceleration forces. The vibrations that occur, when a vehicle encounters a pothole on the road can be detected by accelerometers mounted on the vehicle. The test vehicle’s degree of vibration can be used to sense the roughness level and anomalies of the road surfaces. The information gathered will be useful for road maintenance.
The major drawbacks of the methods listed above are complex algorithm requirement and high computational errors due to arbitrary phone orientation for phone based method.
The scheduling of road maintenance requires timely information about the state of the road. This information can be difficult to obtain when it involves growing number of road sections with varying degrees of use at different environmental conditions.
Various road condition monitoring methods have been used but only few classified the roads according to their road roughness level. Therefore, a proactive road maintenance scheduling algorithm is desirable.
In this work, an accelerometer was used to measure the vibration level of a test vehicle travelling on varying road segments. The developed system classified the road segments according to their road roughness levels. This classification information is useful in prioritizing the maintenance of road segments.
II. METHODOLOGY
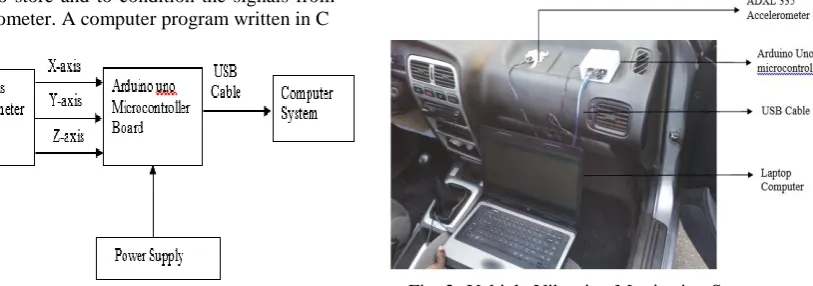
A vehicle vibration monitoring system comprising of a 3-axis accelerometer sensor (ADXL 335), an Arduino Uno microcontroller board and a USB cable (for serial communication) to the computer was developed. The block diagram of the system is shown in Fig. 1.
The 3-axis accelerometer was used to sense the vibration of a test vehicle moving on varying road segments. The Arduino Uno microcontroller board was used to store and to condition the signals from the accelerometer. A computer program written in C
Fig. 1: Block Diagram of the Developed System.
programming language was used to process the data from the microcontroller. Vibration data processed by the microcontroller was transmitted to the personal computer (PC) via serial communication using USB cable.
The Z-axis values of the vehicle vibration data were plotted and analyzed with MATLAB software. An algorithm was developed to classify the road roughness levels from the results computed in MATLAB.
The International Roughness Index (I.R.I), obtained from standard deviation (𝜎) of the vehicle vibration data, was given in [10] as
The distance covered by each test vehicle was calculated using haversine formula.
Where ‘d’ is the distance between two locations along the great circle, ‘r’ is the radius of the sphere (Earth),∅1 and ∅2 are latitudes of location 1 and location 2 respectively, and𝜆1, 𝜆2 are longitude of location 1 and location 2 respectively.
The average speed of the test vehicles is given by:
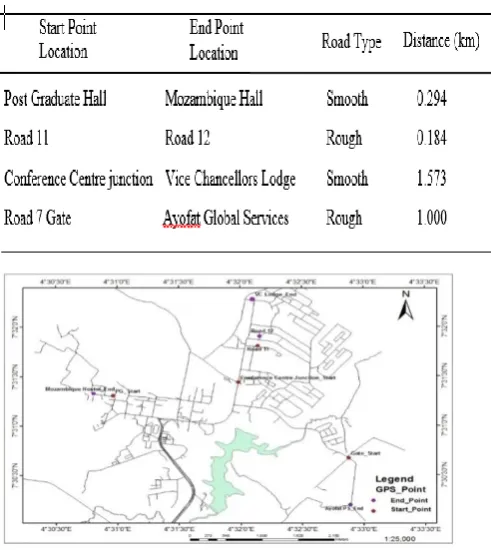
The vibration monitoring device was placed on the dashboard inside the test vehicle as shown in Fig. 2. Vehicle vibration data was obtained as the vehicle vibrated on varying road segments (i.e smooth and rough roads). The GPS receiver was used to obtain the coordinates of the various places where this work was carried out. This information was used in calculating the average speed of the test vehicles.
The test was conducted within and around Obafemi Awolowo University campus as shown on the Geographical Information System (G.I.S) map in Figure 3. The test vehicles are as follows: vehicle A
was a Nissan Primera saloon car; vehicle B was a Mercedes Benz 190E car; and vehicle C was a Honda Accord Bullet 2.0 model car. All the three test vehicles were used for the first stage of the test; vehicle A was chosen for the second stage of the test because of its good suspension system.
III. RESULTS AND DISCUSSIONS
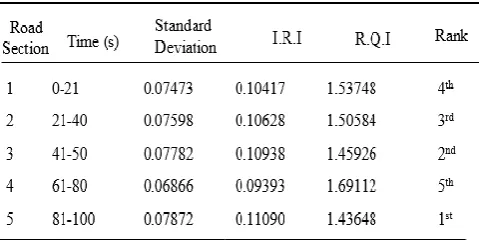
The GPS device was used to obtain the Latitude and Longitude in decimal degree for each test road locations. The measured coordinates of the locations are shown in Table 1. The various start and end point locations, road type and the distance calculated from the haversine formula in equation (2) with the corresponding G.P.S locations are shown are shown in Table 2.
Table 1: Locations of the Test Road
Table 2: Calculated Distance for the Test Road Locations.
Fig. 3: GIS Map of the Test Locations
Vehicle vibration data obtained when vehicles were stationary with the engine running, when the vehicles were moving on a selected smooth road and when the vehicles were moving on a selected rough road are shown in Table 3. It is to be noted that all acceleration measurements (including the calculated standard deviation) are in g-force, where 1g = 9.8m/s2.
Table 3: The Average Speed and accelerometer Standard Deviation for the Test Vehicles
A. Roughness Levels Classification Result
Vehicle A was used for the road roughness classification because its suspension system from the data analysis above is better than that of the other two vehicles. The road roughness level classification was achieved by plotting the Road Quality Index (RQI) against the International Roughness Index (IRI) as shown in Fig. 4.
The equation that relates the Road quality Index and I.R.I was generated from the line of best fit, is given by
Sectioning of the Road under Test
The second set of accelerometer data was acquired using vehicle A at two different locations. The first location for the smooth road was within O.A.U campus, from O.A.U Conference Centre junction to the tee junction towards the Vice
Chancellors Lodge. The road from Road 7 gate, O.A.U campus to Ayofat Global Service Limited Ile-Ife was chosen as the rough road section.
The vehicle vibration data was sectioned for every 20 seconds interval, as shown in Fig. 5 and Fig. 6. The International Roughness Index (IRI) was calculated using Equation (1), and Road Quality Index (RQI) was calculated from the International Roughness Index with Equation 4. The results for both smooth and rough road sections are shown in Tables 4 and 5.
Table 4: Standard Deviation, IRI and RQI when Vehicle A was moving on a Smooth Road.
Table 5: Standard Deviation, IRI and RQ.I used for ranking when Vehicle A was moving on a Smooth Road.
Fig. 5: Sectioned Accelerometer Data when vehicle A was moving on a Smooth Road.
Fig. 6: Sectioned Accelerometer Data when vehicle A was moving on a Rough Road.
B. Road Maintenance Scheduling
The Road Quality Index of the accelerometer data shown in Tables 4 and 5 was ranked in order of priority from the lowest value (roughest road segment) to the highest value (smoothest road segment). The result can serve as a vital information tool for road maintenance agencies to know the road surface condition of the particular road section under test. This will also influence in decision making processes for strategic road repair planning.
IV. CONCLUSION
A vehicle vibration monitoring device has been developed to estimate and classify road roughness levels when vehicles move on road segments. The system was tested with three different vehicles moving on different test road sections at various speeds and consistent results were obtained.
With maintenance and construction costs demanding a large portion of road management authority’s budgets, this work has presented a convenient and economical method of estimating road condition, using data harnessed from accelerometers mounted in a test vehicle. Once the test vehicle moves on the road, it is possible to generally classify the road as being excellent, smooth or rough thereby prioritizing the roads that need proper attention.
The advantages of this system, compared to existing systems, are low processing time, low maintenance cost and high flexibility for deployment due to its small size.
REFERENCES
[1] Dimpal, V. and Truph, D. (2014). Review of Estimation of Road Roughness condition from Smartphones.
[2] Viengnam, D. and Hiroyuki, O. (2013). A Study of Smartphones for Road Roughness Condition Estimation. Proceedings of the Asia Society for Transportation Studies, Tokyo, Japan. 9: 13.
[4] Li, Q., Yao, M., Yao, X and Xu, B. (2009). A real-time 3D Scanning System for pavement distortion inspection, measurement science and technology. 21: pp. 15702-15709.
[5] Jog G., Koch C., Brilakis I. (2012) Pothole properties measurement through visual 2D recognition and 3D reconstruction, in proceeding of ASCE international conference on computing in civil engineering. 10: 553-560.
[6] Taehyeong, K and Seung, R. (2014). Review and Analysis of Pothole Detection Methods. Journal of Emerging Trends in Computing and Information sciences. Vol. 5, No. 8, pp. 603-609.
[7] De Zoysa, K., Chamath, K., Gihan, P. and Shihan, W. (2007) A public transport system based sensor network for road surface condition monitoring. In NSDR '07: Proceedings of the 2007 workshop on networked systems for developing regions, New York, U.S.A. 3: 1-6.
[8] Erikson, J., Girod, L. and B. Hull. (2008). The pothole patrol: using a mobile sensor network for road surface monitoring, In Proceedings of the 6th International Conference on Mobile Systems, Applications, and Services 6: 29-39.
[9] Mohan, P., Padmanabhan, N. and Ramachandran R. (2008). Nericell: Rich monitoring of road and traffic conditions using mobile smartphones. In SenSys'08: Proceedings of the 6th ACM conference on Embedded network sensor systems, New York, USA. 6: 323-336.
[10] Lou, S., Wang, Y., and Xu, C. (2007). Study of calculation of IRI based on power spectral density of pavement surface roughness. Journal of Highway and Transportation Research and Development, 24: 12-15.