Modelling and Wavelet Based Analysis of
Stator Turn to Turn Fault in Induction Motor
Ramees Muhammed M K P
Assistant Professor, Department of EEE
SNG College of engineering and Technology, Payyanur, India Abstract—The aim of this paper is to present a new
approach for stator phase to phase fault detection in induction machines. This new method uses the infinity Norm of wavelet coefficients, obtained from n-level decomposition of each phase current to identify stator phase to phase faults in induction machines. The proposed algorithm can operate independent of the loading conditions. For the analysis, a mathematical model is developed which is valid for steady state and transient conditions. The
same has been simulated using
MATLAB/SIMULINK software and tested for stator phase to phase fault. Simulation results are provided to support the research. The results prove that it can constitute a useful tool for stator phase to phase fault detection.
Keywords—Condition monitoring, induction motors, wavelet, modeling of induction motor, turn to turn fault.
I. INTRODUCTION
Induction motors are widely used for both industrial and domestic applications. Protection of the induction motor against different possible incident faults would limit the fault duration and prevent motor catastrophic damage. An induction motor‘s failures can be attributed to either internal or external faults. Overloads, terminal voltage violation, and phase-failure represent some of the external evidences that may lead to motor failure. On the other hand, internal faults can be classified into mechanical faults and electrical faults. There are many condition monitoring methods [1-8] including vibration monitoring, thermal monitoring, chemical monitoring, acoustic emission monitoring etc. but all these monitoring methods require expensive sensors or specialized tools whereas current monitoring does not require additional sensors. This is because the basic electrical quantities associated with electromechanical plants such as current and voltage are readily measured by tapping into the existing voltage and current transformers that are always installed as part of the protection system. As a result, current monitoring is non-intrusive and may even be implemented in the motor control center remotely from the motors being monitored.
This paper presents a novel induction motor fault detection system. The method uses wavelet analysis to detect stator phase to phase fault. Specifically
Infinity Norm of wavelets coefficients were used for this purpose. After extensive simulations, it was determined that symlet wavelet is the best one to extract features for our fault-detection algorithm. In this armature current information is used for fault detection.
II. PROPOSED APPROACH
A wavelet based analysis [9-12] is used in this work to extract the feature from motor currents. Wavelet decomposition results in useful data contained in ‗details‘ and ‗approximate‘ parts. The ‗approximation‘ signal can be further decomposed into new set of ‗approximation‘ and ‗details‘ signals and continue until n decomposition levels are obtained. The ‗details‘ signal contains high frequency information approximate part contains signal data with the low frequency components. Computing this decomposition to n levels results in those higher detail parts being removed, thereby reducing the overall frequency characteristics of the resulting data. This implies that lower levels of decomposition provide detail data that contains the highest frequency components. Fault patterns are obtained from the information yielded by the n strategies. In this work a statistical analysis of the wavelet ‗details‘ coefficients is simplified block used as the basis for fault detection. Each level of the signal detail coefficients provides frequency resolution that allows unique signature characteristics to be deduced. In this work, the max norm of the wavelets coefficients is used to identify frequency anomalies in a given time range in the input data set.
A. Application of Wavelet Decomposition
Before the application of the wavelet transform (WT), first we must select the type of mother wavelet and the number of decomposition levels.
1. Selection of the Mother Wavelet
families can give the satisfactory results. In this case Symlet6 is used as the mother wavelet for the WT analysis.
2. Specification of the Number of Decomposition levels
The number of decomposition levels is determined by the low frequency components. For the extraction of the frequency components caused by turn to turn short circuit between phases the number of decomposition level Nf is given by the equation (1)
[13, 14].
𝑁𝑓= 𝑖𝑛𝑡𝑒𝑔𝑒𝑟 log
𝑓𝑠
𝑓
log 2 (1)
Considering, fs= 5000 samples/sec and f = 50 Hz,
using Equation (1) we can obtain Nf = 6. If fs (in
samples per second) are the sampling rate used for the signals, then the detail signal Dj contains the
signal components with frequencies in the interval.
𝑓 𝐷𝑗 ∈ 2− 𝑗 +1 . 𝑓𝑠, 2−𝑗. 𝑓𝑠 𝐻𝑧 (2)
𝑓 𝐴𝑛 ∈ 0, 2− 𝑛+1 . 𝑓𝑠 𝐻𝑧
The approximation signal An includes the low
frequency components of the signal belonging to the interval. According to Equation (2), the frequency bands associated with each wavelet signal are shown in Table 1. Therefore, the WT carries out the filtering process, where the filtering is not ideal which leads to overlap between the adjacent bands. This causes some distortion if frequency component of the signal is close to the limit of a band. To avoid overlapping between two adjacent frequency bands a high order mother wavelet are used. The Symlet (sym6) wavelet available in MATLAB® was used for analysis considering the above constrains.
TABLE 1
WAVELET DECOMPOSITION TREE
Decomposition Details Frequency bands(Hz)
Details at level 1 2500-1250 Details at level 2 1250-625 Details at level 3 625-312.5 Details at level 4 312.5-156.25 Details at level 5 156.25-78.125 Details at level 6 78.125-39.0625
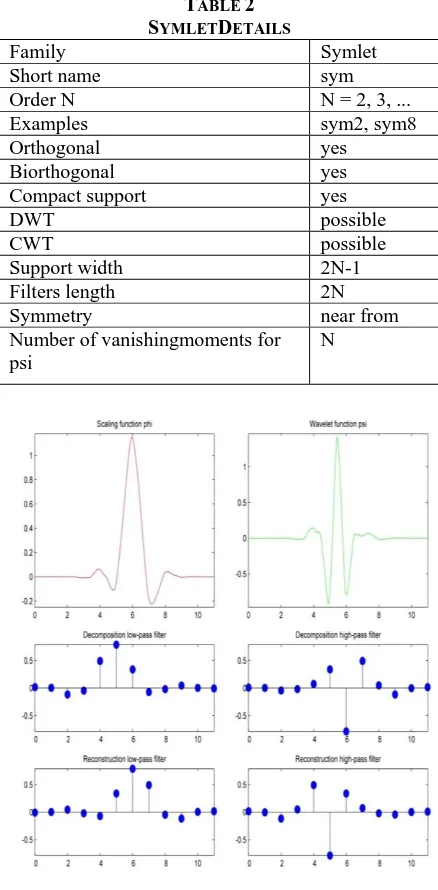
General characteristics of symlet is compactly supported wavelets with least asymmetry and highest number of vanishing moments for a given support width. Associated scaling filters are near linear-phase filters. Mother wavelet and scaling function is shown in Fig.1. Other details are given in Table 2. Max Norm of the wavelet coefficient is used for detecting the fault in this experiment. The
norm of a matrix is a scalar that gives some measure of the magnitude of the elements of the matrix. Max Norm or infinity norm gives largest row sum of the matrix.
TABLE 2 SYMLETDETAILS
Family Symlet
Short name sym
Order N N = 2, 3, ...
Examples sym2, sym8
Orthogonal yes
Biorthogonal yes
Compact support yes
DWT possible
CWT possible
Support width 2N-1
Filters length 2N
Symmetry near from
Number of vanishingmoments for psi
N
Fig. 1 Symlet6 mother wavelet and scaling function
III. IMMODEL WITH STATOR FAULT
a supply phase, and turn-turn short circuits inside the stator. The output of the derived model is compared to real measurements from a specially designed induction motor. With the model developed they simulated both terminal disconnections, inter-turn and turn-turn short circuits. This model is used here to develop and analyse the stator phase to phase fault detection and identification strategy.
Fig. 2 Simplified electrical diagram of a three-phase stator with a turn-turn fault
Setting up the mesh equations for the circuit in Fig.2 and rearranging these equations, a model describing a motor with a short circuit between phase a and b can be found. Using the matrix notation, The IM model with stator fault can be represented in a stationary reference frame qd, as follows: [17]
𝑉𝑠𝑑𝑞 = 𝑅𝑠 𝑖𝑠𝑑𝑞− 𝑇𝑑𝑞𝛾𝑖𝑓 +𝑑𝜑𝑠𝑑𝑞
𝑑𝑡 + 𝑉0 (3)
𝑉0= 𝑟𝑠 𝑖𝑠0−1
3𝑇0
𝑇𝛾𝑖
𝑓 +
𝑑𝜑𝑠0
𝑑𝑡 + 𝑉0 (4)
0 = 𝑅𝑟𝑖𝑟𝑑𝑞 +𝑑𝜑𝑟𝑑𝑞
𝑑𝑡 − 𝑧𝑝𝜔𝑟𝐽𝜑𝑟𝑑𝑞 (5)
0 = 𝑟𝑟𝑖𝑟𝑜+
𝑑𝜓𝑟𝑜
𝑑𝑡 (6)
𝑙𝑓𝑑𝑖𝑓
𝑑𝑡 = −𝑟𝑓𝑖𝑓+ 𝛾
𝑇𝑇
𝑑𝑞 0−1𝑉𝑠𝑑𝑞 0 (7)
Where the flux linkages are given by
𝜓𝑠𝑑𝑞 = 𝐿𝑠(𝑖𝑠𝑑𝑞− 𝑇𝑑𝑞𝛾𝑖𝑓) + 𝐿𝑚𝑖𝑟𝑑𝑞 (8)
𝜓𝑠𝑑𝑞 = 𝐿𝑠(𝑖𝑠𝑑𝑞− 𝑇𝑑𝑞𝛾𝑖𝑓) + 𝐿𝑚𝑖𝑟𝑑𝑞 (9)
𝜓𝑟𝑑𝑞 = 𝐿𝑟𝑖𝑟𝑑𝑞 + 𝐿𝑚(𝑖𝑠𝑑𝑞− 𝑇𝑑𝑞𝛾𝑖𝑓) (10)
𝜓𝑟0= 𝑙𝑙𝑟𝑖𝑟0 (11)
In these expressions Tdq0 consists of the two first
rows of Tdq0 and T0 consists of the last row of Tdq0.
The parameter matrices Rs, Rr, Ls,Lr, and Lm all
have diagonal structures, and are given by
𝑅𝑠 = 𝑟𝑠𝐼 ,𝑅𝑟 = 𝑟𝑟𝐼 , 𝐿𝑠 = 3
2𝑙𝑚 + 𝑙𝑙𝑠 𝐼 ,
𝐿 𝑟= (3
2𝑙𝑚 + 𝑙𝑙𝑟)𝐼 , 𝐿𝑚 = 3
2𝑙𝑚𝐼, 𝐽 = 0 −1 1 0
The parameters Ls and Lr are stator and rotor
self-inductances, lls and llr are stator and rotor leakage
inductances and Lm is mutual inductance. The vector γ in Equation (3-10) represents the position and the amount of turns in the short circuit. The vector is, in the case of a short circuit between phase a and b, given by the following equation.
𝛾 = 𝛾𝑎 −𝛾𝑏 0 𝑇 (12)
From the general torque expression an equation describing the torque in case of a turn-turn short circuit can be derived.
𝑇𝑒 = 𝑧𝑝(𝑖𝑠𝑎𝑏𝑐 − 𝛾𝑖𝑓)𝑇 𝜕𝑙𝑚(𝑧𝑝𝜃𝑟)
𝜕𝜃 𝑖𝑟𝑎𝑏𝑐 (13)
IV. SIMULATION
To validate the proposed method, an electrical model of the machine with stator turn fault has been developed and it is simulated using MATLAB/SIMULINK. The model is developed with ideal conditions. A three-phase, 2.2kW, 415V and 4.5A, 50Hz, 1440rpm, four pole induction motor was simulated. Motor parameters used for the simulation are shown in the Table 3.
TABLE 3 MOTOR PARAMETERS
Symbol Value Description
rs 4.2 Ω stator resistance
lls 12.4e-3 H stator leakage
inductance rr 2.35 Ω rotor resistance
llr 13.8e-3 H rotor leakage
inductance lm 664.5e-3 H mutual inductance
zp 2 number of pole pairs
jm 0.0023
kg·m2
moment of inertia
Simulink model of faulty motor is shown in Fig.3. ‗3_phase_2_phase‘ block convert the voltage in abc frame to dq0 frame. The reference frame chosen is stationary. The block currents_qd0_frame is used to calculate the stator current in dq0 frame from vsdq
Fig. 3 Simulink model of faulty motor (phase to phase fault)
The waveforms of the stator current, torque and speed obtained from simulation of healthy and faulty motor are shown in Fig.4 to Fig.11
Fig. 4 Load Torque
Fig. 5 Electromagnetic torque (healthy motor)
Fig. 6 Rotor Speed (healthy motor)
Fig. 7 Stator currents (healthy motor)
Fig. 8 Stator Currents (under constant load) (phase to phase fault)
Fig. 9 Electromagnetic Torque (under constant load) (phase to phase fault)
Fig. 11 Neutral voltage (under constant load) (phase to phase fault)
V. EXPERIMENTAL PROCEDURE
A. Experimental setup
The block diagram of experimental setup is show in Fig.12 First, it‘s healthy performance was analysed and, afterwards, connections were taken from stator winding as it is shown in Fig.2. Resistor is connected between shorted turns to change the fault current. The motor nameplate is shown as follows on Table 4 Load control has been implemented by using a belt and pulley arrangement. The stator current waveform obtained under phase to phase fault is shown in the Fig.13.
TABLE 4
MACHINE PARAMETERS OF INDUCTION MOTOR
Make Crompton Greaves Rated power 3 hp/2.2 kW Rated voltage 415 V Rated current 4.5 A Rated speed 1440 rpm
Fig. 12 Block diagram of experimental setup
Fig. 13 Stator currents (under constant load) (phase to phase fault) (experiment)
The data acquisition system consists of: three Hall Effect current sensors (LEM, LTA50P); three Hall Effect voltage sensor (LEM, LA 55-P) analog input board (National Instruments PCI 6251). The computational implementation runs in a LabVIEW environment.
When carrying out experimental analyses one of the key elements to obtain good results is to properly choose acquisition parameters. For this Data Acquisition Card (DAC) has to be configured properly. The acquisition parameters like sampling frequency and number of samples are chosen to have correct resolution for analysis. There are three constraints for this which is given below.
Analysis signal bandwidth
Wavelet decomposition spectral bands
Frequency resolution
Considering all these constraints the sampling frequency is chosen as 5000samples/sec. In this experiment the interfacing between sensor and CPU is done by using data acquisition card (PCI 6251) of NI make.
VI. SIMULATION AND EXPERIMENTAL RESULTS
In this section the simulation and experimental results are presented. The model derived in the section III is used for the simulation in MATLAB. The stator currents obtained from the simulation is shown in Fig.8. This current waveform is then sampled and used for the analysis. The analysis also did using MATLAB. Different wavelets are available in MATLAB. Among the available wavelets symlet 6 (sym6) is found to be most suitable for the analysis.
The current waveform obtained is decomposed in to 6 levels using sym6 and all the coefficients are obtained. From the detailed and approximation coefficients obtained different parameters like norm, mean, median, mode, standard variation, Shannon entropy etc. are calculated. These parameters are plotted for different loading (no load, 3A and 4.5A load) under healthy and faulty condition. Then variation in each parameter is analysed. The current waveform obtained experimentally is shown in fig.13 which is also processed same as that of simulation data.
Fig. 14 Max norm plot of R phase using wavelet sym6 under different loading condition (from simulation)
Fig. 15 Max norm plot of Y phase using wavelet sym6 under different loading condition (from simulation)
Fig. 16 Max norm plot of B phase using wavelet sym6 under different loading condition (from simulation)
Fig. 17 Max norm plot of R phase using wavelet sym6 under different loading condition (from experiment)
Fig. 18 Max norm plot of Y phase using wavelet sym6 under different loading condition (from experiment)
Fig. 19 Max norm plot of B phase using wavelet sym6 under different loading condition (from experiment)
From the graph (Fig.14 to Fig.19) it can be observed that max norm obtained using sym6 shows variation under different loading condition and fault condition. Fault is created between R-phase and Y-phase. Max norm value of detailed coefficient at level 6 for R-phase and B-phase is found to be increased, whereas max norm value of Y-phase is decreased from that of healthy motor. Similar variation is shown when the load is changed from no load to 3A and 4.5A load. Max norm value of detailed coefficient at level 6 obtained using sym6 is selected as the feature for fault detection. It can be used to detect turn to turn fault under different loading condition.
VII. CONCLUSIONS
A Simulink model is developed for the induction motor under turn to turn fault using mathematical model. The machine has been modelled in the d-q plane considering normal and stator turn fault conditions. Variations in speed, torque and stator currents are observed in simulation. The model acts well under both no-load and loading conditions. The simulation results obtained show that wavelet decomposition is a good technique to analyse current signals resulting from variable load torque.
Experimental data and Simulation data are analysed using wavelets Sym6. It can be seen that
0 1 2 3 4 5 6
1 2 3 4 5 6 7 8
Max No
rm
R-phase
No Load
3A Load
4.5A Load
0 1 2 3 4 5 6
1 2 3 4 5 6 7 8
Max No
rm
Y-phase
No Load
3A Load
4.5A Load
0 1 2 3 4 5
1 2 3 4 5 6 7 8
Max No
rm
B-phase
No Load
3A Load
0 1 2 3 4 5 6
1 2 3 4 5 6 7 8
Max No
rm
R- phase
No load
3A Load
0 1 2 3 4 5
1 2 3 4 5 6 7 8
Max No
rm
Y - phase
No Load
3A Load
4.5A Load
0 1 2 3 4 5 6
1 2 3 4 5 6 7 8
Max No
rm
B-phase
No Load
3A Load
both results are closely matching. From the wavelet decomposition of the signals, it is seen that significant variations are there in the infinity norm value of detailed coefficient at level 6 for faulty conditions compared to healthy condition when Sym6 is used for the decomposition. So, it can be used for the detection turn to turn fault in induction motor.
REFERENCES
[1] R. R. Obaid and T. G. Habetler, ―Current-based algorithm for mechanical fault detection in induction motors with arbitrary load conditions,‖ IEEE Industry Applications
Society Annual Meeting, pp. 1347-1351, 2003.
[2] Milrtic A. and Cettolo M., ― Frequency converter influence on induction motor rotor faults detection using motor current signature analysis-Experimental research‖,
Symposium on Diagnostic for electric machines, Power Electronics and Derives, Atlanta, GA, USA, 24-26 march, pp. 124-128, Aug.2003.
[3] Szabó L., Bíró K.Á., Dobai J.B., "On the Rotor Bar Faults Detection in Induction Machines", Proceedings of the International Scientific Conference Micro CAD, Miskolc (Hungary), Section J (Electrotehnics and Electronics), pp. 81-86,2003.
[4] Hamid A. Toliyat, Mohammed S. Arefeen, and Alexander G. Parlos, ―A Method for dynamic simulation of air-gap eccentricity in induction machines‖, IEEE Transactions on
Industry Applications, Vol. 32, No. 4, pp.910-918, 1996.
[5] W. T. Thomson, D. Rankin, and D. G. Dorrell, ―On-line current monitoring to diagnose air-gap eccentricity in large three-phase induction motors-industrial case histories verify the predictions‖, IEEE Transactions on Energy Conversion, Vol. 14, No. 4, pp1372-1378, Dec 1999.
[6] Arkan M., Perovic D. K. and Unsworth P., ―Online stator fault diagnosis in induction motors‖, IEE Proceedings Electric Power Applications, Vol. 148, No. 6, November, pp. 537-547, 2001.
[7] R. M. Tallam, T. G. Habetler, and Ronald G. Harley, ―Stator winding turn-fault detection for closed-loop induction motor drives‖, IEEE Industry Applications Society Annual
Meeting, pp1553-1557, 2002.
[8] Lorand S., Barna D., Agoston, ―Rotor faults detection in squirrel cage induction motors by current signature analysis‖, International Conference on Automation, Quality
and Testing, Robotics, May 13 – 15, Cluj-Napoca, Romania,
2004.
[9] L. Eren, and M. J. Devaney, ―Bearing damage detection via wavelet packet decomposition of the stator current,‖ IEEE
Transactions on Instrumentation and Measurement, Vol. 53,
No. 2, pp. 431 – 436, April 2004.
[10] J. Cusido; A.Jornet, L. Romeral, J.A. Ortega, A.Garcia, ―Wavelet and PSD as a fault detection techniques‖, IMTC
2006-Instrumentation and Measurement Technology
Conference Sorrento, Italy 24-27 April 2006, pp.
1397-1400.
[11] Jordi Cusidó, Luis Romeral, Juan A. Ortega,Javier A. Rosero, and Antonio García Espinosa, ―Fault Detection in Induction Machines Using Power Spectral Density in Wavelet Decomposition‖, IEEE Transactions on Industrial
Applications, VOL. 55, NO. 2, February 2008.
[12] Erick Schmitt, Peter Idowu, Aldo Morales, ―Applications Of Wavelets In Induction Machine Fault Detection‖,Ingeniare
Chilean journal of engineering,vol. 18 Nº 2, 2010, pp.
158-164.
[13] M. Riera-Guasp, J. Antonino-Daviu, J. Roger-Folch, and M. P. Molina, ―The use of the wavelet approximation signal as a tool for the diagnosis and quantification of rotor bar failures,‖ IEEE Trans. Ind. Appl., vol. 44, no. 3, pp. 716– 726, May./Jun. 2008.
[14] M. Riera-Guasp, Jose A. Antonino-Daviu, M. Pineda-Sanchez, R. Puche-Panadero, J. Perez-Cruz, ―A general approach for the transient detection of slip-dependent fault components based on the discrete wavelet transform,‖ IEEE Trans. Ind. Electron. vol. 55, no. 12, pp. 4167-4180, Dec. 2008.
[15] Jesper S. Thomsen, and Carsten S. Kallese, ‖Stator Fault Modelling of Induction Motors‖, International Symposium on Power Electronics, Electrical Drives, Automation and
Motion, 1-4244-0194-1/06,2006.
[16] Williamson, S. and Mirzoian, K., ―Analysis of cage induction motors with stator windings faults‖, IEEE
Transactions on Power Apparatus and Systems, Vol.
Pas-104, Issue. 7, 1985.
[17] Tallam, Rangarajan M., Habetler, Thomas G., and Harley, RonaldG., ―Transient model for induction machines with stator winding turn faults‖, IEEE Transactions on Industry