208
Implementation Of 5S Quality Tool In
Manufacturing Company: A Case Study
Vibhor Kakkar, Vijay Singh Dalal, Vineet Choraria, Ashish S. Pareta, Anmol Bhatia
Abstract: 5S system is a technique which maintains the quality of working conditions in the organization. Amongst various available Lean resources, 5S is a powerful technique that can bolster objectives of the organization to get continuous improvement in performance and productivity. This paper presents the implementation of 5S in a manufacturing company & 5S rating system was used to audit all changes in the company which enhanced the efficiency of the workers & ultimately the productivity of the company is enhanced to 91 %.
Index Terms: 5S Rating system, Time Analysis, Lean, Continuous improvement, Transportation, Tools & Quality.
————————————————————
1
I
NTRODUCTION5S is useful approach for giving foundation of organization and help to improve communication, lead time, downtime, defect, inventory, injury and costs associated with them [1]. Order, neat and cleanliness have considered as continuous improvement part and also starting point of continuous improvement [2]. 5S is able to link total productive maintenance (TPM) and other approaches also [3]. There is no such difference between ISO 9001 guidelines and rules of 5S [6]. If team member consider 5S, majority of routine problems can be resolved easily [4]. 5S implementation mayn‘t be possible without the training and workers mayn't be able to sustain those changes [5].
2
P
ROBLEMS
TATEMENTSpan Autotech Pvt. Ltd deals in manufacturing of sheet metal components. Company manufactures products by using processes- hydraulic power press cutting & bending; and welding. In company, rejection of company is approx. 1200 and there was lot of time wastage in a company just for hunting down required objects (tool, material etc.). Whenever company hires a new team member, Supervisor and foreman made lot of efforts just to train member. Material flow problem existed in a company. No bin system was present. For transporting material to shop, simple trolley was used which takes lot of human effort and that isn't even safe (in a ergonomics way).
Communication gap existed between management and team members. Finally, there were movement problems which exist, safety conditions weren't good and communication gap existed.
3 METHODOLOGY
3.1 Sort
It helps the company to keep track of everything which is required and throw unwanted items. First of 5S is to clean workplace for perfect operations. Company collected every item; it determined whether it would be useful, and then distinguishing items into categories based on their usage: Low, Medium and High. Nobody in the organization can notice what items should kept and what items should throw-away, so keep all unsure items for some weeks to make sure of a waste. Unsure items kept place where frequency of movement of people is low. In sorting, team members (direct) helped to sort tools. Workers cleaned items of the cabinet, throw all damaged items and managed all the items in specified positions.
3.2 Set in order
It is the way to make items look neat and reduce the time for hunting of tools and components. Second S keeps every item set in an order. Putting name tags over box and item should be kept according to its name. Company got varieties of tools and components, so set in order helps the workers to save time and to gather the required items.
3.3 Shine
The common idea is to clean, shine and neat everything in the workplace. In order to make things have much longer usage life and have perfect environment, Company asked their workers to clean their work-place before leaving the company.
3.4 Standardize
After implementing successfully all three above steps, the supervisors will ask their workers to maintain everything same as it was organized.
3.5 Sustain
Final step and hardest step of 5S implementation, asks the managers to keep everything same going every day. Company make a checklist for helping managers to make sure everything is fine. Making workers do sorting, set in order, shine, and standardize, daily, means that they are sustained. __________________________
Author Vibhor Kakkar is a U.G. Scholar in Mechanical
Engineering from ITM University, Gurgaon India,
PH-9873259318. E-mail: vibhorkakkar79@gmail.com
Co-Author Vijay Singh Dalal is a U.G. Scholar in
Mechanical Engineering from ITM University, Gurgaon India, PH-8826335469. E-mail: vjd636@gmail.com
Co-Author Vineet Choraria is a U.G. Scholar in
Mechanical Engineering from ITM University, Gurgaon India, PH-9891935393.
E-mail: vineetjain96@yahoo.com
Co- Author Guide Ashish S. Pareta is an Assistant
Professor of Department of Mechanical Engineering in ITM University, Gurgaon India, PH-9818137567,
E-mail: ashishsinghpareta@itmindia.edu
Co-Author Guide Anmol Bhatia is an Assistant
Professor of Department of Mechanical Engineering in ITM University, Gurgaon India, PH- 9953797615,
209
4
T
HEI
MPLEMENTATIONP
HASE OF5S
4.1 Problem 1:
Team member (direct) takes a lot of time in hunting for the objects (raw material, tool, sub-assemblies etc.) according to their requirements.
Expectations:
Get right object for right work every time & in shortest span of time.
Results:
Figure 1: Raw material was placed on racks according to
thickness and breath of sheets. Length of sheet was fixed.
Figure 2: Sub-assemblies of components weren't named, but
after first S, naming was done.
Figure 3: There are 5 tool boxes like shown above, tools were
placed haphazardly manner but after 5S everything was placed after its name and name slips were put for every tool.
Time analysis for tool box was shown in results. Average time was reduced by around 11 seconds.
4.2 Problem 2:
Hindrance in movement of material.
Expectation:
Assign a proper place for keeping raw material, bin and waste.
Results:
Arrangements were made placing bins near machine, marking were made for doing this. Bins were provided where there were no bins.
Figure 4: Raw material was placed on floor, now bins were
provided.
Figure 5: Scrap was placed on floor, now separate bins were
provided for scrap and another bin for finished material.
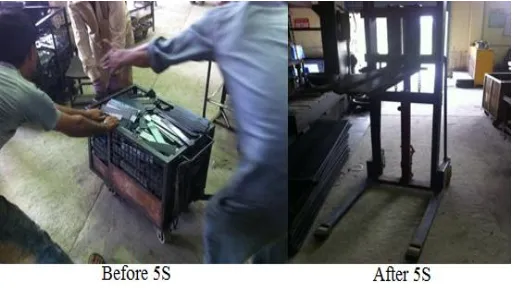
4.3 Problem 3:
Transportation of die from shelf to machine.
Expectations:
some machine for transporting die.
Results:
210
Figure 6: Trolley (old) and jack (new).
4.4 Problem 4:
Communication gap existed between management and team members (direct).
Expectations:
To improve communication and use direct team members views in discussions.
Results:
Now every product was displayed on board. Before 5S, customer complaints were directly registered in office, but after 5S, complaints of rejected pieces were directly put on display on board so that every team member can give their reviews.
Figure7: Kaizen implemented for display.
Figure 8: Kaizen implemented for display.
4.5 Problem 5:
Safety of team members weren't up-to good standards.
Expectations:
Good and comfortable working conditions.
Results:
Safety guards were placed for every machine. There was no marking on floor, after 5S marking was done on whole shop area.
Figure 9: Shop floor after 5S.
55SRATING SYSTEM
This system shows the improvement done by particular S of 5S. The total rating is out of 25 further divided into five equal parts [7]. Results are shown by graph.
5.1 1st S Seiri (Sort)
First S is basically dealing with material availability and process of manufacturing. Rating criteria:
Availability of material: give 1 mark if fully available otherwise 0.
Defective finished goods: if there are A items which contains B items as defective then marks will be: [1-{B/A}] Operating condition: If there is a proper flow of material,
then the value ‗1‘ is given otherwise ‗0‘ is assigned. Relative information: information about process
guidelines, working conditions, material information, tool information etc., is also important. 1 marks for full information otherwise 0.
Waste elimination: Let total C be number of waste listed, but only D number was removed, then marks will be as follows: [1-{D/C}].
Table 1: Seiri rating table
Seiri Rating
We eks
Averag e of material
operati ng conditio ns
Defect ive goods
Relative informati on
waste eliminati on
Total Rating S1
1 1 1 0.15 1 0.15 3.3
2 1 1 0.2 1 0.2 3.4
3 1 1 0.3 1 0.35 3.65
4 1 1 0.45 1 0.4 3.85
5 1 1 0.5 1 0.55 4.05
6 1 1 0.6 1 0.67 4.27
7 1 1 0.75 1 0.7 4.45
8 1 1 0.8 1 0.7 4.5
9 1 1 0.9 1 0.75 4.65
211
5.2- 2nd S Seiton (Set in order):
Second S deals with arrangement of equipment and tools on the shop floor.
Rating criteria:
Sequence rating: let there are an M number of total tools and N number which aren't in sequence, then the rating will be [1-{N/M}].
Material arrangement: let X be the lack of material and Y be material required, then, rating will be: [1-{X/Y}]. Process arrangement setting: let G be the number of total
processes and H be number of irregular processes, rating is as follows: [1-{H/G}].
Material arrangement consistency: Let U be arrangement of material bins and V be number that fails to achieve exact position. Then rating would be: [1-{V/U}].
Working efficiency= total allotted time to process / working time for processing.
Table 2: Seiton rating table
Seiton Rating We eks Seque nce Rating Materi al Arrang ement Material Arrange ment Consist ency Proces s arrang ement Wor king Effic ienc y Total Rating S2
1 0.3 0.5 0.5 0.4 0.85 2.55
2 0.3 0.5 0.5 0.4 0.85 2.55
3 0.35 0.5 0.5 0.5 0.85 2.7
4 0.4 0.5 0.5 0.5 0.85 2.75
5 0.5 0.85 0.8 0.6 0.85 3.6
6 0.65 0.85 0.8 0.6 0.85 3.75
7 0.7 0.85 0.8 0.7 0.85 3.9
8 0.85 0.85 0.8 0.8 0.87 4.17
9 1 0.85 0.8 0.9 0.87 4.42
10 1 0.85 0.8 0.9 0.87 4.42
5.3- 3rd S Seiso (Shine/clean):
Third S deals in order to do work in a clean environment. Rating criteria:
General cleaning of workplace – machine gets 1 for clean and 0 for unclean.
Proper working conditions: let J be number of wrong arrangement and I be the total number of favorable conditions, then rating would be: [1-{J/I}]
Safety from accident: safety is given on scale means if there is chance rating will be 0 and if they feel safe, rating will be 1.
Cleaning consistency: Let Q be the total no. of time cleaning required and R be number of times the cleaning not done, so consistency rate will be [1-{R/Q}].
Path for movement of material: Let J is the total no. of times hindrance and K be the total no. of movements. Then rating will be: [1-{K/J}].
Table 3: Seiso rating table
SEISO RATING Week s Clean Workpla ce Machine Cleanlin ess People Workin g Conditi on Safet y Cleaning Consiste ncy Total Ratin g S3
1 1 1 0.4 0.9 0.4 3.7
2 1 1 0.4 0.9 0.4 3.7
3 1 1 0.65 0.9 0.4 3.95
4 1 1 0.65 0.9 0.4 3.95
5 1 1 0.8 0.9 0.6 4.3
6 1 1 0.8 0.9 0.6 4.3
7 1 1 0.8 0.9 0.7 4.4
8 1 1 0.85 0.9 0.8 4.55
9 1 1 0.85 0.94 0.8 4.59
10 1 1 0.85 0.94 0.8 4.59
5.4- 4th S Seiketsu (Standardize):
Seiketsu rating can be calculated by taking average of last three S, because standards of any system will fall & rise by factors of mean rate. Rating of Seiketsu = (rating of Seiri + rating of Seiton + rating of Seiso)/3.
Table 4: Seiketsu rating table
Seiketsu Rating
Weeks Total Rating S4=(S1+S2+S3)/3
1 3.1833
2 3.2167
3 3.4333
4 3.5167
5 3.9833
6 4.1067
7 4.2500
8 4.4067
9 4.5533
10 4.5533
5.5- 5th S Shitsuke (Sustain):
Shitsuke rating can be calculated by last four S because without that regularity will not maintain. Shitsuke Sustain rating = (rating of Seiri + rating of Seiton +rating of Seiso + rating of Seiketsu)/4 Rating of this table is shown in results.
6.
R
ESULTS&
D
ISCUSSIONS:
212
Table 5: Time analysis before 5S
Table 6: Time analysis after 5S
* All values are of time in seconds.
By using 5S rating system, we explain how we improved every part of 5S and how training went with team members that they start following changes, resulting in good rating of 5S. Training was good because for eliminating communication gap, company supervisors start sharing problems with team members and taking their views for solving problem of components.
Table 7: Shitsuke rating
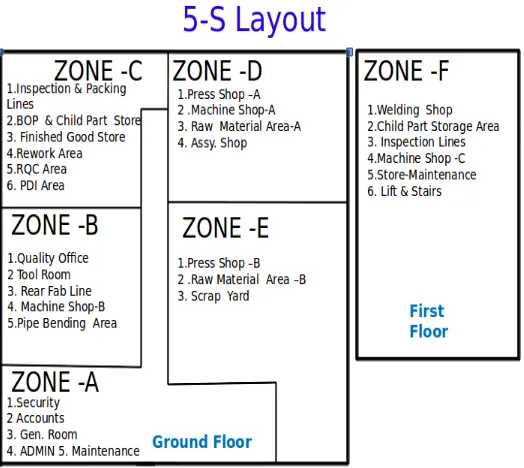
5S layout was made for company and deputation of team leaders was performed.
Figure 10: 5S Layout of Span Autotech Pvt. Ltd.
The company got some troubles while implementing 5S and there was issues because rejection rate was bit increased near 4th-5th week of 5S but after few weeks of implementation, rejection rate was reduced.
Graph 1: Efficiency of 5S rating system
A
CKNOWLEDGMENTWe would like to thank Mr. Anil Kakkar, CEO of Span Autotech Pvt. Ltd., for allowing us to work in company and guide us in project.
R
EFERENCES[1] A. Nilipour, & M. Jamshidian, ―5S as an environmental organization management tool: Benefits and barriers,‖ Proceedings of the 3rd International Management Conference, 2005, Dec 20-25, Tehran, Iran.
[2] S.M. Yusof and E. Aspinwall, ―Case studies on the Spann
er
Allen Key
C-Clam
p
nut and bolt set
Drill Millin
g tool
Cutti ng Tool
Staff 1 24 15 12 17 24 26 20
Staff 2 23 14 16 23 27 27 20
Staff 3 22 13 11 24 34 23 19
Staff 4 24 10 11 23 32 34 17
Staff 5 21 17 11 23 24 35 15 Avera
ge 22.8 13.8 12.2 22 28.2 29 18.2
Spann er
Allen Key
C-Clam
p
Nut and Bolt set
Drill Millin
g tool
Cutti ng Tool
Staff 1 11 10 8 11 15 12 8
Staff 2 12 11 7 11 14 13 10
Staff 3 14 9 6 12 15 11 10
Staff 4 9 9 10 11 8 14 11
Staff 5 8 10 10 12 6 10 7
Avera
ge 10.8 9.8 8.2 11.4 11.6 12 9.2
Shitsuke Rating
Weeks Overall Rating S5=((S1+S2+S3+S4)/4)*100/5
1 63.6667
2 64.3333
3 68.6667
4 70.3333
5 79.6667
6 82.1333
7 85.0000
8 88.1333
9 91.0667
213 implementation of TQM in the UK automotive SMEs,‖
International Journal of Quality & Reliability Management, vol. 18, no.7, pp. 722-744, 2001.
[3] R. Gapp, R. Fisher, and K. Kobayashi, ―Implementing 5S within a Japanese context: an integrated management system,‖ Management Decision, vol. 46, no.4, pp. 565-579, 2008.
[4] A. Hamzah and S. Ho, ―TQM training for small and medium industries in Malaysia.‖ Training for Quality, vol. 2, no.2, pp. 27-35. 1994.
[5] S. Pavnaskar, J. Gershenson, and A. Jambekar, ―Classification scheme for lean manufacturing tools.‖ International Journal of Production Research, vol. 41, no.13, pp. 3075-3090, 2003.
[6] Pheng, L.S., ―Towards TQM - Integrating Japanese 5S principles with ISO 9001: 2000 requirements,‖ The TQM Magazine, vol. 13, no.5, pp. 334-341, 2001.