www.nat-hazards-earth-syst-sci.net/15/603/2015/ doi:10.5194/nhess-15-603-2015
© Author(s) 2015. CC Attribution 3.0 License.
Developing a functional model for cities impacted by a natural
hazard: application to a city affected by flooding
G. Bambara1, L. Peyras1, H. Felix1, and D. Serre2,3,4
1Irstea, 3275 Route de Cézanne, CS40061, 13182 Aix-en-Provence CEDEX 5, France 2RESCUE Solutions, 7 avenue Jeanne d’Arc, 38100 Grenoble, Switzerland
3Urban Water, 38 rue Croix des petits Champs, 75001 Paris, France
4HDR associé à l’UMR LIED, Université Paris-Diderot, Sorbonne Paris Cité, France
Correspondence to: G. Bambara ([email protected])
Received: 18 April 2014 – Published in Nat. Hazards Earth Syst. Sci. Discuss.: 11 June 2014 Revised: 22 October 2014 – Accepted: 24 February 2015 – Published: 16 March 2015
Abstract. The experience feedback on a crisis that hit a city is frequently used as a “recollection” tool. To capitalize in-formation about an experience feedback from the cities that have been affected by a natural hazard, the authors propose in this study a functional model to model scenarios of city crises. In this model, the city, considered as a complex sys-tem, was modelled using a functional analysis method. Based on such modelling, two risk analysis methods (Failure Mode and Effect Analysis and Event Tree Method) were deployed and adjusted. Lastly, a qualitative reasoning model was used for the scenario modelling of the urban crisis. By functional modelling performed on components of the cities, the ob-jective of this model is to replicate the behaviour of a city affected by a crisis, highlighting the sequences of failure and non-failure modes that have operated during the crisis. This model constitutes a means of understanding the functional behaviour in a crisis of cities and capitalization of the experi-ence feedback of the cities affected by crisis. Such functional modelling was deployed in a case study.
1 Introduction
For the past decades, growing urbanization and industrializa-tion has given rise to a sharp increase in harmful disastrous events, thereby demonstrating the city’s higher exposure to major risks, e.g. flood risk (Ashley et al., 2007). In addition, climate change will lead to a substantial escalation and in-crease in frequency of a number of natural hazards (Muller, 2007). Cities, particularly vulnerable, need to acquire new
tools to guard against future disasters and improve their re-silience when facing such hazards. The RESILIS project – Technical urban systems governance for a resilient city – funded by the French National Research Agency, addresses such issues and aims at improving urban system resilience in the face of natural or anthropogenic hazard-driven crisis. All works described herein were conducted as part of the RE-SILIS project and focus on developing a functional model for cities.
a model for the impacted city’s failures, and understand the failure processes as well as the sequences and causal rela-tionships thereof. This is not a negligible issue since urban systems appear particularly complex due to their many con-stituent subsystems, and the multiple organizations and gov-ernance (Lhomme et al., 2013; Toubin et al., 2012). The main scientific issue pertains to developing a model that might re-produce the complex operation and deficiencies of urban sys-tems. An underlying issue relates to modelling the experi-ence feedback on crisis-stricken urban systems. The aim is to analyse urban crisis case studies, understand the failure pro-cesses thereof and view them within a homogeneous model. The objective of this research is to develop a model that will allow modelling the crisis-stricken cities functional be-haviour. Reference work searches did not reveal many mod-els for urban system modelling existing in the technical lit-erature, except for research undertaken by teams working in urban engineering and more particularly in the field of ur-ban resilience (Campanella, 2006; Serre et al., 2012). Re-silience is generally included in the concept of response to sudden impact like natural disasters (Alberti et al., 2003; Pickett et al., 2004). The concept was initially a term of ecol-ogy (Holling, 1973) and has evolved significantly in the past 30 years (Folke, 2006; Gallopín, 2006). Recognition has in-creased across disciplines that human and ecological systems are interlinked and that their resilience relates to the function-ing and interaction of the systems rather than to the stability of their components or the ability to maintain or return to some equilibrium state (Klein et al., 2003). The management of urban resilience focuses on reducing the extent of the dam-age, speeding recovery and adapting to unexpected threats, in addition to protecting against known threats (Linkov et al., 2014). Thus, considering the city as a system, urban re-silience can be defined (according to Campanella, 2006) as “the capacity of a city to face devastating event reducing damage at minimum”. Concerning the natural hazards – par-ticularly for the flood hazard – resilience concepts are com-prised of individual preventive and emergency measures at building scale and a land use policy to adapt building ac-tivities to floods (Pasche and Geisler, 2005). The resilience concept has been applied to flood risk management by adopt-ing a system approach (De Bruijn et al., 2005). The system approach tends to overcome the segmentations and level of complexity. Indeed, a system approach proposes a common language for different disciplines and can be considered a good way to study complex systems (Batty, 2009). The re-search work of Lhomme et al. (2011) is based on this ap-proach and he defines urban resilience as “the ability of a city to absorb disturbance and recover its functions after dis-turbance”. He used a system model for studying cities and for modelling their functions. The model seeks to assess the re-silience level of urban networks. Indeed, urban networks play an important part in crises and not always in positive ways – for instance, the reliability and rapid restoration of the elec-tric grid is particularly necessary to support the needs of the
population within a disaster area effectively (Winkler et al., 2010).
In this study, in representing the functional behaviour of a city affected by a natural hazard, we are interested in all urban system components including technical networks. Our model uses functional analysis methods in order to under-stand how the systems work (Baroth et al., 2013), risk anal-ysis methods designed for modelling complex systems and qualitative reasoning models for the representation of failure sequences in the form of causal graphs (Forbus, 1996). After reviewing past experience feedback, the goal is to suggest a functional methodology that will allow us to reconstruct the failure scenarios that occurred in the crisis-stricken cities. We have applied this model to urban crisis case studies, to model the cities impacted by natural hazard, by the successions of failure and non-failure modes that took place during crisis.
Two advantages arise through this model. Firstly, it is pos-sible to have knowledge of satisfactory functioning and dys-functions at the component level of a city, when hit by a nat-ural hazard. Secondly, it is possible to capitalize on the ex-perience feedback from urban crises in functional form and benefit from this experience feedback for better management and an improvement of the components of a city. These ad-vantages help improve our understanding of urban system failures.
This is an innovative research project as it uses functional analysis, risk analysis and qualitative reasoning models and applies them to urban engineering. Adjusting such methods will result in developing a functional model to outline the behaviour of a crisis-stricken city, and showing how help-ful it can be for analysing urban crisis experience feedback. This aspect is described in Sect. 2. In Sect. 3, the model is applied to the case study of an urban crisis caused by flash floods. The city selected as a case study is the city of Nîmes (France), which was struck by major runoff flooding in 1988. Such application will show how much can be learnt from such a model about the weak points to be improved in an urban system. Section 4 specifically address the case study. Based on the different suggested models, the urban system’s strengths and potential improvements are described.
2 Developing a functional model for crisis-stricken cities
2.1 Functional model development procedure for crisis-stricken cities
A city is a complex system with many a constituent subsys-tems and multiple interactions between those subsyssubsys-tems and the city’s outer environment (Zevenbergen et al., 2010; Serre et al., 2011). Consequently, risk analysis methods used in in-dustry to identify risks and model complex system functions are considered relevant for modelling and analysing how a crisis-stricken city operates (Baroth et al., 2013; Modarres, 1993). Also, qualitative reasoning models are deemed rele-vant for representing urban crisis (Forbus, 1996).
Such methods have been used in the past as part of civil engineering projects (Peyras et al., 2012; Serre et al., 2008). They have also been applied to urban engineering with regard to technical networks (Serre et al., 2011).
Our procedure for building a functional model that will outline the functional behaviour of a crisis-stricken city can be summarized in four steps: (i) a functional analysis: the urban system and the subsystems’ functions are determined; (ii) failure mode and effect analysis (FMEA): information on failures occurring in an urban system due to a dreaded event are capitalized on from experience feedback; (iii) event-tree method (ETM): for each component, a representation of potential scenarios is suggested, including the scenario re-sulting from experience feedback, as a sequence of failure modes; (iv) a qualitative reasoning model with causal graph modelling: a dynamic and gradual model of failure is sug-gested to describe the urban failure scenario from experience feedback.
2.2 Developing a functional model for crisis-stricken cities
2.2.1 Functional analysis applied to cities
The functional analysis consists of two stages: the external functional analysis, including analysing the system within its environment, and internal functional analysis, including a structural analysis of the system, i.e. identifying its various constituent subsystems, and exploring the subsystems’ func-tions (Baroth et al., 2013). Many functional analysis methods are suitable for industry, services or organizations. It was de-cided to rely on one method deriving from value analysis: the APTE method as successfully used and applied to civil engineering systems (Peyras et al., 2006).
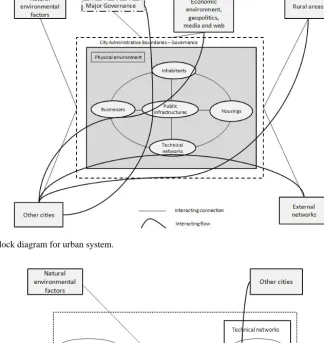
In functional analysis, two categories of functions are con-sidered to reflect the actions of a system: main and technical functions. The main functions convey the purpose of a sys-tem’s action. Technical functions model how the system re-acts to stresses set by the external environment. Functional analysis also uses functional block diagrams (FBDs) to rep-resent the system and external environment (Baroth et al., 2013).
The external functional analysis aims at defining the sys-tem to be reviewed, its limits and interacting external envi-ronments (Baroth et al., 2013). When applied to cities, the system is regarded as consisting of the urban system delin-eated by its geographic and administrative boundaries. Fig-ure 1 shows the FBD of a generic urban system. This FBD makes it possible to show how the urban system interacts with external environment – including neighbouring cities, rural areas, outer technical networks (power, water, telecom-munications, transport networks, etc.), environmental factors (meteorology, seismic situation, etc.) and governance. These elements were defined by different experts in urban engineer-ing durengineer-ing work sessions. From this FBD, we deduce the main and technical functions of a generic urban system.
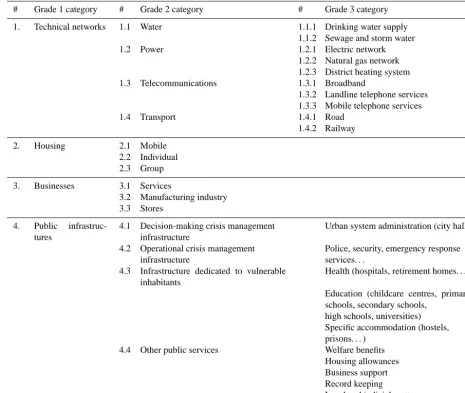
The internal functional analysis is performed for a typical urban system. It is suggested (by experts in urban engineer-ing) that four large categories of subsystems should be differ-entiated: technical networks, housing, businesses and public infrastructure. The population is implicitly included in each of these four large categories of subsystems. Such categories, referred to as grade 1 categories, may be detailed as grade 2 or grade 3 categories. Table 1 shows how the city is struc-turally subdivided into different subsystem categories. The main and technical functions have been taken from the FBDs. As an example, the FBD for the Drinking Water Sup-ply (DWS) technical network is shown in Fig. 2. From the FBD, the DWS technical network, main and technical tions may be differentiated and highlighted. The main func-tions are to “provide of drinking water for the housing, busi-nesses and public infrastructures” and to “protect the city in case of fire”. Technical functions are to “resist to mechani-cal loadings” and to “resist to failures from other technimechani-cal networks interrelated with DWS technical network”.
All the results from the internal functional analysis are compiled in a functional analysis table detailing the main and technical functions of a city’s constituent subsystems. Table 2 provides a sample of such functional analysis table for the DWS technical network subsystem. For an analysis of other urban subsystem functions, see the RESILIS project (www.resilis.fr).
In this paper, we focus on five essential hand or technical functions required for the system to work properly when a dreaded event impacts a city:
– the function “provide and/or drain off flows” for “water” technical network,
– the function “provide flows” for “power” technical net-work (power flows, natural gas flows, district heat-ing flows and “telecommunications” technical network (communication flows: broadband, landline telephone or mobile telephone services)
Figure 1. Functional block diagram for urban system.
Figure 2. Functional block diagram for drinking water supply technical network.
– the function “ensure”: “ensure accommodation” for housing, “ensure their economic and social duties are performed” for businesses and “ensure and serve a pub-lic interest purpose” for pubpub-lic infrastructures,
– the function “resist to mechanical loadings” for all sub-systems.
Finally, the functional analysis drawn up for a typical city may subsequently be applied to a specific city for a case study through adjustments and quick streamlining.
There-fore, this is a generic functional analysis that may apply to most urban systems.
2.2.2 FMEA applied to cities
Table 1. City structural breakdown.
# Grade 1 category # Grade 2 category # Grade 3 category
1. Technical networks 1.1 Water 1.1.1 Drinking water supply 1.1.2 Sewage and storm water
1.2 Power 1.2.1 Electric network
1.2.2 Natural gas network 1.2.3 District heating system 1.3 Telecommunications 1.3.1 Broadband
1.3.2 Landline telephone services 1.3.3 Mobile telephone services
1.4 Transport 1.4.1 Road
1.4.2 Railway
2. Housing 2.1 Mobile
2.2 Individual 2.3 Group
3. Businesses 3.1 Services
3.2 Manufacturing industry 3.3 Stores
4. Public infrastruc-tures
4.1 Decision-making crisis management infrastructure
Urban system administration (city hall)
4.2 Operational crisis management infrastructure
Police, security, emergency response services. . .
4.3 Infrastructure dedicated to vulnerable inhabitants
Health (hospitals, retirement homes. . . )
Education (childcare centres, primary schools, secondary schools,
high schools, universities) Specific accommodation (hostels, prisons. . . )
4.4 Other public services Welfare benefits Housing allowances Business support Record keeping
Legal and judicial matters. . .
Table 2. Functional analysis table for drinking water supply technical networks.
No. and subsystems Main functions Technical functions
1.1.1 Water technical network: “drinking water supply”
To provide flows: To resist mechanical loadings (multi-hazards)
To provide drinking water supplies to housing, businesses and public infrastructure
To resist (piping) seismic loadings
To protect in case of fire To resist external contamination: to ensure water drinkability To ensure undisrupted service,
To resist power outage (by providing a backup generator for instance)
To last a long time
are analysed. FMEA analysis results are outlined in ta-bles specifically designed for the system type of interest. A FMEA procedure will include a system functional
anal-ysis then a systematic research for failure modes and effects thereof (Baroth et al., 2013; Modarres, 1993).
Table 3. Sample FMEA applied to drinking water supply technical network.
# Subsystems Functions Failure modes Potential causes
of failure
Potential failure effects
Main functions
Technical functions
1 Drinking water supply technical network
To resist mechanical loadings
Did not resist mechanical loadings
Damaged supply pipes
Inhabitants no longer have access to drinking water (housing, businesses, public infrastructure)
had to undergo a number of adjustments. To that end, and to show the causal connections between phenomena and failure modes during an urban crisis, each parameter in the FMEA table and how they are achieved is precisely defined: failure mode, cause, effect. The suggested FMEA analysis includes the following:
– subsystems;
– subsystem main and technical functions, provided by the functional analysis;
– subsystem failure modes, matching a function’s failures and/or damages;
– possible causes of failure, originating from either the strength and/or location of the given external mechan-ical loading, or the failure of a subsystem interacting with the analysed subsystem;
– possible effects of failure.
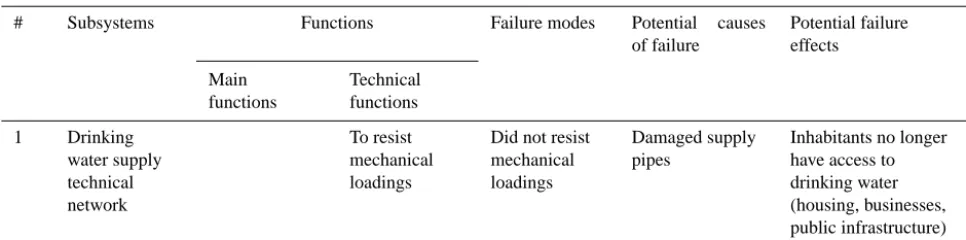
For instance, the DWS technical network subsystem’s technical function is to “resist to mechanical loadings”, hence the failure mode thereof: “did not resist to mechani-cal loadings”. A possible cause of such failure is “damaged DWS pipes”. Consequently, the effect of such failure is that the population (housing, businesses and public infrastruc-tures) no longer have access to drinking water. This example is shown in Table 3 as a FMEA table.
Unlike in industry, where FMEA is used as a tool to identify a system’s failure modes, the FMEA is used here to identify, based on an experience feedback, the failure modes, causes and effects of crisis-stricken urban systems. At the end of the FMEA, the city’s subsystems failure modes, causes and effects are known in connection with an urban cri-sis as detailed in the experience feedback.
2.2.3 ETM applied to cities
Based on the identification of failure modes, the failure sce-nario modelling methods are used to construct the sequences of failure modes that may lead to system failure. There are
different methods for modelling risk analysis, one of the main ones being the ETM. The sequence of events on the tree is deductive or inductive (Zwingelstein, 1995), from the ini-tiating event to the final events (Baroth et al., 2013; Modar-res, 1993). The tree is chronologically developed according to how each modelled subsystem behaves.
As part of our study on urban systems, the ETM will be developed after the FMEA method has been applied. Indeed, failure modes that occurred during an urban crisis are de-termined. The ETM will then help model the chronological sequence of effects as identified during this urban crisis.
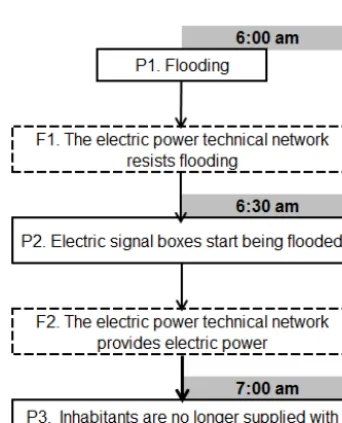
For instance, we consider, based on fictitious experi-ence feedback, an urban system hit by severe flooding, for which the successive sequence of impacted subsystem fail-ure modes is to be modelled. More specifically, three im-pacted urban subsystems are in focus: the electrical the power technical network, the DWS technical network, and hous-ing. Failure of the functions “provide electric power” and “resist to mechanical loadings” for the electric power tech-nical network lead to a defaulting techtech-nical function (“resist to power outage”) for the DWS technical network. Thus, the failure of these technical functions results in the failure of the function “ensure suitable accommodation for population” for the housing subsystem. Ultimately, the flooding scenario for such urban crisis consists in the sequence of three failure modes: (i) failure of the electric power technical network that was flooded, (ii) failure of the DWS technical network due to power outage, and (iii) disruption of the electric power and DWS services for housing. This scenario, i.e. the sequence of failure modes described above, is modelled in Fig. 3.
In the end, the ETM allows us to produce a sequence of the subsystem failure modes according to their functional and chronological occurrence. Thus, an event tree consists of modelling an urban crisis as a functional scenario with se-quenced urban subsystem failure modes.
2.2.4 Modelling crisis-stricken cities through qualitative reasoning models
Figure 3. Sample of ETM: application to drinking water supply technical network.
Figure 4. Sample of a directed graph dynamic causal model appli-cation, for the electric power technical network.
to reproduce the systems behaviours from their causal rela-tionships: any event (e.g. a P phenomenon occurring in an urban system, see Fig. 4) impacting a variable (e.g. an urban subsystem’sF function, see Fig. 4) will spread to other vari-ables (other phenomena and functions in city) having a causal connection therewith, through causal paths (Forbus, 1996). Propagation may be simulated using quality-based and dy-namic transfer functions with time as a parameter.
Of all dynamic quality-based models, the directed graph dynamic causal model is the most relevant for modelling an urban crisis scenario based on given experience feedback. Indeed, it will help show the dynamic and gradual change in impaired functions and subsystems over time. Also, re-dundancies may thereby be incorporated into the scenarios (introducing multiple identical phenomena in the scenario model) in order to take loop and non-linear scenarios into account.
Figure 4 gives an example of a directed graph dynamic causal model considering the experience feedback on a flood-ing event impactflood-ing an urban system and, more specifically, the impact of such an event on the electric power technical network subsystem.
3 Applying the functional model for flood-stricken cities
The functional model is applied to a case study pertaining to the city of Nîmes (France) after the October 1988 flood-ing. The event is first described and subsequently modelled following the above procedure: functional analysis, FMEA, ETM and causal model. Finally, the urban crisis is analysed based on the model results in Sect. 4.
3.1 Event description
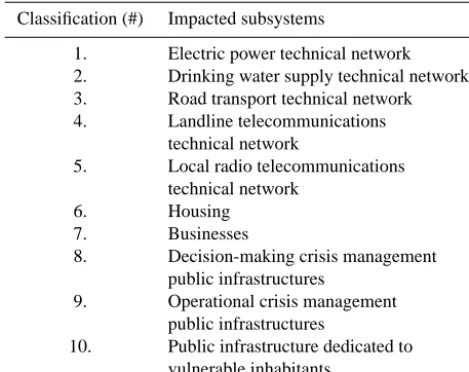
Table 4. Subsystems impacted by flooding event in Nîmes (1988).
Classification (#) Impacted subsystems
1. Electric power technical network 2. Drinking water supply technical network 3. Road transport technical network 4. Landline telecommunications
technical network
5. Local radio telecommunications technical network
6. Housing
7. Businesses
8. Decision-making crisis management public infrastructures
9. Operational crisis management public infrastructures
10. Public infrastructure dedicated to vulnerable inhabitants
from a variety of essays, media and books. For instance, the main reference (Fabre et al., 1994) described the event and the 1988 flooding hazard impact on Nîmes and its subsys-tems.
A runoff flooding occurred on 3 October 1988 within Nîmes catchment area. This rain and storm event took place between 04:00 and 12:00 UTC. This produced a sheet of wa-ter of between 300 to 420 mm, corresponding to an estimated 100-year return period, which caused the runoff flooding, especially as it had rained heavily for several days before 3 October 1988. This previous rainfall caused ground sat-uration, hence the substantial increase in runoff. The natu-ral event was greatly exacerbated by the city’s urban struc-tures. Indeed, the intermittent stream beds located upstream the city of Nîmes had been narrowed by road infrastructure and housing. The intermittent streams were directed down-stream of the city centre through pipes that were either un-dersized or cluttered up by technical networks. And the out-lets of these intermittent streams down the city were blocked by road or railway embankments. Therefore, Nîmes and its population ended up being trapped by water. The flooding event in Nîmes had disastrous outcomes. Regrettably, there were several casualties, 30 houses were destroyed and about 2000 had their fittings damaged, causing 45 000 disaster vic-tims, of which 200 had to be rehoused. Between 450 and 700 businesses were also damaged. The crisis management public infrastructure buildings were flooded (command post for organization of civil security response in the prefecture, fire and rescue service department, departmental fire and res-cue operational centre, emergency ambulance service, police station), as well as the city’s utility services (electric power, telecommunications, DWS, road transport). The estimated overall disaster cost was FF 3.3 billion. Nîmes was not pre-pared to respond to such a large-scale crisis: there was no prevention plan except for the weather report, no hydraulic
protection works or structures capable of responding to such a severe flooding event, no flood forecast system since there is no large watercourse flowing through the city, no delin-eation regulation applied to areas liable to flooding and no specific crisis management procedure. The city of Nîmes had to deal with an unexpected and large-scale event without any specific protection or adaptation resources available.
3.2 Functional analysis of 1988 flooded Nîmes 3.2.1 Identifying the subsystems impacted
The subsystems of Nîmes impacted during flooding were de-termined based on the experience feedback (see Sect. 3.1). Table 4 shows all 10 impacted subsystems.
Based on such subsystems and by reviewing the event de-scription contained in the experience feedback on the 1988 flooding in Nîmes, the functional model was applied.
3.2.2 Identifying the main functions of subsystems impacted
By analysing the experience feedback in Nîmes and consid-ering the functions identified during an urban system generic functional analysis (Sect. 2.2.1), the essential main functions impacted during an urban crisis were determined.
The first function is “provide drinking water” which is en-sured by the water technical network: due to the flooding event which began at 06:45 UTC on 3 October 1988, the DWS technical network was cut off as of 09:30 UTC, af-fecting 50 % of the city. Thus the impacted function during crisis was not ensured across the system.
The second function is “ensure communication and infor-mation” (to provide telecommunications flows): this function was ensured in Nîmes by two technical subsystems: the land-line telecommunications technical network and the local ra-dio telecommunications technical network. Four telephone exchange offices were flooded due to runoff flooding. Such flooding resulted in 60 000 users having their telephone com-munications cut off. In addition, the police telecommunica-tions network was also cut off, thereby hindering commu-nication in crisis management and emergency response op-erations. The “ensure information communication” function was indeed impacted by this event, although the second lo-cal radio telecommunications technilo-cal network subsystem remained in running order.
The third function is “meet the needs for travel”: this func-tion, ensured by the road transport technical network, was impacted by the flooding event due to the damaged road sys-tem. Indeed, over 30 km of roads were destroyed, resulting in restricted access to housing for crisis management stake-holders.
large number of constructed entities were impacted by the flooding event, resulting for the population in loss of their homes, their jobs and access to public services for a variable length of time.
The main technical function involved in urban crisis is “re-sistance to flooding”.
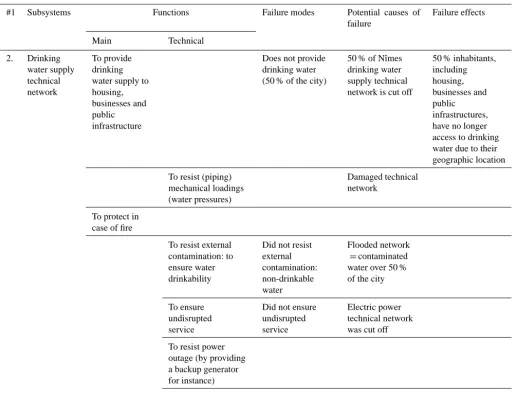
3.3 FMEA applied to subsystems impacted by the event
Once all functions impacted by the urban crisis were iden-tified, the FMEA helped highlight the failure modes, causes and effects thereof on subsystems impacted by such urban crisis. FMEA is applied only to subsystems involved in the crisis event, as determined by the functional analysis (see Sect. 3.2.1).
A FMEA table was used for modelling the failure modes, causes and effects of the subsystems (10 subsystems) im-pacted by the flooding in Nîmes. The subsystem main and technical functions were analysed in the FMEA table. From such functions, the failure modes, causes and effects were determined based on information provided by the experience feedback of the Nîmes crisis. Information contained in this experience feedback were subsequently organized and clas-sified in the FMEA table.
Table 5 provides sample results for the “DWS techni-cal network”. This table indicates that the function “provide drinking water for the housing, businesses and public infras-tructures” of the DWS technical network has the following failure mode: “does not provide drinking water to 50 % of the city”. This failure mode has the following cause: “interrup-tion drinking water for 50 % of the city of Nîmes” and has the following effects: “50 % population, including housing, businesses and public infrastructure, no longer have access to drinking water due to their geographical location”.
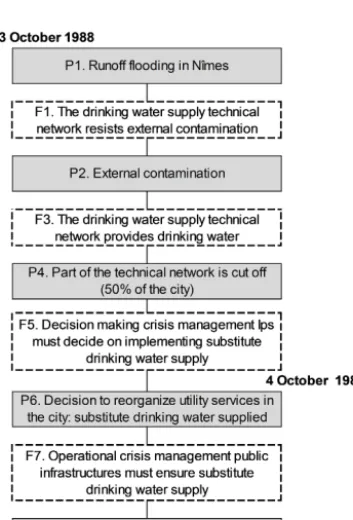
3.4 Event-Tree Method applied to Nîmes crises
The ETM is used to model the potential failure scenarios of October 1988 in Nîmes, in linking the different failure mode sequences.
The initiating event of the ETM to be considered is the runoff flooding. As described in Sect. 3.2.1, the flooding event in Nîmes impacted 10 subsystems. The 10 subsystems require that the urban crisis should be modelled with regard to four essential main functions: (i) “provide drinking water”, carried out by the DWS technical network, (ii) “ensure com-munication and information”, carried out by the telecommu-nications technical networks (landline telephone and local ra-dio services), (iii) “meet the needs for travel”, carried out by the road transport network, (iv) “ensure accommodation and shelter” for the population, carried out by constructed enti-ties. A model of the failures occurring in Nîmes was subse-quently sought for each of these four essential main functions using the ETM and the procedure outlined in Sect. 2.2.3.
We present in the paper the modelling of the failure of the main function “provide drinking water” (Fig. 5). Event-tree modelling of the “DWS technical network failure” involves the following subsystems: electric power technical network, DWS technical network, decision-making crisis ment public infrastructures and operational crisis manage-ment public infrastructures. In Fig. 5 we detail the scenario that occurred during the Nîmes crisis in October 1988.
The ETM makes it possible to highlight the different po-tential scenarios, in a flood crisis-stricken city, induced by various sequences of failure modes, for each one of four ur-ban subsystem essential main functions.
3.5 Modelling the city of Nîmes during the runoff flooding of 1988 using the directed graph dynamic causal model
The directed graph dynamic causal model helps to show the dynamic and gradual change in impaired functions and sub-systems over time. It demonstrates the impact of an initiating event (P as phenomenon) on one or more variables (F as function), and how it would spread to other variables (other phenomena and functions in the city) having a causal con-nection thereto through causal paths.
With regard to the experience feedback for Nîmes, a di-rected graph dynamic causal model may be developed con-sidering the sequence of subsystem failures as suggested in the event trees (see Sect. 3.4). In this respect, this model provides a dynamic perspective on the scenario occurring in Nîmes from 3 to 4 October 1988. In Fig. 6, the DWS techni-cal network section demonstrates that, faced with the runoff flooding phenomenon that occurred on Monday 3 October 1988, the function “provide drinking water” proved poorly efficient. However, the crisis management public infrastruc-tures managed to handle the technical network failure. The population were supplied with substitute drinking water as soon as the following morning (Tuesday 4 October 1988).
Therefore, the directed graph dynamic causal model shows the global scenario derived from the experience feed-back on the considered case study, including each rele-vant subsystem-specific scenario. The scenario is then more specifically defined by describing all phenomena at stake as a result of the failure modes. Unlike the ETM, the dynamic causal model does not highlight the different potential sce-narios resulting from an initiating event. For that reason, a scenario’s criticality may not be assessed against a whole set of potential scenarios.
4 Discussion
4.1 Discussion on functional modelling of the Nîmes crisis
Table 5. FMEA table for Nîmes during the 1988 runoff flooding event: sample of drinking water supply technical networks.
#1 Subsystems Functions Failure modes Potential causes of
failure
Failure effects
Main Technical
2. Drinking water supply technical network
To provide drinking water supply to housing, businesses and public infrastructure
Does not provide drinking water (50 % of the city)
50 % of Nîmes drinking water supply technical network is cut off
50 % inhabitants, including housing, businesses and public infrastructures, have no longer access to drinking water due to their geographic location
To resist (piping) mechanical loadings (water pressures)
Damaged technical network
To protect in case of fire
To resist external contamination: to ensure water drinkability
Did not resist external contamination: non-drinkable water
Flooded network =contaminated water over 50 % of the city
To ensure undisrupted service
Did not ensure undisrupted service
Electric power technical network was cut off
To resist power outage (by providing a backup generator for instance)
To last a long time
ETM method, show how the function “provides drinking wa-ter” may be affected. These different scenarios may result in the failure or non-failure of subsystems’ functions that are involved in potential failures of the DWS technical network. Scenario #5 (see Fig. 5), of all possible scenarios, is the one derived from the experience feedback on the flooding’s in Nîmes 1988. Indeed, during the crisis a cut-off of DWS technical network occurred in 50 % of the city. This cut-off is due to the DWS technical network contamination on 3 Oc-tober 1988 at 09:30 UTC. However, the crisis management public infrastructures ensured their functions with respect to such failure. The function of component “decision mak-ing crisis management infrastructure” that is “to decide on implementing substitute of drinking water” was performed with success. Substitute drinking water was quickly supplied to the population on 4 October 1988, as shown in scenario #5 of the event-tree through the sequence of failure modes regarding: “resist a contamination” and “ensure undisrupted
service” technical functions for the DWS technical networks; “decide on implementing substitute of drinking water” prin-cipal function for decision-making crisis management public infrastructures; “ensure substitute of drinking water” princi-pal function for operational crisis management public infras-tructures.
Figure 5. Event tree representing the drinking water supply technical network failure during the 1988 flooding in Nîmes.
Figure 6. Representation of directed graph dynamic causal model for the 1988 crisis scenario in Nîmes, for drinking water supply technical networks.
The city of Nîmes can be viewed as exhibiting interme-diate behaviour in regard to their defaulting DWS technical network on a time limit of 2 days, by calling on their crisis management public infrastructures for action. The city’s re-silience with regard to the defaulting “provide drinking wa-ter” function would most likely be improved with a faster response from crisis management public infrastructures (re-sponse in 1 day). Indeed, the principal function “decide on implementing substitute of drinking water” for decision-making crisis management infrastructures and the principal function “ensure substitute of drinking water” for operational crisis management infrastructures should have been carried on Monday 3 October 1988 instead of Tuesday 4 October 1988. A better resilience in Nîmes would also imply securing the DWS technical network against the flooding phenomenon in order to reduce the length of technical network cut-off.
4.2 Utilization, advantages and limitations of the functional model
The functional model developed in this study has a dual purpose: capitalize on the failures of the city affected by a natural hazard and analyse behaviour. We present here the application of our model to the city of Nîmes, which was impacted by a flood in October 1988. Based on informa-tion from the experience feedback established following this event, we capitalized the failures of the functions of the var-ious subsystems that have been mentioned in this experience feedback. Failures of the functions of affected subsystems, their causes and their effects are compiled into a FMEA ta-ble. The behaviour of each subsystem is then analysed by the ETM. The dependencies and the functional relationships between the subsystems are taken into consideration chrono-logically. Thus, the functional model can scan potential sce-narios of the function failures and their effects for each sub-system. A directed graph dynamic causal model highlights the scenario that occurred during the crisis, by a logical chain of phenomena and functions for each subsystem mobilized during the event.
The novelty in the use of these methods is that their use is based solely on experience feedback. They have been adapted to this problematic, such as FMEA does not aim to find the set of failure modes, their causes and effects pos-sible but retains only the information from the experience feedback.
The application of our model can be performed on a city that has been impacted by various natural hazards (flood, earthquake, landslide. . . ) and for which an experience feed-back has been realized, including a complete register of fail-ures subsystems and actions undertaken by the actors dur-ing the crisis management. In the framework of the RESILIS project, we have applied our model to four other cases of cities impacted by natural and technological hazards: the city of Annecy (France) impacted by an earthquake in July 1996; the city of Arles (France) impacted by flooding in 2003; the city of Toulouse (France) impacted by the explosion of fac-tory AZF “Grande Paroisse” in 2001; and the city of Voûlte-sur-Rhône (France) impacted by the derailment of a train carrying hydrocarbons. For these four cases, the functional model has facilitated the analysis of positive and/or negative behaviour of the city facing a catastrophic event (Toubin et al., 2013).
This model based on risk analysis methods helps to im-prove the formalization of an experience feedback. It may be considered as a first step towards the analysis of the actions to be implemented with the aim to improve the resilience of a city impacted by a hazard. This model is intended for mu-nicipalities and local authorities wishing to use simple tools to reorganize procedures for prevention and protection, and the risk management for crises that may arise.
Our functional model is limited primarily by the fact that its effectiveness depends on the availability and quality of
information from the experience feedback of the city crisis. Second, this model is considered as a first step in the analysis of the crisis in order to improve the resilience of the city stud-ied. It must be supplemented by other tools. Nevertheless, it can give indications of the subsystems of the city that are po-tentially the most critical and where there is urgent need to implement further study.
5 Conclusions
Acknowledgements. This research is part of the Project RESILIS, led by Egis with EIVP as scientific coordinator (www.resilis.fr) and funded by the French National Research Agency (ANR Sustainable Cities 2009).
Edited by: R. Lasaponara
Reviewed by: A. Fekete, P. Frederic, and two anonymous referees
References
Alberti, M., Marzluff, J. M., Schulenberger, E., Bradley, G., Ryan, C., and Zumbrunnen, C.: Integrating humans into ecology: op-portunities and challenges for studying urban ecosystems, Bio-sciencess, 53, 1169–1179, 2003.
Ashley, R., Blanksby, J., Chapman, J., and Zhou, A.: Towards in-tegrated approaches to reduced flood risk in urban areas, in: Advances in Urban Flood Management, edited by: Ashley, R., Gravin, S., Pasche, E., Vassilopoulous, A., and Zevenbergen, C., Taylor & Francis Group, London, UK, 415–432, 2007.
Baroth, J., Breysse, D., and Schoefs, F.: Construction Reliability: Safety, Variability and Sustainability, John Wiley & Sons, USA, 2013.
Batty, M.: Cities as complex systems: scaling, interaction, networks, dynamics and urban morphologies, in: Encyclopedia of Com-plexity and Systems Science, edited by: Meyers, R. A., Springer, New York, 1041–1071, 2009.
De Bruijn, K. M., Van Beek, E., and TU Delft: Delft University of Technology: Resilience and flood risk management: a systems approach applied to lowland rivers, Delft University Press, Delft, 11 October 2005.
Campanella, T. J.: Urban resilience and the recovery of New Or-leans, J. Am. Plann. Assoc., 72, 141–146, 2006.
Fabre, G., Lequeux, J.-M., and Scheurer, P.: Hydraulique pluviale à Nîmes après le 3 octobre 1988, Houille Blanche, 8, 27–31, 1994. Folke, C.: Resilience: the emergence of a perspective for social– ecological systems analyses, Global Environ. Chang., 16, 253– 267, 2006.
Forbus, K. D.: Qualitative reasoning, in: CRC Handbook of Com-puter Science, Draft, Qualitative reasoning group, the Institute for the Learning Sciences, North-western University, USA, 715– 733, 1996.
Gallopín, G. C.: Linkages between vulnerability, resilience, and adaptive capacity, Global Environ. Change, 16, 293–303, 2006. Holling, C.: Resilience and stability of ecological systems, Annu.
Rev. Ecol. Syst., 4, 1–23, 1973.
Klein, R. J. T., Nicholls, R. J., and Thomalla, F.: Resilience to natu-ral hazards: how useful is this concept?, Global Environ. Change B, 5, 35–45, 2003.
Komendantova, N., Mrzyglocki, R., Mignan, A., Khazai, B., Wen-zel, F., Patt, A., and Fleming, K.: Multi-hazard and multi-risk decision support tools as a part of participatory risk governance: feedback from civil protection stakeholders, International Jour-nal of Disaster Risk Reduction, 8, 50–67, 2014.
Lhomme, S., Serre, D., Diab, Y., and Laganier, R.: A methodol-ogy to produce interdependent networks disturbance scenarios, in: Vulnerability, Uncertainty, and Risk: Analysis, Modeling, and Management, Proceeding of the ICVRAM 2011 and ISUMA 2011 Conferences, 11–13 April 2011, Hyattsville, Maryland, USA, 724–731, 2011.
Lhomme, S., Serre, D., Diab, Y., and Laganier, R.: Analyzing re-silience of urban networks: a preliminary step towards more flood resilient cities, Nat. Hazards Earth Syst. Sci., 13, 221–230, doi:10.5194/nhess-13-221-2013, 2013.
Linkov I., Bridges T., Creutzig F., Decker J., Fox-Lent C., Kröger W., Lambert J. H., Levermann A., Montreuil B., Nathwani J., Nyer R., Renn O., Scharte B., Scheffler A., Schreurs M., and Thiel-Clemen T.: Changing the resilience paradigm, Nat. Clim. Chang., 4, 407–409, 2014.
Modarres, M.: What every engineer should know about Reliability and Risk Analysis, Marcel Dekker, New York, USA, 1993. Muller, M.: Adapting to climate change water management for
ur-ban resilience, Environ. Urur-ban., 19, 99–113, 2007.
Pasche, E. and Geisler, T. R.: New strategies of damage reduction in urban areas proned to flood, in: Urban flood management, Taylor & Francis Group, London, 101–117, 2005.
Peyras, L., Royet, P., and Boissier, D.: Dam ageing diagnosis and risk analysis: development of methods to support expert judg-ment, Can. Geotech. J., 43, 169–186, 2006.
Peyras, L., Carvajal, C., Felix, H., Bacconne,t C., Royet, P., Becue, J. P., Boissier, D.: Probability-based assessment of dam safety using combined risk analysis and reliability methods – applica-tion to hazards studies, Eur. J. Environ. Civ. Eng., 16, 795–817, doi:10.1080/19648189.2012.672200, 2012.
Pickett, S. T. A., Cadenasso, M. L., and Grove, J. M.: Resilience cities: meaning, models, and metaphors for integrating the eco-logical, socio-economic, and planning realms, Landscape Urban Plan., 69, 369–384, 2004.
Serre, D., Peyras, L., Tourment, R., and Diab, Y.: Levee perfor-mance assessment methods integrated in a GIS to support plan-ning maintenance actions, J. Infrastruct. Syst., 14, 201–213, 2008.
Serre, D., Lhomme, S., Heilemann, K., Hafskjold, L., Tagg, A., Walliman, N., and Diab, Y.: Assessing vulnerability to floods of the built environment – integrating urban networks and build-ings, in: Vulnerability, Uncertainty, and Risk, American Society of Civil Engineers, Hyattsville, Maryland, USA, 746–753, 2011. Serre, D., Barroca, B., and Laganier, R.: Resilience and Urban Risk
Management, CRC Press, Leiden, the Netherlands, 2012. Toubin, M., Serre, D., Diab, Y., and Laganier, R.: Brief
communi-cation “An auto-diagnosis tool to highlight interdependencies be-tween urban technical networks”, Nat. Hazards Earth Syst. Sci., 12, 2219–2224, doi:10.5194/nhess-12-2219-2012, 2012. Toubin, M., Raymond, M., and Arnaud, J. P., coord.: RESILIS –
Guide pratique de la résilience urbaine, Pont et chaussée, presse des Ponts, France, 2013.
Wybo, J. L. and Van Wassenhove, W.: Retour d’expérience et maîtrise des risques-Pratiques et méthodes de mise en œuvre, Technique & Documentation Lavoisier, France, 2009.
Winkler, J., Dueñas-Osorio, L., Stein, R., and Subramanian, D.: Performance assessment of topologically diverse power systems subjected to hurricane events, Reliab. Eng. Syst. Safe., 95, 323– 336, 2010.
Zevenbergen, C., Cashman, A., Evelpidou, N., Pasche, E., Garvin, S., and Ashley, R.: Urban flood management, CRC Press, Lon-don, 2010.