SIMULTANEOUS ESTIMATION OF LUTEOLIN AND APIGENIN IN METHANOLIC LEAF EXTRACT OF CARDIOSPERMUM HALICACABUM BY HPLC
5
0
0
Full text
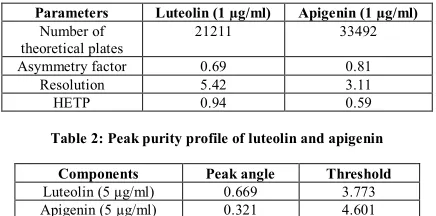
(2) Aiyalu Rajasekaran et al. Int. Res. J. Pharm. 2013, 4 (7) Preparation of sample solution Ten mg of leaf extract was weighed accurately, transferred into a 10 ml volumetric flask and dissolved in 5 ml of methanol followed by sonication for 5 min and made up to volume with acetonitrile. 0.2 ml of the solutions was further diluted to 10 ml with acetonitrile, filtered through 0.45 µm nylon filter paper prior to use. Validation of the HPLC method The method was validated as per ICH guidelines20 for system suitability, linearity, accuracy, precision, robustness, sensitivity, LOD and LOQ by the following procedures (Figure 1 to 4). System suitability System suitability of method was performed by calculating the chromatographic parameters namely, column efficiency, resolution, peak asymmetry factor and HETP on the repetitive of injection of standard solution. Linearity (Calibration curve) Linearity was performed for each apigenin and luteolin standards with five different concentrations between the ranges of 1-70 µg/ml were analysed in triplicate for each concentration. Calibration curves were constructed by plotting peak areas against analyte concentrations. The linearity was assessed by calculating the slope, y-intercept and coefficient of determination (r2) using Microsoft Excel 2007 program.. SD is the standard deviation of the analytical signal, and b is the slope of the concentration/response graph. Accuracy The accuracy of the method was determined by calculating the recoveries of apigenin and luteolin by the method of standard addition. Known amount of the standards (80, 100 and 120%) were added to the pre-analyzed sample solutions and the amounts of these standards were estimated by measuring the peak areas and by fitting these values to the straight-line equation of calibration curves. Robustness The robustness of the proposed method was evaluated by changing the different C18 column brand, pH and extraction time. Specificity Specificity is the ability of an analytical method to differentiate and quantify the analyte in presence of other components in the sample. Peak purity of the method was evaluated by calculating the difference between peak angle (θp) and peak threshold angle (θth). Peak purity was assessed using millennium 32 software for waters HPLC/PDA; system based on the degree of similarity of UV spectra across the peak in the range of 190-800 nm. The separation was performed on a Hypersil C18 column (particle size 5 µm; 250 X 4.6 mm id). Table 1: System suitability parameters of luteolin and apigenin. Precision The precision of the method was examined by performing the intra-day and inter-day assays of six replicate injections of the mixture of standard solution at three concentration levels (1, 30 and 70 µg/ml). The intraday assay precision test was performed at intervals of 4 h in 1 day, while the interday assay precision test was performed over 3 days. LOD and LOQ LOD and LOQ of both the analytes were determined by k SD/b where k is a constant (3.3 for LOD and 10 for LOQ),. Parameters Number of theoretical plates Asymmetry factor Resolution HETP. Luteolin (1 µg/ml) 21211. Apigenin (1 µg/ml) 33492. 0.69 5.42 0.94. 0.81 3.11 0.59. Table 2: Peak purity profile of luteolin and apigenin Components Luteolin (5 µg/ml) Apigenin (5 µg/ml). Peak angle 0.669 0.321. Threshold 3.773 4.601. Table 3: Linear regression data for the calibration curves (n=3) Parameter Retention time (min) Detection wavelength LOD µg/ml LOQ µg/ml Linearity range µg/ml Correlation coefficient (area) Regression equation (area). luteolin 7.024 ± 0.118 348 nm 0.03 0.91 1-70 0.9995 y = 151.99x + 26.60. apigenin 7.614 ± 0.107 348 nm 0.04 0.13 1-70 0.9998 y = 124.16x + 37.51. Table 4: Intra and interday precision of the developed method (n=6). components 1 µg/ml 30 µg/ml 70 µg/ml 1 µg/ml 30 µg/ml 70 µg/ml. Intraday Retention time Peak area Mean %RSD Mean %RSD luteolin 7.09 0.13 302 0.75 7.05 0.24 4492 1.18 7.02 0.27 10748 0.93 apigenin 7.59 0.18 217 0.58 7.62 0.17 3754 1.18 7.64 0.35 8649 1.32. Interday Retention time Peak area Mean %RSD Mean %RSD 7.06 7.01 6.96. 0.06 0.26 0.36. 297 4469 10639. 0.95 1.36 1.27. 7.57 7.59 7.62. 0.09 0.39 0.27. 209 3684 8598. 0.93 1.42 1.63. Page 110.
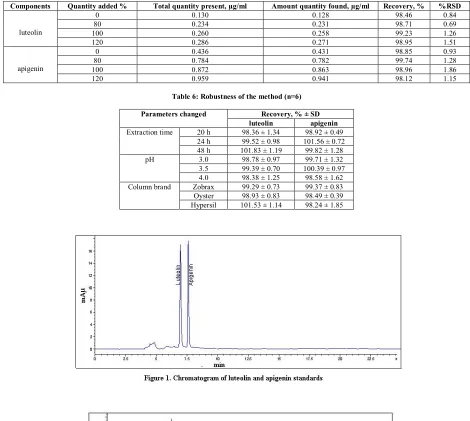
(3) Aiyalu Rajasekaran et al. Int. Res. J. Pharm. 2013, 4 (7) Table 5: Recovery study of luteolin and apigenin from the extract of Cardiospermum halicacabum (n=3) Components luteolin. apigenin. Quantity added % 0 80 100 120 0 80 100 120. Total quantity present, µg/ml 0.130 0.234 0.260 0.286 0.436 0.784 0.872 0.959. Amount quantity found, µg/ml 0.128 0.231 0.258 0.271 0.431 0.782 0.863 0.941. Recovery, % 98.46 98.71 99.23 98.95 98.85 99.74 98.96 98.12. %RSD 0.84 0.69 1.26 1.51 0.93 1.28 1.86 1.15. Table 6: Robustness of the method (n=6) Parameters changed Extraction time. pH. Column brand. 20 h 24 h 48 h 3.0 3.5 4.0 Zobrax Oyster Hypersil. Recovery, % ± SD luteolin apigenin 98.36 ± 1.34 98.92 ± 0.49 99.52 ± 0.98 101.56 ± 0.72 101.83 ± 1.19 99.82 ± 1.28 98.78 ± 0.97 99.71 ± 1.32 99.39 ± 0.70 100.39 ± 0.97 98.38 ± 1.25 98.58 ± 1.62 99.29 ± 0.73 99.37 ± 0.83 98.93 ± 0.83 98.49 ± 0.39 101.53 ± 1.14 98.24 ± 1.85. Page 111.
(4) Aiyalu Rajasekaran et al. Int. Res. J. Pharm. 2013, 4 (7). RESULTS AND DISCUSSION Optimisation of extraction As reported by Natsume, et al.14 100% methanol was selected as extraction solvent to obtain high yield of luteolin and apigenin in plant materials. The total extraction time was also evaluated as reported by Deepak, et al17. However 24 h maceration of plant materials with methanol (3 × 50 ml) yielded higher amount of luteolin and apigenin compared to the previously reported methods. Optimisation of chromatographic conditions The HPLC-UV parameters were optimised by investigating the influence of the mobile phase composition and detection wavelength. The initial mobile phase system was tried with gradient elution of methanol and acetate buffer pH 4, but resulted in decrease resolution and tailing of peaks observed. Thus instead of methanol and acetate buffer, gradient elution of acetonitrile and potassium dihydrogen phosphate buffer (20 mM, adjusted to pH 3.5 with orthophosphoric acid, v/v) was developed. By this method separation, resolution of the peaks was good and tailing of peaks also minimal. Gradient composition was altered to get a fine separation and finally 010 min 15-60% B, 10-15 min 60-75% B, 15- 20 min 75% B, 20-25 min 75-100% B set as a mobile phase with the flow rate of 1 ml/min. The UV spectrum of mixer of apigenin and luteolin showed the maximum absorbance at 348 nm and it was selected as a detection wavelength. The column thermostat was maintained at 30 ± 1˚C. Before injection column was stabilised with the initial mobile phase concentration of 15% B for 45 min and after each run column was stabilised with initial gradient concentration for 10 min.. Method validation System suitability Six replicate injections of the system suitability solution gave %RSD values for retention time and peak area within 2%, indicating low variation of the measured values (Table 1). The symmetry of all peaks was < 2. The resolution (R) between luteolin and apigenin was 3.11, indicating a high degree of peak separation (R>2). The efficiency of the column, as expressed by the number of theoretical plates, was more than 2000. These results indicate the suitability of the HPLC system and conditions of the developed method. Specificity Specificity evaluation was carried out by analyzing luteolin and apigenin simultaneously. It was observed that the peaks for each of the drugs were well separated and not interfered with other components. Peak threshold angle (θth) of all the peaks was found greater than that of peak angle (θp), values are mentioned in Table 2, indicating the purity of the peaks. Further, peaks obtained by the proposed method corresponding to each of the drugs were seen to be pure. This confirmed that the method used for estimation of the two marker compounds simultaneously was specific. Calibration curve (Linearity) Linear regression analysis confirms that the r2 values for both the drugs were >0.999 confirming the linear relationship between the concentration of the drugs and area under the curve (Table 3). The calibration curves (n=3) constructed for the markers were linear over the concentration range of 1-70 µg/ml for each marker.. Page 112.
(5) Aiyalu Rajasekaran et al. Int. Res. J. Pharm. 2013, 4 (7) Precision The precision results for the solution at the three concentrations are presented in Table 4. It was shown that the RSD values for retention time were <1%, while the RSD values for peak area were <2% for both intra- and interday assay precision (intraday, 4 h, six injections; interday, 3 days). Accuracy Recovery of the investigated components ranged from 98.1299.74%, (Table 5) and their % RSD values were all <2%. It was known from recovery tests that the developed methods manifested reliability and accuracy for the measurement of the two components individually. Limit of detection and Limit of quantification The LOD and LOQ for luteolin and apigenin were found to be 0.05 and 0.15 µg/ml, 0.041 and 0.13 µg/ml, respectively. Robustness Selected parameters like extraction time, different C18 column and pH remained unaffected by small variations (Table 6). The recovery obtained concluded that the methods are consistent for change in extraction time, column brand and pH. CONCLUSION The developed validated RP-HPLC method enabled the simultaneous determination of luteolin and apigenin in the methanloic leaf extract of Cardiospermum halicacabum. The analytes were identified by their retention times (tR) and by co-injection with standards. The spiked extract samples with standard compounds ensured that there was no effect of sample matrix on peak response of the analyst of interest. For quantitative determinations, the plant extracts were injected directly on to column and separated under the optimized conditions. The quantity of luteolin and apigenin in Cardiospermum halicacabum was found to be 1.29 and 2.16 mg/g respectively. The retention time of luteolin and apigenin was found to be 7.05 and 7.59 min respectively. Hence the newly developed method enabled the faster analysis of luteolin and apigenin in Cardiospermum halicacabum compared to previously reported method. REFERENCES 1. Ragupathy S, Steven G, Newmaster, Gopinadhan P, Candice BN. Exploring Ethnobiological Classifications for Novel Alternative Medicine: A case study of Cardiospermum halicacabum L. (Modakathon, Balloon Vine) as a traditional herb for treating rheumatoid arthritis, Ethnobotany; 2007.p. 19 2. Kumaran A., Karunakaran RJ. Antioxidant activities of the methanol extract of Cardiospermum halicacabum, Pharm. Biol 2006; 44(2): 146151. http://dx.doi.org/10.1080/13880200600596302. 3. 4. 5.. 6. 7.. 8. 9. 10. 11. 12. 13. 14.. 15. 16.. 17.. 18.. 19.. 20.. Gopalakrishnan C, Dhananjayan R, Kameswaran L. Studies on the pharmacological actions of Cardiospermum halicacabum. Indian J Physiol and Pharmacol 1976; 20: 203-206. PMid:1010635 VV Asha, Pushpangadan P. Antipyretic activity of Cardiospermum halicacabum. Indian J. Exp Biol 1999; 37: 411-414. PMid:10641181 Waako PJ, Gumede B, Smith P, Folb PI. The in vitro and in vivo antimalarial activity of Cardiospermum halicacabum L. and Momordica foetida Schumch. Et Thonn. J Ethnopharmacol 2005; 99: 137-143. http://dx.doi.org/10.1016/j.jep.2005.02.017 PMid:15848033 Santakumari G, Pillai NR, Nair RB. Diuretic activity of Cardiospermum halicacabum Linn in rats. J Sci. Res. Plant Med 1981; 2: 32. Rao Venkat N, Chandraprakash K, Kumar Shanta SM. Pharmacological investigation of Cardiospermum halicacabum L. in different animal models of diarrhea. Indian J Pharmacol 2006; 38: 346-349. http://dx.doi .org/10.4103/0253-7613.27703 Veeramani C, Pushpavalli G, Pugalendi KV. Anti hyperglycaemic effect of Cardiospermum halicacabum Linn. Leaf extract on STZ-induced diabetic rats. J Appl. Biomed 2008; 6: 19-26. MS Sheeba, VV Asha. Effect of Cardiospermum halicacabum on ethanol-induced gastric ulcers in rats, J. Ethnopharmacol 2006; 106: 105-110. http://dx.doi.org/10.1016/j.jep.2005.12.009 PMid:16469462 Srinivas K, Choudary KA, Rao SS, Satyanarayana T, Rao Krishna RV. Phytochemical examination of Cardiospermum halicacabum Linn. Indian J Nat Prod 1998; 14: 24-27. The European Agency for the Evaluation of Medicinal Products (TEAEMP) Veterinary medicines evaluation unit. EMEA/MRI/664/99FINAL; 1999. Achari B, Chowdhury US, Dutta PK, Pakrashi SC. Two isomeric flavonones from Vitex negundo. Phytochemistry 1984; 23: 703-704. http://dx.doi.org/10.1016/S0031-9422(00)80420-3 Darina R, Anna V. UV spectrometric and DC polarographic studies on apigenin and luteolin. Archives of Pharmacal Research 1999; 22(2): 173-178. http://dx.doi.org/10.1007/BF02976542 Natsume E, Muto Y, Fukuda K, Tokumaga T, Osakabe N. Determination of rosmarinic acid and luteolin in Perilla frutescens Britton (Labiatae), J. Sci. Food Agric 2006; 86: 891-901. http://dx .doi.org/10.1002/jsfa.2432 Bazylko A, Strzelecka H. A HPTLC densitometric determination of luteolin in Thymus vulgaris and its extracts. Fitoterapia 2007; 78(6): 391-5. http://dx.doi.org/10.1016/j.fitote.2007.01.007 PMid:17583444 Huang MH, Huang SS, Wang BS, Wu CH, Sheu MJ, Hou WC. Antioxidant and anti-inflammatory properties of Cardiospermum halicacabum and its reference compounds ex-vivo and iv vivo, J. Ethnopharmacol 2010; 133(2): 743-750. http://dx.doi.org/10.1016/ j.jep.2010.11.005 PMid:21073940 Deepak M, Sangli GK, Arun PC, Amit A. Quantitative Determination of the Major Saponin Mixture Bacoside A in Bacopa monnieri by HPLC. Phytochem. Anal 2005; 16: 24-29. http://dx.doi.org/10.1002/pca.805 PMid:15688952 Bhandari P, Kumar N, Gupta AP, Singh B, Kaul VK. A rapid RPHPTLC densitometry method for simultaneous determination of major flavonoids in important medicinal plants. J Sep Sci 2007; 30(13): 20926. http://dx.doi.org/10.1002/jssc.200700066 PMid:17654615 Li L, Jiang H, Wu H, Zeng S. Simultaneous determination of luteolin and apigenin in dog plasma by RP-HPLC. J Pharm Biomed Anal 2005; 37(3):615-20.http://dx.doi.org/10.1016/j.jpba.2004.11.012 PMid:15740925 ICH. Q2B. Guidance for industry. Validation of Analytical Procedures: Methodology; 1996.. Cite this article as: Aiyalu Rajasekaran, Vivekanandan Kalaiselvan, Nagulsamy Sarathikumar, Muthusamy Kalaivani. Simultaneous estimation of Luteolin and Apigenin in methanolic leaf extract of Cardiospermum halicacabum by HPLC. Int. Res. J. Pharm. 2013; 4(7): 109-113 http://dx.doi.org/10.7897/2230-8407.04724. Source of support: Nil, Conflict of interest: None Declared. Page 113.
(6)
Figure
Related documents
Anti-inflammatory effects of the preparation were studied according to the below methods: S.Salamon– burn induced inflammation of the skin, caused by hot water (80 0 C) in white
(At that time, significant parts of the socialist movement were anti-militaristic, holding that war was an integral part of capitalism.) Although most people believed these objectors
Our results demonstrated that the mutant strain ∆22915 was a highly attenuated strain and provided long-term, effec- tive protection against wild-type, virulent strain S2308
In the present study, we examined immunohistochemi- cally the expression of EBV and DNA Topoisomerase (DNA-Topo) II ∝ in normal keratinized & non keratinized oral mucosa and
In the case reported by Marcus et al there was evidence of only scanty melanin production which was localized to dendritic cells which did not have neurosecretory granules [3]
Discussion on the possible association between a firm’s financial structure and its size, class, profitability, income gearing, external financing, and a host of
A method of event-based landslide susceptibility analysis (EB-LSA) was applied to data from a storm event-induced shallow landslide study in the Kuohsing quadrangle.. Results show
