www.nat-hazards-earth-syst-sci.net/11/3293/2011/ doi:10.5194/nhess-11-3293-2011
© Author(s) 2011. CC Attribution 3.0 License.
and Earth
System Sciences
How reliable are projections of future flood damage?
P. Bubeck1,2, H. de Moel1, L. M. Bouwer1, and J. C. J. H. Aerts1
1Institute for Environmental Studies, Faculty of Earth and Life Sciences, VU University Amsterdam, The Netherlands 2German Research Centre for Geosciences GFZ, Helmholtz Centre Potsdam, Section Hydrology, Germany
Received: 24 May 2011 – Revised: 30 August 2011 – Accepted: 12 October 2011 – Published: 14 December 2011
Abstract. Flood damage modelling is an important com-ponent in flood risk management, and several studies have investigated the possible range of flood damage in the com-ing decades. Generally, flood damage assessments are still characterized by considerable uncertainties in stage-damage functions and methodological differences in estimating ex-posed asset values. The high variance that is commonly as-sociated with absolute flood damage assessments is the rea-son for the present study that investigates the reliability of estimates of relative changes in the development of potential flood damage. While studies that estimate (relative) changes in flood damage over time usually address uncertainties re-sulting from different projections (e.g. land-use characteris-tics), the influence of different flood damage modelling ap-proaches on estimates of relative changes in the development of flood damage is largely unknown. In this paper, we eval-uate the reliability of estimates of relative changes in flood damage along the river Rhine between 1990 and 2030 in terms of different flood-damage modelling approaches. The results show that relative estimates of flood damage develop-ments differ by a factor of 1.4. These variations, which re-sult from the application of different modelling approaches, are considerably smaller than differences between the ap-proaches in terms of absolute damage estimates (by a fac-tor of 3.5 to 3.8), or than differences resulting from land-use projections (by a factor of 3). The differences that exist when estimating relative changes principally depend on the differ-ences in damage functions. In order to improve the reliability of relative estimates of changes in the development of poten-tial flood damage, future research should focus on reducing the uncertainties related to damage functions.
Correspondence to: P. Bubeck (philip.bubeck@ivm.vu.nl)
1 Introduction
In recent years, flood management throughout Europe has gradually shifted from what are called “flood control ap-proaches” to more integrated concepts, referred to as “flood risk management”. While flood control approaches predom-inantly focused on preventing flood events with specific pre-defined return periods, flood risk management also takes into account the expected consequences of flooding such as direct economic losses or loss of life (B¨uchele et al., 2006; de Moel et al., 2009; Merz et al., 2010). Risk in this context is de-fined as “probability times damage”, and thus describes the expected damage that can occur or will be exceeded with a certain probability in a certain period (e.g. Merz et al., 2010). Following this shift to risk-based approaches, there has been an increasing interest in flood impact assessment and especially the estimation of direct economic losses (Dutta et al., 2003; Merz et al., 2004; Hall et al., 2005; Penning-Rowsell et al., 2005; Thieken et al., 2005; Bouwer et al., 2009; Luino et al., 2009; Kreibich et al., 2010). Knowledge of potential flood damage has a great importance for, inter alia, the identification of people and assets at risk, the plan-ning and evaluation of effective flood mitigation and control measures, the creation of flood risk maps for awareness rais-ing, and the calculation of flood insurance premiums (Mess-ner et al., 2007; Merz et al., 2010). Furthermore, flood dam-age is projected to increase in the coming decades owing to on-going development in flood-prone areas and the pro-jected effects of climate change on river discharges, and con-sequently flood probabilities (Middelkoop et al., 2001; IPCC, 2007; te Linde et al., 2010). Against this background, a growing number of studies have estimated the range of possi-ble changes in the development of future flood damage in Eu-rope (Hall et al., 2005; Aerts et al., 2008; ABI, 2009; Feyen et al., 2009; Maaskant et al., 2009; Bouwer et al., 2010; te Linde et al., 2011).
stage-damage functions, as well as methodological differ-ences in estimating the exposed asset values linked to these curves (Merz et al., 2004; Apel et al., 2008, 2009; Freni et al., 2010; Merz et al., 2010; de Moel and Aerts, 2011). While further efforts are currently being undertaken to reduce the uncertainties of flood loss assessment, it can be assumed that considerable uncertainty will remain in the coming years (Jonkman et al., 2008; Maaskant et al., 2009; Kreibich et al., 2010; Elmer et al., 2010). In order to better manage the large variations that are commonly associated with assess-ments of absolute flood damage, it is suggested that it would be useful to investigate the reliability of estimates of relative changes in the development of potential flood damage, espe-cially in terms of the differences stemming from flood dam-age modelling approaches (de Moel and Aerts, 2011). Gain-ing insights into the reliability of relative estimates (as the percentage change of a reference situation) of flood damage in scenario studies is important, as these often form the ba-sis of decision making and are used, for example, to evaluate the effectiveness of various risk reducing-strategies (ICPR, 2006; Aerts et al., 2008; ABI, 2009; Bouwer et al., 2010). The latter purpose is especially important because many in-vestments in flood control and mitigation measures take 20 to 30 yr to design, plan and implement and are also designed for long life spans (see e.g. Hallegatte, 2009; Dircke et al., 2010).
Furthermore, insights into the influence of different flood damage modelling approaches on relative estimates of flood damage developments are needed, given the increasing em-phasis on basin-wide approaches for trans-boundary flood risk assessment. A basin-wide approach is currently re-quired in Europe (EU, 2007) and facilitated by intergovern-mental river basin organizations like the International Com-mission for the Protection of the Rhine (ICPR) or the In-ternational Commission for the Protection of the Danube River (ICPDR). In these organizations, the member coun-tries need to jointly evaluate the effectiveness of various risk reducing-strategies over time (ICPR, 2006, 2007). However, different damage modelling approaches are applied by ripar-ian countries (Meyer and Messner, 2005), and these can yield substantial differences in terms of absolute damage values (de Moel and Aerts, 2011), and the results are often diffi-cult to compare. Therefore, usually one flood damage mod-elling approach needs to be chosen and agreed upon by the various stakeholders when conducting such joint assessments (ICPR, 2001a; Silva and Reuter, 2006). This makes it impor-tant to understand to what extent various damage modelling approaches used in different riparian countries or regions in-fluence estimates of relative changes in flood damage devel-opments. In order to improve such relative estimates, it is es-pecially of interest to understand whether variations between the damage modelling approaches stem from the uncertain-ties in the damage curves or from differences in estimating the exposed asset values linked to these curves.
Studies that have evaluated the possible range of flood damage developments have commonly addressed the uncer-tainties originating from projections of socio-economic de-velopment and climate change by applying alternative sce-narios for land-use change and flood probabilities linked to climate change (Hall et al., 2005; ABI, 2009; Bouwer et al., 2010). In addition, when focusing on the river Rhine in North-Western Europe, several scenario studies have evalu-ated the relative influence of climate and land-use change on flood damage developments (Klijn et al., 2007; Aerts et al., 2008; te Linde et al., 2011). However, it is largely unknown how different flood damage modelling approaches influence estimates of relative changes in the development of poten-tial flood damage, as compared with those scenarios. This is because, although previous studies have applied a range of scenarios, they have generally only used one damage mod-elling approach to assess changes in flood damage.
The aim of the current study is, therefore, to evaluate the reliability of relative estimates of flood damage develop-ments for the river Rhine with regard to different flood dam-age modelling approaches. We explain the differences for two damage models through simulating the effects of socio-economic development, reflected by land-use scenarios, on flood damage between 1990 and 2030. These two damage models have been used earlier to assess potential flood dam-age in the Rhine Basin: the flood damdam-age model used for the development of the Rhine Atlas (ICPR, 2001a) and the one called the “Damage Scanner” (Klijn et al., 2007). Fur-thermore, we will investigate whether variations in absolute and relative damage estimates between the approaches result from differences in damage functions or from the estimation of the exposed asset values. Finally, the variations stemming from the application of different flood damage modelling approaches are compared with the uncertainties originating from land-use projections.
The remainder of the article proceeds as follows: Sect. 2 provides a general introduction to flood damage modelling approaches. Section 3 describes the study area and discusses the data and methods applied in the present study. The results are presented and discussed in Sect. 4. Section 5 concludes.
2 Flood damage assessments
present study, exposure information is usually based on the spatial aggregation of the exposed assets. Most commonly, meso-scale models combine information on land-use types for estimating assets at risk and information on inundation depth for simulating the hazard. On the macro-scale, even larger units, such as municipalities, regions or countries, are used for damage estimations (Merz et al., 2010).
A standard approach to quantify flood damage is the use of stage-damage functions (Smith, 1994; Merz et al., 2007). These can be developed using two different methodologi-cal approaches (Merz et al., 2010). First, empirimethodologi-cal dam-age functions can be constructed on the basis of observed flood damage data. For example, the HOWAS database, which was maintained in Germany (Merz et al., 2004) and is now integrated in the HOWAS21 database1, is a collection of observed damage cases, and has provided the basis for the derivation of the damage functions applied in the Rhine At-las (ICPR, 2001a). Second, stage-damage functions can be derived using synthetic approaches, which are based on ex-pert judgement. Following this approach, exex-perts from, for instance the insurance industry, estimate the damage that can be expected for different types of objects and assets when certain flood characteristics occur. The HIS-SSM damage model, which is the standard software in the Netherlands to evaluate flood damage (Kok et al., 2005), and the Multi-coloured Manual in the UK (Penning-Rowsell et al., 2005) are both examples of this approach, although the HIS-SSM model also includes some empirical information. For more detailed overviews of flood damage assessment approaches and their various aspects, see Merz et al. (2010) and Messner et al. (2007).
3 Study area, data, and methods
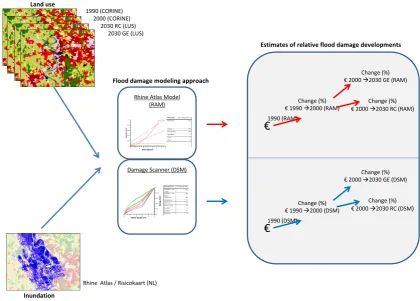
Our research approach to study the reliability of estimates of relative changes in the development of potential flood dam-age is shown in Fig. 1. The river Rhine was chosen as a case study because it is the largest and economically most impor-tant river in Western Europe. Furthermore, the river basin is shared by nine countries, which need to engage in trans-boundary flood risk management and, being part of this, need to jointly evaluate the effectiveness of risk-reducing mea-sures (ICPR, 2007). We apply two meso-scale flood damage models that have been commonly used for flood damage as-sessments along the Rhine: the Rhine Atlas model used by the ICPR (ICPR, 2001a), and what is called the “Damage Scanner” (Klijn et al., 2007). The two models have been selected because they show a large variability in absolute damage estimates (de Moel and Aerts, 2011), and have been derived using different methodological approaches. In both models, potential flood damage is quantified with the help of depth-damage functions that define for each land-use type
1 http://nadine-ws.gfz-potsdam.de:8080/howasPortal/client/ start
the potential damage, depending on the given inundation-depth at the respective location. Other flood characteristics are not considered. The absolute flood damage estimates de-rived from applying the two models in the case study area are used to evaluate the relative change (in percentages) in flood damage owing to land-use change between 1990 and 2000, as well as between 2000 and the two land-use pro-jections for 2030. Estimates of relative changes according to the two models are compared with each other in order to gain insights into the reliability of relative estimates of flood damage developments with regard to different flood damage modelling approaches. The remainder of this section de-scribes the study area, the data, and the methods applied in the present study in greater detail.
3.1 River Rhine basin
The river Rhine originates in the Swiss Alps and flows through Austria, Switzerland, France and Germany into the Netherlands, where it eventually bifurcates into the North Sea and the Lake IJssel. The river basin area is about 197 000 km2, and is shared by nine countries. The basin is densely populated, and, in total, about 58 million peo-ple live in the area (ICPR, 2001a, 2008). Especially since the 19th century, the Rhine has developed into an impor-tant traffic route and is today one of the world’s most traf-ficked and used waterways. It connects one of the world’s largest sea harbours in Rotterdam, the Netherlands, with the world’s largest inland harbour in Duisburg and other indus-trial complexes in Germany, France, and Switzerland. Every year, about 200 000 vessels cross the Dutch-German border, transporting approximately 200 million tons of goods (ICPR, 2008).
Rhine Atlas Model
(RAM)
Flood damage modeling approach
1990 (CORINE) 2000 (CORINE)
2030 RC (LUS) 2030 GE (LUS)
Land use
Inundation
Damage Scanner (DSM)
€
1990 (RAM)Change (%) € 1990 Æ2000 (RAM)
Change (%) € 2000 Æ2030 GE (RAM)
Change (%) € 2000 Æ2030 RC (RAM)
€
1990 (DSM)Change (%) € 1990 Æ2000 (DSM)
Change (%) € 2000 Æ2030 GE (DSM)
Change (%) € 2000 Æ2030 RC (DSM)
Estimates of relative flood damage developments
Rhine Atlas / Risicokaart (NL)
Fig. 1. Flow chart of the input data and method applied to evaluate the reliability of relative estimates of flood damage developments.
3.2 Inundation data
For the Rhine and its floodplains up to the Netherlands, we use the inundation map that was developed by the Interna-tional Commission for the Protection of the Rhine (ICPR, 2001a). A 100×100 m grid map was derived from the orig-inal vector data set that provides information on the flood extent and seven different classes of inundation depths, rang-ing from 50 cm to 5 m and above. For the part of the Rhine in the Netherlands, updated and improved information on potentially inundated areas is available in the form of the Dutch “Risicokaart”. The “Risicokaart”, which is based on hydro-dynamical modelling, shows the maximum inundation depths that are derived from numerous simulations of dyke breaches (Wouters and Holterman, 2007). It was originally provided at a spatial resolution of 50 m×50 m and was re-sampled to a 100 m×100 m resolution grid. The combined inundation map for the Rhine channel shows flood extent and depths for extreme discharge events, with events rang-ing from an average frequency of occurrence of 1/200 yr at the Upper Rhine to 1/2000 yr in the Dutch delta area, and has been applied earlier in a study on future flood damage (e.g. te Linde et al., 2011). Only those areas in the Dutch delta that are prone to river flooding from the Rhine were included. Those areas that face flood risk, mainly from coastal storm
surges in combination with high but not extreme river dis-charges, were not included. It should be noted that the inun-dation map used in the present study does not represent a re-alistic flooding scenario, because there will never be enough water in a single event to inundate the entire area. Instead, it provides an indication of the potential maximum hazard facing all the economic assets exposed to floods along the Rhine.
3.3 Land-use information
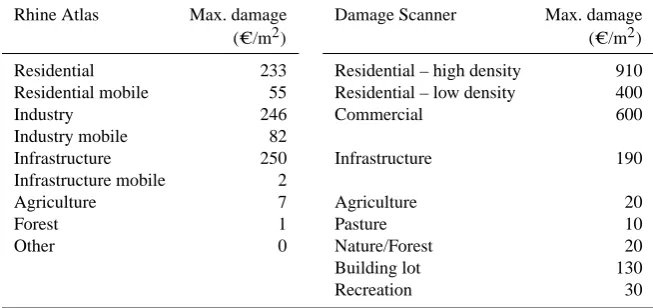
Table 1. Maximum damage values for land-use classes of the Rhine Atlas and the Damage Scanner models (at 2000 prices).
Rhine Atlas Max. damage Damage Scanner Max. damage
( C/m2) ( C/m2)
Residential 233 Residential – high density 910
Residential mobile 55 Residential – low density 400
Industry 246 Commercial 600
Industry mobile 82
Infrastructure 250 Infrastructure 190
Infrastructure mobile 2
Agriculture 7 Agriculture 20
Forest 1 Pasture 10
Other 0 Nature/Forest 20
Building lot 130
Recreation 30
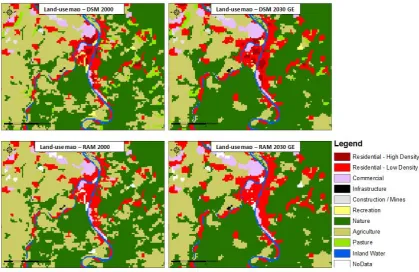
is based on microeconomic theory, and uses socio-economic scenarios to simulate land-use patterns on the basis of spa-tial claims (expected quantity of land-use change), suitabil-ity, and policy maps (Fig. 2).
The existing Land Use Scanner model for the Rhine (see te Linde et al., 2011) has been forced with two contrasting socio-economic scenarios to produce future land-use maps (Fig. 2). These scenarios are derived from the EURURALIS project (Verburg et al., 2008; Verburg and Overmars, 2009), and describe future spatial claims for the Rhine area. The Global Economy scenario (GE) assumes a world with high economic and population growth, international economic in-tegration and a strong influence of private interests. A weak government is assumed that enforces little environmental regulation. The GE scenario results in a land-use projec-tion that sees a large increase in urban land use. No restric-tions in terms of urban development are applied to areas at risk of flooding due to the weak role of the government as-sumed for this scenario. In contrast, the Regional Communi-ties scenario (RC) assumes a world with little economic and population growth and a strong regional focus. In this sce-nario, a strong government is foreseen that enforces strict environmental regulations such as spatial zoning in flood-prone areas. The RC scenario leads to a land-use change projection that sees far less urban development, which is con-siderably restricted in areas at risk from flooding. The GE and RC scenarios are comparable to the A1 and B2 scenarios of the Intergovernmental Panel on Climate Change, respec-tively (IPCC, 2000). While no probability is attached to each of these two scenarios, we assume that the two scenarios re-flect the possible bandwidth of future changes in land use and urban development. For a more detailed description on the downscaling approach and the development of these land-use projections, the reader is referred to te Linde et al. (2011).
3.4 Damage models
On the basis of the flood inundation map (Sect. 3.2) and the four land-use maps (Sect. 3.3), two flood damage mod-elling approaches are used to calculate potential flood dam-age along the Rhine for the years 1990, 2000, and the two projections for 2030.
3.4.1 Rhine Atlas damage model
The Rhine Atlas damage model (RAM) was developed for the International Commission for the Protection of the Rhine (ICPR, 2001b). The method uses five depth-damage func-tions to calculate potential flood damage. The funcfunc-tions were constructed on the basis of the HOWAS database, and are thus empirical in nature, even though additional expert judge-ment has been used to select and combine entries from the HOWAS database (ICPR, 2001b). Even though the RAM has been developed to estimate potential flood damage along the trans-boundary river Rhine, it is thus largely based on empirical damage data from Germany.
The depth-damage functions are linked to five re-classified CORINE land cover classes, of which three reflect urban land-use types (residential, industrial, and infrastructure). For the three urban categories, separate damage values for property and contents are used in the RAM (see Table 1) (ICPR, 2001a). The model considers direct tangible flood damage that is caused by physical contact between floodwa-ter and the economic assets at risk. Not reflected in the RAM is indirect damage, such as losses due to the disruption of production processes, and also intangible damage, such as loss of life.
3.4.2 Damage Scanner model
41 1
2
Figure 2: Land use maps for 2000 and 2030 (GE scenario) used as input for the RAM and the DSM.
3
4
5
Fig. 2. Land use maps for 2000 and 2030 (GE scenario) used as input for the RAM and the DSM.
information on inundation depth with seven depth-damage functions (see Table 1 and Fig. 3). It has been used in various studies that assess the impact of future land use on potential flood damage at various scales: amongst others, along the Rhine and especially in the Rhine delta (Aerts et al., 2008; Bouwer et al., 2010; te Linde et al., 2011; de Moel et al., 2011). As the functions of the DSM are based on the HIS-SSM, which is the standard software in the Netherlands to assess flood damage, they are based on some empirical in-formation as well as expert judgment and thus are mainly synthetic in nature. The model predominantly estimates di-rect tangible damage. However, the DSM also implicitly in-cludes a share of 5 per cent indirect damage. This latter type of damage reflects potential losses in economic turnover due to traffic interruption or emergency costs.
3.4.3 Comparison of the RAM versus the DSM
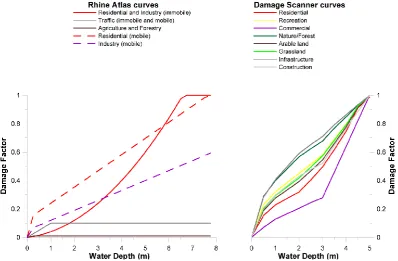
Differences between the two models can be found both in the applied damage curves and in the maximum damage values linked to the respective damage categories. Figure 3 displays the shape of the damage curves of the RAM and the DSM. These curves are used to calculate the fraction of the maxi-mum damage (damage factor) occurring in a grid cell, based on the respective inundation depth.
When comparing the residential damage curves from both models (solid red lines), it becomes apparent that the curve of the DSM is steeper compared with that of the RAM. For
instance, at 4 m water depth, the RAM curve gives a age factor of about 0.4, while the DSM curve gives a dam-age factor of about 0.8. In addition, both models differ in their assumption at which water level the maximum damage is reached. According to the DSM, maximum damage of all land-use types is reached at a water level of about 5 m. In contrast, the RAM assumes that a water level of 5 m results in about 60 per cent of the maximum damage for residential and commercial areas. These differences in the functions reflect the uncertainties still associated with depth-damage curves in flood damage modelling (e.g. Freni et al., 2010). These un-certainties stem from the large variability of observed dam-age even among similar elements at risk. Two buildings that share the same physical characteristics and that are situated next to each other can nevertheless experience largely differ-ent amounts of damage during the same flood evdiffer-ent. This is because not only flood impact parameters, such as flow ve-locity and the contamination of flood water, but also flood resistance parameters, such as flood experience and precau-tionary measures, can significantly differ even within short distances (Merz et al., 2010).
42 1
2
Figure 3: Damage curves for the Rhine Atlas and the Damage Scanner model (Adapted from de Moel and Aerts,
3
2011)
4
5
6
Fig. 3. Damage curves for the Rhine Atlas and the Damage Scanner model (Adapted from de Moel and Aerts, 2011).
Table 1 shows that the maximum damage for similar dam-age categories is significantly higher in the DSM compared with the RAM. For instance, the residential category of the RAM has a maximum damage of 288 C m−2 (sum of resi-dential and resiresi-dential mobile), while the maximum damage of the DSM is 910 C m−2for high density urban areas, and 400 C m−2 for low density urban areas. As a comparison, the standard flood loss model in the UK estimates a maxi-mum damage value of 750 £ m−2(865 C m−2)2for a resi-dential home (Penning-Rowsell et al., 2005). Likewise, the industrial damage category also shows a marked difference between the RAM and the DSM: it has a maximum damage of 328 C m−2in the RAM compared with 600 C m−2in the DSM. While these urban land-use classes have a maximum damage that differs roughly by a factor of 2, the difference between both agricultural land use and nature areas is even larger, by a factor of 2.8 and 20, respectively.
There are a number of reasons for the large differences in terms of maximum damage values between the RAM and the DSM. While the RAM uses depreciated asset val-ues, the DSM is, at least in some instances, based on re-placement costs, such as those for building structures and contents (Briene et al., 2002). Differences in price lev-els among the riparian countries cannot serve as an expla-nation for the large variations in terms of maximum dam-age values, as purchasing power is only marginally different (see ICPR, 2001b). Damage to vehicles, which can make
2According to exchange rates of 19 August 2011
Table 2. Potential flood damage along the Rhine (Million C) for
different time-steps, according to the Rhine Atlas and the Damage Scanner damage model.
1990 2000 2030 RC 2030 GE
Rhine Atlas model 74 591 77 749 86 982 108 158 Damage Scanner model 290 883 300 463 323 608 380 684 Difference factor between models 3.8 3.8 3.7 3.5
4 Results and discussion
4.1 Absolute flood damage estimates
An overview of potential damage along the Rhine according to the RAM and the DSM model for 1990, 2000, and to the two socio-economic scenarios (2030), as well as their dif-ference factors, is provided in Table 2. Both model results differ significantly in terms of absolute damage estimates by a factor ranging from 3.5 to 3.8. In general, the RAM gives much lower results compared with the DSM. The results are in line with several other studies that have stressed the vari-ations related to the assessment of direct flood damage (e.g. Merz et al., 2004; Apel et al., 2008; Freni et al., 2010). De Moel and Aerts (2011), for instance, estimate flood damage for a Dutch polder area using three different damage mod-elling approaches, and find differences up to a factor of 4.
The large variations in absolute damage estimates can be attributed to existing uncertainties in the shapes of damage curves and to methodological differences for estimating the underlying exposed asset values of the respective damage categories, which were discussed in Sect. 3.4.3.
To identify whether variations between the models in ab-solute damage estimates result from differences in the un-derlying maximum damage values or from differences in the damage curves, we performed an additional model-run with the RAM, using the maximum damage values of the DSM. This model-run is referred to as RAMDSM. By comparing the results of the RAMDSMwith the results of the RAM, we can estimate how the differences in maximum damage val-ues influence absolute damage estimates, because both the RAM and the RAMDSMuse the same damage functions. By comparing the results of the DSM with the results of the RAMDSM, we can estimate how the differences in damage functions influence the absolute damage estimates, because both the DSM and the RAMDSM use the same maximum damage values. An overview of the absolute damage esti-mates for the RAMDSMand the difference factors between the RAM and the RAMDSM, and between the DSM and the RAMDSM, are provided in Table 3. It is shown that differ-ences in the maximum damage values have a smaller influ-ence on variations in absolute damage estimates between the two models (by a factor 1.8 for all time steps) than differ-ences in the functions (by a factor of 1.93–2.13).
Table 3. Absolute damage estimates of the model-run RAMDSM
and difference factors between the RAM and the RAMDSM, and between the DSM and the RAMDSM.
1990 2000 2030 RC 2030 GE
RAMDSM 136 674 142 366 159 389 197 678 Diff. due to max. damage value* 1.83 1.83 1.83 1.83 Difference due to function** 2.13 2.11 2.03 1.93
* RAMDSMvs. RAM (difference factor). ** DSM vs. RAMDSM(difference factor).
Other studies that have investigated the influence of dif-ferent damage functions on absolute damage estimates have come to similar conclusions. For instance, Apel et al. (2009) compare the results of several damage modelling approaches with recorded flood damage and find that differences in dam-age curves can lead to relative errors ranging from−87 per cent to 34 per cent. Since the same exposure data was used for all model runs, the influence of different maximum dam-age values on absolute damdam-age estimates was not assessed in the study of Apel et al. (2009).
4.2 Estimates of relative changes in the development of potential flood damage
43 1
2
Figure 4: Relative increase (in %) in potential flood damages along the Rhine according to the Rhine Atlas and
3
Damage Scanner models
4
Note: 2000 values are compared with 1990, and 2030 values are compared with those of 2000.
5
6
7
8
9
10
11
12
13
14
15
16
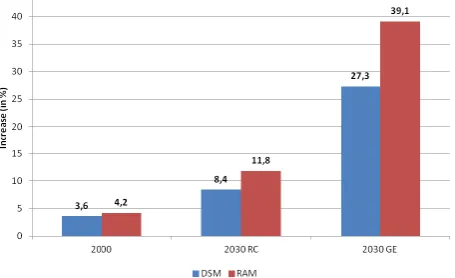
Fig. 4. Relative increase (in %) in potential flood damage along the
Rhine, according to the Rhine Atlas and the Damage Scanner mod-els. Note: 2000 values are compared with 1990, and 2030 values are compared with those of 2000.
from differences in the underlying maximum damage values or from differences in the damage curves, we again compare the RAMDSMwith the RAM and with the DSM. An overview of the relative estimates of flood damage developments of the RAMDSMand the difference factor between the relative es-timates of the RAMDSMand RAM, and between the relative estimates of the RAMDSMand the DSM are provided in Ta-ble 4. It is shown that differences in the relative estimates of flood damage developments are predominantly influenced by differences in the damage functions between the two models. The RAM and the RAMDSM, which use the same damage functions but different maximum damage values, perform al-most identically (by a factor of 0.99 to 1.01). In contrast, the comparison between the RAMDSMand the DSM, which use the same maximum damage values but different functions, show difference factors of 1.15 to 1.42.
The fact that differences in maximum damage values have hardly an influence on relative estimates of flood damage de-velopments in the present study can be explained by the pro-portion of grid cells that change in land use, and grid cells that remain unchanged between two time steps. For instance, when looking at the GE scenario, only 2.5 per cent of all grid cells change in land use between 2000 and 2030 in the flood prone area. For the majority of grid cells that do not change in land use, differences in maximum damage values between the two models have no influence on relative esti-mates of flood damage developments. This is because, even though the application of the RAM and the RAMDSMleads to different absolute damage values due to the differences in maximum damage values, both models foresee no change in damage between 2000 and 2030 GE for a grid cell that does not change in land use. In contrast, differences in the damage functions between the two models lead to changes in relative estimates for all grid cells. Because only a small share of grid cells change in land use, the influence of differences in maximum damage values on relative estimates of changes in the development of flood damage is small.
Table 4. Relative estimate of damage developments of the
model-run RAMDSMand difference factors between relative estimates of the RAM and the RAMDSM, and between the RAMDSMand the DSM.
1990–2000 2000 RC 2000 GE
RAMDSM 4.16 % 11.96 % 38.85 %
Diff. due to max. damage values* 0.99 1.01 0.99
Diff. due to function** 1.15 1.41 1.42
* RAMDSMto RAM (difference factor). **RAMDSMto DSM (difference factor).
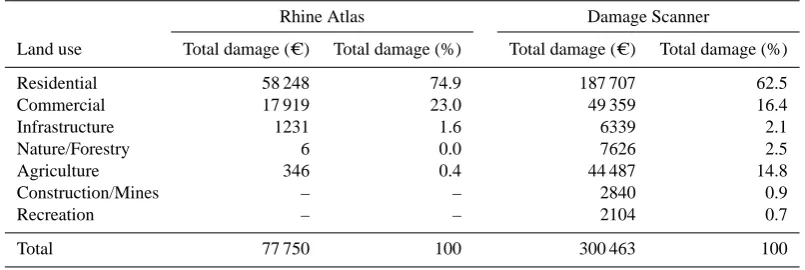
A different result is obtained when focusing only on grid cells that change in land use. For those grid cells, the influ-ence of differinflu-ence in maximum damage values is substantial, and can be explained by the different weighting of respec-tive damage categories within the individual models. Table 5 shows the percentage that each damage category, represented by land-use classes, contributes to total damage in 2000 for both models. It is shown that urban land-use classes (residen-tial and commercial) contribute about 98 per cent of the total damage in the RAM model. In the DSM model, this per-centage is considerably lower (79 per cent), and agricultural land use also contributes significantly to the overall damage (14.8 per cent).
The varying contributions of the respective damage cate-gories to the total damage of the two models is a result of the different ratio of maximum damage values across the as-signed damage categories within each of the two models (see Table 1). For example, the difference between the maximum damage of residential and agricultural land use is about a factor of 41 (288 C m−2divided by 7 C m−2)in the RAM model, while the difference between low-density residential areas, which comprise most of the residential areas, and agri-culture differs only by a factor of 20 (400 C m−2divided by 20 C m−2)in the DSM model. Because these ratios are so different, a change from agriculture to low-density residen-tial land use in the flood-prone area has a different effect on the increase in potential flood damage between the two mod-els. This will be further illustrated below by looking at the land-use change and the corresponding change in flood dam-age between 2000 and 2030 (GE scenario).
Table 5. Relative share of respective land-use types to total damage (2000) for the Rhine Atlas and the Damage Scanner models.
Rhine Atlas Damage Scanner
Land use Total damage ( C) Total damage (%) Total damage ( C) Total damage (%)
Residential 58 248 74.9 187 707 62.5
Commercial 17 919 23.0 49 359 16.4
Infrastructure 1231 1.6 6339 2.1
Nature/Forestry 6 0.0 7626 2.5
Agriculture 346 0.4 44 487 14.8
Construction/Mines – – 2840 0.9
Recreation – – 2104 0.7
Total 77 750 100 300 463 100
high-density urban areas is mainly due to the conversion of formerly low-density residential areas (Table 6), and thus re-flects an increase in urban density. Important changes among land-use types that lead to large changes in potential flood damage are highlighted in colour.
These transformations from mainly agricultural areas to urban land-use types lead to a large increase in potential flood damage for these grid cells, given the importance of urban ar-eas in both models. However, differences exist between the two models, because in the RAM model, urban damage cate-gories make up a larger share of total damage compared with the DSM model (see Table 5). This also leads to a larger increase in potential damage for grid cells that change in land use according to the RAM over time compared with the DSM.
To demonstrate this in greater detail, only those grid cells that change between agriculture and low-density residential areas between 2000 and 2030 GE are extracted and analysed separately with respect to absolute and relative changes in potential flood damage. The analysis shows that the shift of the 32 328 hectares from agricultural to low-density resi-dential areas results in a damage increase for these grid cells of 478 per cent in the RAM model, while it leads to an in-crease of 341 per cent according to the DSM model (Table 7). In addition to the predominant change between agricultural and low-density residential areas, other important land-use changes with a large effect on potential damage were anal-ysed the same way. An overview of the specific effect of im-portant changes among land-use types in terms of absolute and relative changes in potential damage for the two models is provided in Table 7.
Insights into the question: “which of the two models pro-vides more reliable estimates of flood damage developments for grid cells that change in land use?”, could be provided by information on how different damage categories have con-tributed to overall flood damage for observed flood events along the Rhine. Recorded damage data of an extreme event would be of interest for the present study, because inundation
maps of potential extreme flood events are used as input for the two damage models. However, according to our knowl-edge, such detailed data that breaks down recorded flood damage into different damage categories is not available for the Rhine. This also holds true in general: while the hydro-logical parameters of a flood are commonly evaluated in the aftermath of an event (e.g. Landesamt f¨ur Umwelt Baden-W¨urttemberg, 2000), comprehensive data on observed dam-age following from these events is scarce (e.g. S¨achsische Staatskanzlei, 2003).
Table 6. Matrix of net changes (in hectares) among the respective land use types between 2000 and 2030 GE.
Residential HD Residential LD Commercial Infrastructure Construction Recreation Nature Agriculture
Residential HD 0
Residential LD 10 499 0
Commercial −1398 −599 0
Infrastructure −26 −2 −20 0
Construction 6 23 22 0 0
Recreation −282 1410 369 13 0 0
Nature −26 4776 1071 13 17 669 0
Agriculture 1253 32 328 6504 136 125 3464 10 985 0
Total Increase (ha) 10 026 27 437 9943 210 91 2623 4465 −54 795
Note: the specific effect of the highlighted changes among land-use types in terms of changes in potential damage is provided in Table 7.
Table 7. Specific effect of important changes among land-use types in terms of potential flood damage for the two models.
Damage Scanner (DS) Rhine Atlas model (RA)
Damage (Million C) Change in damage Damage (Million C) Change in damage Net land-use change (2000–2030 GE) 2000 2030 GE Absolute Relative (%) RA 2000 RA 2030 Absolute Relative (%)
Agriculture and Residential (LD) 962 4242 3280 341 311 1800 1489 478
Residential (LD) and Residential (HD) 1831 3270 1438 79 639 639 0 0
Nature and Residential (LD) 30 460 430 1413 0.02 210 210 876 936
Agriculture and Commercial 139 1316 1176 843 32 482 450 1402
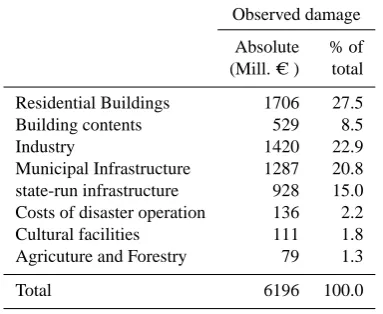
Table 8. Recorded flood damages in Saxony during the Elbe flood
in 2002
Observed damage
Absolute % of
(Mill. C ) total
Residential Buildings 1706 27.5
Building contents 529 8.5
Industry 1420 22.9
Municipal Infrastructure 1287 20.8
state-run infrastructure 928 15.0
Costs of disaster operation 136 2.2
Cultural facilities 111 1.8
Agricuture and Forestry 79 1.3
Total 6196 100.0
Source: adapted from S¨achsische Staatskanzlei (2003).
such their narrow shapes, infrastructural elements are un-derrepresented in land-use maps of this resolution. Bouwer et al. (2009) show that the share of potential flood dam-age to infrastructure in overall losses increases from 3.9 to 8 per cent in a Dutch polder area, when switching from a 100 m×100 m to a 25 m×25 m grid resolution. Second, the recorded damage data of the Elbe flood suggest that both models might overestimate the contribution of residential ar-eas to overall losses. According to the RAM and the DSM,
the residential damage category contributes 75 per cent and 62 per cent, respectively (see Table 5). However, during the Elbe flood, damage to residential buildings and their contents comprised 36 per cent of overall losses. Since these obser-vations are based on a single event only, it should be noted that, in order to draw more general conclusions, more data on recorded flood damage and the contribution of different damage categories to overall losses is necessary.
5 Conclusions
asset values linked to the damage curves. As this can lead to large differences in terms of absolute damage estimates, it should always be clearly specified which type of damage and assets are taken into account, and how the attached asset values were derived.
With respect to relative estimates of flood damage devel-opments, it was found that, when estimating relative flood damage developments, both modelling approaches provide very similar results that differ by about a factor of 1.4. This number is considerably lower than it is for the difference in absolute estimates between the models, and also smaller than it is for the uncertainty inherent in projections of future ex-posure, as represented by contrasting land-use projections. With respect to potential damage, the two land-use projec-tions applied in the present study result in differences in dam-age of more than a factor of 3. In contrast to variations in ab-solute damage estimates, the differences between the dam-age modelling approaches in terms of relative changes can be attributed predominantly to the differences in the dam-age functions between the models. This is because the dif-ferences in maximum damage values only have an influence on grid cells that change in land use. As only a relatively small share of the grid cells changes between the two time steps, e.g. 2.5 per cent of all grid cells change between 2000 and 2030 GE, the differences in maximum damage values be-tween the two models have hardly any influence on relative estimates of flood damage developments. The differences in damage functions, in contrast, apply to all grid cells in the flood-prone area, which explains the larger influence on vari-ations in relative estimates, with difference factors ranging from 1.1 to 1.4.
These findings provide valuable insights for intergovern-mental river-basin organizations like the ICPR. Such organi-zations are increasingly required to engage in trans-boundary flood risk assessments under the EU Water Framework Di-rective, and usually need to choose among various flood dam-age modelling approaches when doing so. We show that the influence of different modelling approaches on estimates of relative changes in the development of flood damage is small compared with other sources of uncertainties encountered in flood damage projections.
In order to improve the reliability of relative estimates of flood damage developments, future research should focus on reducing the uncertainties of stage-damage functions, which originates from the huge variability of observed damage even among similar elements at risk. Although it is only possible to integrate this enormous variability in flood damage mod-elling approaches to a limited extent, it has been shown that model performance can be improved by integrating several damage-influencing parameters in multi-parameter damage modelling (e.g. Elmer et al., 2010). As this requires detailed data on damage processes at the level of individual objects, data collection after flood events remains a crucial activity.
Acknowledgements. The authors would like to thank Jose
Barredo and an anonymous referee for their valuable comments. This research was partly carried out in the framework of the Dutch National Research Programme Knowledge for Climate (www.knowledgeforclimate.nl), which is co-financed by the Min-istry of Housing, Spatial Planning and the Environment (VROM). We are grateful to DG Water of Rijkswaterstaat for providing additional funding to undertake this research. We thank Ton Sprong and Hendrik Buiteveld from DG Water for their valuable input. Anne Schulte-W¨ulwer-Leidig from the International Commission for the Protection of the Rhine kindly provided the inundation maps of the Rhine Atlas. Finally, we thank our colleague Wouter Botzen for his comments on an earlier version of this paper.
Edited by: M.-C. Llasat
Reviewed by: J. I. Barredo and another anonymous referee
References
ABI: The financial risk of climate change, Research paper no. 19, Association of British Insurers, London, 2009.
Aerts, J. C. J. H., Sprong, T., and Bannink, B. A. (Eds.): Aandacht voor veiligheid, Leven met Water, Klimaat voor Ruimte, DG Wa-ter, 2008.
Apel, H., Merz, B., and Thieken, A. H.: Quantification of uncer-tainties in flood risk assessments, Int. J. River Basin Manage., 6, 149–162, 2008.
Apel, H., Aronica, G. T., Kreibich, H., and Thieken, A. H.: Flood risk analyses – how detailed do we need to be?, Nat. Hazards, 49, 79–98, 2009.
Borsboom-van Beurden, J. A. M., Bakema, A., and Tijbosch, H.: A land-use modelling system for environmental impact assessment; recent applications of the lumos toolbox, in: Modelling land-use change: Progress and applications, edited by: Koomen, E., Still-well, J., Bakema, A., and Scholten, H. J., Springer, Dordrecht, 281–296, 2007.
Bossard, M., Feranec, J., and Otahel, J.: Corine land cover tech-nical guide – addendum 2000, European Environment Agency, Copenhagen, 2000.
Bouwer, L. M., Bubeck, P., Wagtendonk, A. J., and Aerts, J. C. J. H.: Inundation scenarios for flood damage evaluation in polder areas, Nat. Hazards Earth Syst. Sci., 9, 1995–2007, doi:10.5194/nhess-9-1995-2009, 2009.
Bouwer, L. M., Bubeck, P., and Aerts, J. C. J. H.: Changes in fu-ture flood risk due to climate and development in a dutch polder area, Glob. Environ. Change – Human and Policy Dimensions, 20, 463–471, 10.1016/j.gloenvcha.2010.04.002, 2010.
Briene, M., Koppert, S., Koopmann, A., and Verkennis, A.: Finan-ciele onderbouwing kengetallen hoogwaterschade, Netherlands Economic Institute (NEI), Rotterdam, 2002.
B¨uchele, B., Kreibich, H., Kron, A., Thieken, A., Ihringer, J., Oberle, P., Merz, B., and Nestmann, F.: Flood-risk mapping: contributions towards an enhanced assessment of extreme events and associated risks, Nat. Hazards Earth Syst. Sci., 6, 485–503, doi:10.5194/nhess-6-485-2006, 2006.
de Moel, H., van Alphen, J., and Aerts, J. C. J. H.: Flood maps in Europe – methods, availability and use, Nat. Hazards Earth Syst. Sci., 9, 289–301, doi:10.5194/nhess-9-289-2009, 2009. de Moel, H., Aerts, J. C. J. H., and Koomen, E.: Development of
flood exposure in the Netherlands during the 20th and 21st cen-tury, Glob. Environ. Change – Human and Policy Dimensions, 21, 620–627, 2011.
Dircke, P., Aerts, J. C. J. H., and Molenaar, A.: Connecting delta cities – Sharing knowledge and working on adaptation to climate change, Rotterdam, 2010.
Dutta, D., Herath, S., and Musiakec, K.: A mathematical model for flood loss estimation, J. Hydrol., 277, 24–49, 2003.
Elmer, F., Thieken, A. H., Pech, I., and Kreibich, H.: Influence of flood frequency on residential building losses, Nat. Hazards Earth Syst. Sci., 10, 2145–2159, doi:10.5194/nhess-10-2145-2010, 2010.
EU: Directive 2007/60/EC of the European Parliament and of the Council of 23 October 2007 on the assessment and management of flood risks, Commission of the European Communities (EU), Brussels, Belgium, 2007.
Feyen, L., Barredo, J. I., and Dankers, R.: Implications of global warming and urban land-use change on flooding in Europe, in: Water and urban development paradigms, edited by: Feyen, J., Shannon, K., and Neville, M., Taylor § Francis, London, 217– 225, 2009.
Freni, G., La Loggia, G., and Notaro, V.: Uncertainty in urban flood damage assessment due to urban drainage modelling and depth-damage curve estimation, Water Sci. Technol., 61, 2979–2993, 2010.
Hall, J. W., Sayers, P. B., and Dawson, R. J.: National-scale assess-ment of current and future flood risk in england and wales, Nat. Hazards, 36, 147–164, 2005.
Hallegatte, S.: An adaptive regional input-output model and its ap-plication to the assessment of the economic cost of katrina, Risk Analysis, 28, 779–799, doi:10.1111/j.1539-6924.2008.01046.x, 2008.
Hallegatte, S.: Strategies to adapt to an uncertain climate change, Glob. Environ. Change – Human and Policy Dimensions, 19, 240–247, doi:10.1016/j.gloenvcha.2008.12.003, 2009.
Hilferink, M. and Rietveld, P.: Land use scanner: An integrated gis model for long-term projections of land use in urban and rural areas, J. Geogr. Syst., 1, 155–177, 1999.
ICPR: Atlas of flood danger and potential damage due to extreme floods of the Rhine, International Commission for the Protection of the Rhine, Koblenz, 2001a.
ICPR: ¨Ubersichtskarten der ¨Uberschwemmungsgef¨ahrung und der m¨oglichen Verm¨ogenssch¨aden am Rhein, Abschluss-bericht: Vorgehensweise zur Ermittlung der m¨oglichen Verm¨ogenssch¨aden, Internationale Komission zum Schutz des Rheins, Wiesbaden, Heidelberg, Nijmwegen, M¨unchen, 2001b. ICPR: Nachweis der Wirksamkeit von Massnahmen zur Minderung
der Hochwasserst¨ande im Rhein infolge der Umsetzung des Ak-tionsplans Hochwasser bis 2005, Internationale Komission zum Schutz des Rheins, Koblenz, 2006.
ICPR: Communiqu´e of the 14th conference of Rhine ministers, Bonn (18.10.07), International Commission for the Protection of the Rhine, 2007.
ICPR: The rhine: A river and its relations, International Commis-sion for the Protection of the Rhine, Koblenz, 2008.
IPCC: Emission scenarios: Special report of the Intergovernmental Panel on Climate Change, Cambridge University Press, Cam-bridge, UK, 2000.
IPCC: Climate change 2007: The physical science basis, Contribu-tion of Working Group I to the Fourth Assessment Report of the Intergovernmental Panel on Climate Change, Cambridge Univer-sity Press, 2007.
Jonkman, S. N., Vrijling, J. K., and Vrouwenvelder, A. C. W. M.: Methods for the estimation of loss of life due to floods: A litera-ture review and a proposal for a new method, Nat. Hazards, 46, 353–389, 2008.
Klijn, F., Baan, P. J. A., De Bruijn, K. M., and Kwadijk, J.: Over-stromingsrisico’s in Nederland in een veranderend klimaat, WL
|delft hydraulics, Delft, Netherlands, 1–166, 2007.
Kok, M., Huizinga, H. J., Vrouwenvelder, A. C. W. M., and Barendregt, A.: Standaardmethode2004 – schade en slachtof-fers als gevolg van overstromingen, RWS Dienst Weg- en Wa-terbouwkunde, 2005.
Kreibich, H., Seifert, I., Merz, B., and Thieken, A.: Development of FLEMOcs – a new model for the estimation of flood losses in the commercial sector, Hydrol. Sci. J., 55, 1302–1314, 2010. Kron, W. and Thumerer, T.: Water-related disasters: Loss trends
and possible countermeasures from a (re-)insurers point of view Germany, 2002.
Lammersen, R., Engel, H., van de Langemheen, W., and Buiteveld, H.: Impact of river training and retention measures on flood peaks along the Rhine, J. Hydrol., 267, 115–124, 2002. Landesamt f¨ur Umwelt Baden-W¨urttemberg: Das Hochwasser vom
Oktober/November 1998 in Baden-W¨urttemberg, in: Oberirdis-che Gew¨asser, Gew¨asser¨okologie, 65, 144 pp., 2000.
Loonen, W. and Koomen, E.: Calibration and validation of the land use scanner allocation algorithms, Netherlands Environmental Agency, Bilthoven, 2009.
Luino, F., Cirio, C., Biddoccu, M., Agangi, A., Giulietto, W., Godone, F., and Nigrelli, G.: Application of a model to the evaluation of flood damage, GeoInformatica, 13, 339–353, doi:10.1007/s10707-008-0070-3, 2009.
Maaskant, B., Jonkman, S. N., and Bouwer, L. M.: Future risk of flooding: An analysis of changes in potential loss of life in south Holland (the Netherlands), Environ. Sci. Policy, 12, 157–169, 2009.
Merz, B., Kreibich, H., Thieken, A., and Schmidtke, R.: Estimation uncertainty of direct monetary flood damage to buildings, Nat. Hazards Earth Syst. Sci., 4, 153–163, doi:10.5194/nhess-4-153-2004, 2004.
Merz, B., Thieken, A. H., and Gocht, M.: Flood risk mapping at the local scale: Concepts and challenges, in: Flood risk manage-ment in Europe – innovation in policy and practice, edited by: Begum, S., Stive, M. J. F., and Hall, J. W., Advances in natural and technological hazards research, Springer, Dordrecht, Nether-lands, 231–251, 2007.
Merz, B., Kreibich, H., Schwarze, R., and Thieken, A.: Review article “Assessment of economic flood damage”, Nat. Hazards Earth Syst. Sci., 10, 1697–1724, doi:10.5194/nhess-10-1697-2010, 2010.
Meyer, V. and Messner, F.: National flood damage evaluation meth-ods – a review of applied methmeth-ods in England, the Netherlands, the Czech Republic and Germany, Umweltforschungszentrum Leipzig-Halle, Leipzig, Report No. 21/2005, 2005.
Middelkoop, H., Daamen, K., Gellens, D., Grabs, W., Kwadijk, J. C. J., Lang, H., Parmet, B. W. A. H., Sch¨adler, B., Schulla, J., and Wilke, K.: Impact of climate change on hydrological regimes and water resources management in the Rhine basin, Climatic Change, 49, 105–128, 2001.
Penning-Rowsell, E. C., Johnson, C., Tunstall, S., Tapsell, S., Mor-ris, J., Chatterton, J., and Green, C.: The benefits of flood and coastal risk management: A handbook of assessment tech-niques, Flood Hazard Research Centre, Middlesex University Press, 2005.
Silva, W. and Reuter, C.: Risikoanalyse f¨ur die
l¨ander¨ubergreifenden Deichringe am Niederrhein, Deutsch-Niederl¨andische Arbeitsgruppe Hochwasser, Aachen und Arnhem, 2006.
Smith, D. I.: Flood damage estimation – a review of urban stage-damage curves and loss functions, Water Sa, 20, 231–238, 1994. S¨achsische Staatskanzlei: Schadensausgleich und Wiederaufbau im
Freistaat Sachsen, Dresden, 2003.
te Linde, A. H., Aerts, J. C. J. H., Bakker, A. M. R., and Kwadijk, J. C. J.: Simulating low-probability peak discharges for the Rhine basin using resampled climate modeling data, Water Resour. Res., 46, W03512, doi:10.1029/2009WR007707, 2010. te Linde, A. H., Bubeck, P., Dekkers, J. E. C., de Moel, H.,
and Aerts, J. C. J. H.: Future flood risk estimates along the river Rhine, Nat. Hazards Earth Syst. Sci., 11, 459–473, doi:10.5194/nhess-11-459-2011, 2011.
Thieken, A. H., Muller, M., Kreibich, H., and Merz, B.: Flood damage and influencing factors: New insights from the Au-gust 2002 flood in Germany, Water Resour. Res., 41, W12430, doi:10.1029/2005WR004177, 2005.
Verburg, P. H. and Overmars, K. P.: Combining top-down and bottom-up dynamics in land use modeling: Exploring the future of abandoned farmlands in Europe with the dyna-clue model, Landscape Ecol., 24, 1167–1181, 2009.
Verburg, P. H., Eickhout, B., and van Meijl, H.: A multi-scale, multi-model approach for analyzing the future dynamics of Eu-ropean land use, Ann. Reg. Sci., 42, 57–77, doi:10.1007/s00168-007-0136-4, 2008.