Making It To The Top: Have Women And
Minorities Attained Equality As
Higher Education Leaders?
Dawn Wallace, Southeastern Louisiana University, USAMichael Budden, Southeastern Louisiana University, USA Rusty Juban, Southeastern Louisiana University, USA Connie Budden, Southeastern Louisiana University, USA
ABSTRACT
University presidents play a major role in setting and managing the course of higher education in the U.S. In the past, females and minorities were under-represented in such positions. However, as the number of females and minorities seeking advanced degrees has increased, the number of female and minority candidates capable of applying for such positions has increased. The purpose of this investigation was to discern whether women and minorities are proportionately represented in the halls of academic leadership.
Keywords: Higher Education Leadership; University Presidents; University Presidential Salaries
INTRODUCTION
he emphasis on equality in the United States has been a key topic in social, political, and educational arenas for decades. There have been great strides made in the goals of proportional participation and equal access in higher education. Since leadership plays an important role in higher education changes, the need for diverse leaders is important.
This paper explores women and minorities in higher education leadership positions to determine if they have achieved proportional participation and/or equal pay in academic leadership positions. Specifically, this research targets university presidents - the gatekeepers of academia. Earlier research on this topic focused on participation. However, this piece goes one step further - to also include a look at compensation. The objective of this research is three-fold: 1) to determine if women and minorities are proportionately represented in university presidential positions, 2) to learn if women and minorities reach their positions at the same rate as white males, and 3) to determine if women and minorities have achieved equal pay in higher education's top positions. This research is useful in providing a look at where women and minorities are in higher education presidency positions.
The condition of women and minority participation in higher education has been widely documented. The U.S. Department of Education provides statistical information that shows how legislation and other initiatives have greatly increased the number of women and minority graduates at all levels. In the employment arena, the number of women and minorities attaining leadership positions in higher education has also increased. This paper examines where women and minorities stand in the “big picture” of higher education leadership.
METHODOLOGY & FINDINGS
information on the website were sent asking for the needed information to complete the study. This research will provide a look at where women and minorities stand in the higher education leadership picture.
Objective 1 was to determine if women and minorities are proportionately represented in university presidential positions. The race and gender of the presidents in both years of the study are shown in Table 1. It is interesting to note that for both Study Year 1 (SY1, n = 614) and Study Year 2 (SY2, n = 833), the percentage of males (84%) to females (16%) was the same.
Table 1: Percentage of University Presidents by Race and Gender for Study Years (SY) 1 & 2
n=614 % of n=833 % of
Race Total Males % Females % Race Total Males % Females %
White 85.2% 444 72.3% 79 12.9% White 85.1% 594 85.3% 115 83.9% African-American 10.6% 52 8.5% 13 2.1% African-American 10.0% 69 9.9% 14 10.2%
Hispanic 2.0% 8 1.3% 4 0.7% Hispanic 1.7% 10 1.4% 4 2.9%
Native American 0.5% 3 0.5% 0.0% Native American 0.4% 3 0.4%
Other 1.8% 10 1.6% 1 0.2% Other 2.9% 20 2.9% 4 2.9%
TOTAL 517 97 TOTAL 696 137
Academic Year 2007/2008 Academic Year 2012/2013
Further, an additional analysis between Private and Public universities in SY2 yielded similar results for both gender and white/minority comparisons, which is indicated in Table 2.
Table 2: Percentage of University Presidents by Race and Gender and Type of University SY2 Gender (n=833) Total Public % Private %
FEMALES 137 68 17% 69 16%
MALES 696 340 83% 356 84%
TOTAL 833 408 425
Race (n=833) Total Public % Private %
White 85.0% 335 82.1% 373 87.8%
African-American 10.1% 46 11.3% 38 8.9%
Hispanic 1.7% 10 2.5% 4 0.9%
Native American 0.4% 2 0.5% 1 0.2%
Other 2.9% 15 3.7% 9 2.1%
TOTAL 408 425
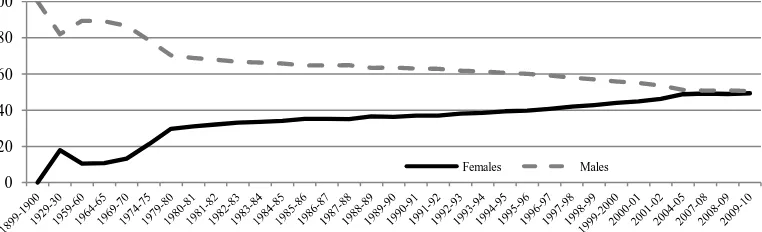
In this study, while the percentages of females and minorities who achieved the position of university president were considerably lower than those of white males, it is necessary to look at the historical data of higher education to get the full picture. Women and minority participation lagged significantly behind white males in the early years of higher education's history. As a result, their participation in post-graduate studies, which is a requirement for almost all seeking to earn a presidential post, also got a later start. For example, a statistical illustration provided by the National Center for Educational Statistics (NCES) shows that women did not begin earning doctoral degrees until the late 1800s (see Graph 1). However, females (51.7%) now earn more doctoral degrees than males (48.3%).
0 20 40 60 80 100
Table 3 indicates the divide between minority and white doctoral degree attainment for the three academic years - 1999-2000, 2004-2005, and 2009-2010. As indicated in Table 3, the number of doctoral degrees conferred on Blacks, Hispanics, Asians, and Native Americans during this time period increased. As an example, the number of Blacks receiving doctoral degrees increased some 47% in the ten-year time period.
Table 3: Number and Percentage Change in Doctoral Degrees Conferred to U.S. Residents: Academic Years 1999-2000, 2004-2005, and 2009-2010
To provide further insight on women and minority participation, Objective 2 of this study was to determine if females and minorities reach their positions of university president at the same rate as white males. While there has not been a "clear-cut" path to a presidency, one known fact is that the path requires candidates to have a proven record of experience through many years of academic, professional, and/or military service. Therefore, this study looked at the number of years from the president's terminal degree to their first presidency. Both the year of terminal degree attainment and year of first presidential post were found for 485 of the presidents in this study. Table 4 indicates the number of years from terminal degree attainment to the appointment for those in the study.
Table 4: Average Time from Terminal Degree Attainment to First Presidency
Race % of Males 82.5% Females 17.5%
n=485 Total Count Years Count Years
White 85.6% 344 22.9 71 22.8
African-American 10.7% 42 19.6 10 22.1
Hispanic 1.6% 6 24.8 2 21.0
Other 2.1% 8 21.8 2 32.5
TOTAL 400 22.57 85 22.93
White (22.8 years), African American (22.1 years), and Hispanic (21.0 years) females in presidential positions all achieved their presidencies in less time than their white male counterparts. Arguably, white females and white males earned their presidency in relatively the same time. So, while the number of females and minorities may not yet be proportionately represented, they are currently achieving such appointments at a quicker pace than their white male counterparts. African-American and Hispanic females are reaching presidential status approximately one year quicker than white males, which is similar to a finding in an earlier study (Wallace et al., 2009).
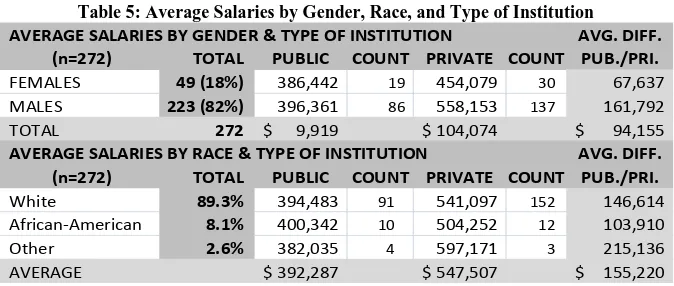
The goal of Objective 3 was to determine if women and minorities have achieved equal pay in higher education's top positions. For SY2, average salaries were calculated for both gender and race and differentiated by type of institution. The results of this study indicate that for the public sector, there are no significant wage gaps between males ($396,361) and females ($386,442) (see Table 5). Also, when analyzing race differences, African-Americans ($400,342) out-earn white presidents (394,483) by an average of $6,000. The private sector produced the largest average compensation gaps between males ($558,153) and females ($454,079).
PERCENT 1999-2000 2004-05 2009-10 1999-2000 2004-05 2009-10 CHANGE
TOTAL 106,494 118,369 140,505 100 100 100 31.94 White 82,984 89,763 104,426 77.92 75.83 74.32 25.84
Black 7,080 8,527 10,417 6.65 7.20 7.41 47.13 Hispanic 5,039 6,115 8,085 4.73 5.17 5.75 60.45 Asian/Pacific Islander 10,684 13,176 16,625 10.03 11.13 11.83 55.61 Am. Indian/Alaska Native 707 788 952 0.66 0.67 0.68 34.65
NUMBER PERCENTAGE
Table 5: Average Salaries by Gender, Race, and Type of Institution AVERAGE SALARIES BY GENDER & TYPE OF INSTITUTION AVG. DIFF.
(n=272) TOTAL PUBLIC COUNT PRIVATE COUNT PUB./PRI.
FEMALES 49 (18%) 386,442 19 454,079 30 67,637
MALES 223 (82%) 396,361 86 558,153 137 161,792
TOTAL 272 $ 9,919 $ 104,074 $ 94,155
AVERAGE SALARIES BY RACE & TYPE OF INSTITUTION AVG. DIFF. (n=272) TOTAL PUBLIC COUNT PRIVATE COUNT PUB./PRI.
White 89.3% 394,483 91 541,097 152 146,614
African-American 8.1% 400,342 10 504,252 12 103,910
Other 2.6% 382,035 4 597,171 3 215,136
AVERAGE $ 392,287 $ 547,507 $ 155,220
CONCLUSION
Throughout the years, there have been many theories to explain gender compensation inequity, including women leaving career tracks in lieu of more family time, risk aversion behaviors of women, perceptions of hostile work environments, an unwillingness of females to mentor other women, and discriminatory pay practices (Luna & Medina, 2006). However, the method employed to examine participants in this study provides a different understanding to the current inequities in presidential positions. This approach calculates the number of years that it took for individuals to proceed through the academic pipeline, achieving their first presidential position after receiving the terminal degree.
For both years of the study, percentage of males and females remained the same (84%, 16%), even after widening the study to include additional participants for SY2 (833; SY1 = 614). Further, in SY2, white Presidents represented 85% of the participants, while minorities represented 15%. However, when taking into consideration the average time from terminal degree to presidency, women and men are experiencing similar results in average years. Further, the combined average of years from terminal degree to presidency was 22.63. The percentage of male (63%) and female doctoral degree attainment (37%) 22 years ago illustrates that the gender inequities in presidential positions can be largely explained by the fact that males were attaining doctoral degrees at a greater rate. In the future, the gap between males and females should equalize and women presidencies should become more common because women now surpass men in doctoral degree attainment.
For minority groups, the percent of degree attainment and presidential attainment presents a different picture. For instance, 22 years ago, African Americans represented only 3% of doctoral degree holders. In the present study, they accounted for 10% of presidents. Hispanics represented doctoral attainment at 2% of the higher education community and they represented 1.7% of presidents. Native Americans, with only 0.3% doctorates 22 years ago, can count themselves among .4% of presidents today (Wallace et al., 2009). So, among minority populations, one could argue that minority presidents are proportionately represented.
Finally, this study reveals that males are out-earning females in both public and private sectors, with a larger gap being in the private sector. However, when examining race, African Americans have the highest average income in the public sector and presidents, who were both non-white and non-African American, represented the highest average salaries in the private sector. Additional research could shed more light on the situation by providing an analysis of salary comparisons through rankings of universities and also exploring additional professional information about university presidents. Further examination of current and future presidents can paint a picture of not only where women and minorities stand, but what it takes for them to achieve these top positions in higher education.
AUTHOR INFORMATION
Dr. Michael Craig Budden is the Benjamin Paul Jones Professor of Marketing at Southeastern. His research interests include intellectual property protection, ethics, business strategy, and commercial law. E-mail: mbudden@selu.edu
Dr. Rusty Juban is an Associate Professor of Management at Southeastern. His areas of interest include organizational behavior, leadership, and human resources. E-mail: rjuban@selu.edu
Connie Budden is a Management Instructor at Southeastern. Her research interests include international business, ethics, organizational behavior, and business education. E-mail: connie.budden@selu.edu
REFERENCES
1. Wallace, D., Budden, M. C., Budden, C. B., & Walker, J. (2009, Second Quarter). Journal of Diversity Management, 4(2), 19-24.
2. Luna, G., & Medina, L. (2006, Summer). Coming full circle: Mid Career women leaving administration and returning to faculty. Advancing Women Leadership Online Journal, 21.