© 2017 IJSRST | Volume 3 | Issue 6 | Print ISSN: 2395-6011 | Online ISSN: 2395-602X Themed Section: Science and Technology
Intrusion Detection Using Secured and Efficient Data Mining
Rashmi Chaudhari
*1, Sonal Patil
2*1Second Year ME, CSE, GHRIEM, North Maharashtra University, Jalgaon, Maharashtra, India 2HOD CSE, GHRIEM, North Maharashtra University, Jalgaon, Maharashtra, India
ABSTRACT
An Intrusion detection system (IDS) is a device or a software application that monitors a network or systems for malicious activity or policy violations. Intrusion Detection Systems supports to discover, determine, and identify unauthorized use, duplication, alteration, and destruction of information systems. So, to make intrusion detection system more efficient, the techniques that are more advantageous are used here. The NSL dataset is proposed to train the intrusion detection system. The NSL dataset is used to avoid duplication of entries of intruders in the dataset. The output received by using NSL dataset and previously proposed KDD cup dataset will be compared. Also, the real-time intrusion detection can be done.
Keywords: KDD, NSL, Intrusion Detection.
I.
INTRODUCTION
Now a day, everyone keeps worrying about their assets. Everyone wants security for their assets whether it may be in the form of money or property or personal data. Here, if we take the data as asset, people must be alert from intruders. Intruders are either a person or an organization that gets into our system without permission and then access our data for either good or bad purpose. Mostly such things are done for bad purposes such as to do crime. So, Intrusion can be defined as any set of actions that threatens the integrity, availability, or confidentiality of a network resource. So, on the basis of this Intrusion detection can be defined as the act of detecting actions that attempt to compromise the confidentiality, integrity or availability of a resource. The goal of intrusion detection is to identify entities attempting to subvert in-place security controls.
An intrusion detection system (IDS) is a device or software application that monitors a network or systems for malicious activity or policy violations. Any detected activity or violation is typically reported either to an administrator or collected centrally using a security information and event management (SIEM) system. A SIEM system combines outputs from multiple sources, and uses alarm filtering techniques to distinguish malicious activity from false alarms.
The organization of this document is as follows. This paper is organized as follows. Section 1 gives Introduction. Section 2 discusses about the literature survey. Section 3 presents the proposed work. Section 4 presents research findings and analysis of those findings. In Section 5, a conclusion is given.
II.
LITERATURE SURVEY
Bhuyan et al. [2]; instead concentrates only on ML and DM techniques. However, in addition to the anomaly detection, signature-based and hybrid methods are depicted. It was shown that certain attack categories are better detected by certain algorithms.
Nguyen et al. [3] describe ML techniques for Internet traffic classification. The techniques described therein do not rely on well-known port numbers but on statistical traffic characteristics. Their survey only covers papers published in 2004 to 2007, where our survey includes more recent papers.
Sperotto et al. [5] focus on Network Flow (NetFlow) data and point out that the packet processing may not be possible at the streaming speeds due to the amount of traffic. They describe a broad set of methods to detect anomalous traffic (possible attack) and misuse.
Wu et al. [6] focus on Computational Intelligence methods and their applications to intrusion detection. Methods such as Artificial Neural Networks (ANNs), Fuzzy Systems, Evolutionary Computation, Artificial Immune Systems, and Swarm Intelligence are described in great detail. Because only Computational Intelligence methods are described, major ML/DM methods such as clustering, decision trees, and rule mining are not included.
Xia Wang et al. [7] proposes a novel method, called end-to-end detection, in detecting wormhole attacks. The theory and main design of the method have been described. It also discussed some problems in the method, which are the focus of our ongoing work and future work.
Yan Wen et al.[8] presents a new VMbased isolated execution environment called Aquarius for accessing Internet safely and transparently. Aquarius is versatile enough to coexist with the existing OS and programs. Compared to the existing isolation approaches based on the virtual machine technology, Aquarius provides two unique capabilities: reusing the pre-installed software of the host OS and transparent Internet accesses.The functional evaluation results of Aquarius illustrate its effectiveness to serve as an intrusion-tolerant approach for accessing Internet.
Manjiri V. Kotpalliwaret al. [9] have implemented SVM Intel i3 2.4 GHz processor with 4 GB RAM. It took more than 1 minute to train as well as classify large size of data. So in future we are planning to implement SVM in Grid environment by adapting SVM which will use unique SVM model in new domain. This will helps to reduce the execution time of SVM.
Zhi-tang Li et al. [10] proposed a data mining approach to generating network attack graph. The algorithm calculates the predictability scores of every attack scenarios in the attack graph as well while generating the attack graph, which represent the probabilities of the corresponding security states to have following attacks.
Surat Srinoy et al. [11] applied particle swarm optimization and support vector machine methods to intrusion detection to avoid a hard definition between normal class and certain intrusion class and could be considered to be in more than one category (or from another point of view it allows representation of overlapping categories). We introduce the current status of intrusion detection systems (IDS) and PSOSVM based feature selection heuristics, and present some possible data mining based ways for solving problems. PSOSVM based methods with data reduction for network security are discussed. Intrusion detection model is a composition model that needs various theories and techniques. One or two models can hardly offer satisfying results.
Mostafa Doroudianet al.[12] presented an ID system for detecting the anomalous behaviors at database systems as a valuable sensor of launching SOC in Iran Mobile Company (MCI). This system has been proposed for detecting malicious behavior at both transaction and inter-transaction (user task) levels in database systems. Our systems made by two vital phases; learning and detection one. The proposed system can be employed for detecting the malicious behaviors at both transaction and user task levels along with the many types of attacks (e.g. SQL injection).
L. E. Baum and J. A. Eagon [14], presents the object of this note is to prove the theorem below and sketch two applications, one to statistical estimation for (probabilistic) functions of Markov processes and one to Blakley’s model for ecology
botnet C and C channels over datasets on the order of billions of flows per day.
R. Agrawal et al [23] an efficient algorithm that generates all significant association rules between items in the database is presented. The algorithm incorporates buffer management and novel estimation and pruning techniques. We also present results of applying this algorithm to sales data obtained from a large retailing company, which shows the effectiveness of the algorithm.
Y. Bouzida and S. Gombault [24] Most current intrusion detection systems are signature based ones or machine learning based methods. Despite the number of machine learning algorithms applied to KDD 99 cup, none of them have introduced a pre-model to reduce the huge information quantity y present in the different KDD 99 datasets. We introduce a method that applies to the different datasets before performing any of the different machine learning algorithm s applied to KDD 99 intrusion detection cup. This method enables us to significantly reduce the information quantity in the different datasets without loss of information. Our method is based on Principal Component Analysis (PCA). It works by projecting data elements onto a feature space, which is actually a vector space Rd, that spans the significant variations among known data elements. We present two well-known algorithms we deal with, decision trees and nearest neighbour, and we show the contribution of our approach to alleviate the decision process. We rely on some experiments we perform over network records from the KDD 99 dataset, first by a direct application of these two algorithms on the rough data, second after projecting on of the different datasets on the new feature space.
III.
PROPOSED WORK
We present an Intruder detection system that uses Multivariate Correlation Analysis (MCA) for accurate network traffic characterization by extracting the geometrical correlations between network traffic features. Our MCA-based Intruder detection system employs the principle of anomaly-based detection in attack recognition. This makes our solution capable of detecting known and unknown Intruders effectively by learning the patterns of legitimate network traffic only.
Furthermore, a triangle-area-based technique is proposed to enhance and to speed up the process of MCA. The effectiveness of our proposed detection system is evaluated using KDD Cup 99 dataset, and the influences of both non-normalized data and normalized data on the performance of the proposed detection system are examined. The results show that our system outperforms two other previously developed state-of-the-art approaches in terms of detection accuracy.
Modules
• Loading and preprocessing dataset • Mahalanobis Distance
• Threshold Selection • Attack detection
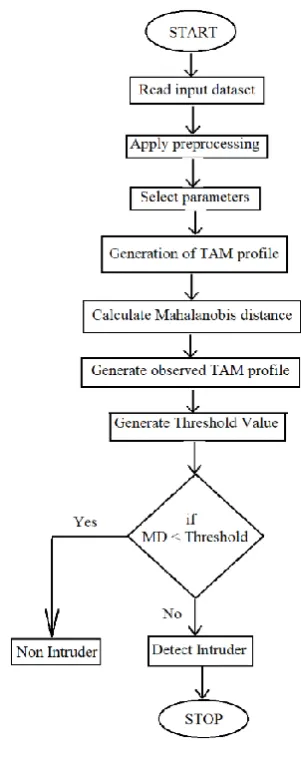
Loading and preprocessing dataset
In this module we are going to select the input spatial dataset. After the load the spatial dataset which contains geometric relevant information. After loading, view the required data. In this process we remove the unwanted values like null, missing tuples etc.
Data preprocessing is defined in terms of accuracy, completeness, consistency, timeliness, believability, and interpretability. These qualities are assessed based on the intended use of the data. Data integration combines data from multiple sources to form a coherent data store. The resolution of semantic heterogeneity, metadata, correlation analysis, tuple duplication detection, and data conflict detection contribute to smooth data integration. Data preprocessing transforms numeric data by mapping values to interval or concept labels. Such methods can be used to automatically generate concept hierarchies for the data, which allows for mining at multiple levels of granularity. Discretization techniques include binning, histogram analysis, cluster analysis, decision tree analysis, and correlation analysis. For nominal data, concept hierarchies may be generated based on schema definitions as well as the number of distinct values per attribute.
Mahalanobis Distance
Mahalanobis distance is adopted to measure the dissimilarity between traffic records Attack detection based on Mahalanobis distance. The design of the Internet is one of the fundamental reasons for successful DoS attacks. The Internet is designed to run end-to-end applications. Routers are expected to provide the best effort packet forwarding, while the sender and the receiver are responsible for achieving desired service guarantees such as quality of service and security. Accordingly, different amounts of resources are allocated to different roles. Routers are designed to handle large throughput that leads to the design of high bandwidth pathways in the intermediate network.
On the contrary, end hosts may be only assigned as much bandwidth as they need for their own applications. Consequently, each end host has less bandwidth than routers. Attackers can misuse the abundant resources in routers for delivery of numerous packets to a target.
Threshold Selection
In this module is to distinguish DoS attacks from legitimate traffic The threshold given is used to differentiate attack traffic from the legitimate one. Normal profile is greater than the threshold, it will be considered as an attack. It is powered by the triangle-area based MCA technique and the anomaly-based detection technique. A popular tool used in image segmentation is thresholding. Thresholding assumes that image present a number of components, each of a nearly homogeneous value, and that one can separate the components by a proper choice of intensity threshold. Attack detection Attack detection system that uses multivariate correlation analysis (MCA) for accurate network traffic. It characterization by extracting the geometrical correlations between network traffic features. It compares the individual tested profiles with the respective stored normal profiles.
Figure 1. Flow Chart
Attack detection
Attack detection system that uses multivariate correlation analysis (MCA) for accurate network traffic. It characterization by extracting the geometrical correlations between network traffic features. It compares the individual tested profiles with the respective stored normal profiles.
Proposed Architecture
Figure 2. System Architecture
Level 1: In this level the basic features are generated from network traffic ingress to internal network where proposed servers resides in and are used to form the network traffic records for well-defined time period. Monitoring and analyzing network to reduce the malicious activities only on relevant inbound traffic. To provide a best protection for a targeted internal network. This also enables our detector to provide protection which is the best fit for the targeted internal network because legitimate traffic profiles used by the detectors are developed for a smaller number of network services. Level 2: In this level the Multivariate Correlational Analysis is applied in which the Triangle Area Map Generation module is applied to extract the correlation between two separate features within individual traffic record. The distinct features are come from level 1 or feature normalization module in this step. All the extracted correlation are stored in a place called Triangle area Map(TAM), are then used to replace the original records or normalized feature record to represent the traffic record. Its differentiating between legitimate and illegitimate traffic records.
Level 3: The anomaly based finding mechanism is adopted in decision making/clustering/ Classification. It involves two phases as:
- Training phase. - Test phase
Normal profile generation module is work in Training phase to generate a profiles for various types of traffic records and the generated normal profiles are stored in a database. The Tested Profile Generation module is used in the test phase to build profiles for individual observed traffic records. Then at last the tested profiles are handed over to Intruder Detection module it compares tested profile with stored normal profiles. This distinguishes the Intruder from legitimate traffic. This needs the expertise in the targeted detection algorithm and it is manual task. Particularly, two levels (i.e., the Training Phase and the Test Phase) are included in Decision Making. The Normal Profile Generation module is operated in a Training Phase [1] to generate profiles for various types of legal records of traffic, and the normal profiles generated are stored in the database. The tested profile generation module is used in a Test Phase to build profiles for the each observed traffic documentation. Next, the profiles of
tested are passed over to an Intruder Detection part, which calculates the tested profiles for individual with the self-stored profiles of normal. A threshold based classifier is employed in the Intruder Detection portion module to differentiate Intruders from appropriate traffic [8].
Multivariate Correlation Analysis
Intruder traffic treat differently from the appropriate traffic of network and the behavior of network traffic is reflected by its geometric means. To well describe these statistical properties, here a novel multivariate correlation analysis (MCA) moves toward in this part. This multivariate correlation analysis approach use triangle area for remove the correlative data between features within a data object of observed (i.e. a traffic record).
Detection Mechanism
In this section, we present a threshold based on anomaly finder whose regular profiles are produced using purely legal records of network traffic and utilized for the future distinguish with new incoming investigated traffic report. The difference between an individual normal outline and a fresh arriving traffic record is examined by the planned detector. If the variation is large than a pre-determined threshold, then a record of traffic is colored as an attack otherwise it is marked as the legal traffic record.
Normal Profile Generation
Assume there is a set of ‘g’ legitimate training traffic records, Xnormal = xnormal1 ,xnormal 2 , .... , xnormal g . The triangle-area-based MCA approach is applied to analyze the records. The generated lower triangles of the TAMs of the set of g legitimate training traffic records are denoted by, XnormalTAMlower =
{TAMnormal,1lower , TAMnormal,2lower ,.,
and removing the dependency on the scale of measurement during the calculation.
Algorithm for Normal Profile Generation
In this algorithm [1] the normal profile Pro is built through the density estimation of the MDs between individual legitimate training traffic records (TAM normal, i, lower) and the expectation (TAM normal, lower) of the g legitimate training traffic records. Step 1: Input network traffic records.
Step 2: Extract original features of individual records. Step 3: Apply the concept of triangle area to extract the geometrical correlation between the jth and kth features in the vector xi.
Step 4: Normal profile generation
i. Generate triangle area map of each record. ii. Generate covariance matrix.
iii. Calculate MD between legitimate records TAM and input records TAM
iv. Calculate mean
v. Calculate standard deviation. vi. Return pro.
Step 5: Intruder Detection.
i. Input: observed traffic, normal profile and alpha. ii. Generate TAM for i/p traffic
iii. Calculate MD between normal profile and i/p traffic
iv. If MD < threshold Detect Normal Else
Detect attack.
In the training phase, we employ only the normal records. Normal profiles are built with respect to the various types of appropriate traffic using the algorithm describe below. Clearly, normal profiles and threshold points have the direct power on the performance of the threshold based detector. An underlying quality usual shape origin a mistaken characterization to correct traffic of network.
Threshold Selection
The threshold is used to differentiate attack traffic from the legitimate one. Threshold = µ + σ ∗ α. (16) For a normal distribution, α is usually ranged from 1 to 3. This means that detection decision can be made with a certain level of confidence varying from 68% to 99.7% in association with the selection of different values of α.
Thus, if the MD between an observed traffic record xobserved and the respective normal profile is greater than the threshold, it will be considered as an attack.
Intruder Detection
To detect Intruders, the lower triangle
(TAMobservedlower ) of the TAM of an observed record needs to be generated using the proposed triangle-area-based MCA approach. Then, the MD between the TAMobserved lower and the TAMnormal lower stored in the respective pre-generated normal profile Pro is computed.
Pseudo code for Intruder Detection:
This Pseudo code is used for classification purpose. Step 1: Task is to classify new packets as they arrive, i.e., decide to which class label they belong, based on the currently existing traffic record.
Step 2: Formulated our prior probability, so ready to classify a new Packet.
Step 3: Then we calculate the number of points in the packet belonging to each traffic record.
Step 4: Final classification is produced by combining both sources of information, i.e., the prior and to form a posterior probability.
Algorithm for Intruder Detection
The detailed detection algorithm is shown below: Require: Observed traffic record xobserved, normal profile
Pro: (N(µ, σ2), TAMnormal lower , Cov) and parameter α
1: Generate TAMobserved lower for the observed traffic record xobserved
2: MDobserved ← MD(TAMobserved
lower ,TAMnormal lower )
3: if (µ σ ∗ α) ≤ MDobserved ≤ (µ + σ ∗ α) then 4: return Normal
5: else
6: return Attack 7: end if
Mathematical Modeling
Let S be the system which we use to find the Intruder detection system. They
• Input: Given an arbitrary dataset X= { x1, x2, ... ,xn } • Output: DP (Detected Packets) : DP={n,m}
Where, n is normal packets and m is the malicious packets.
• Process: S= {D, mvc, NP, AD, DP}
Where, S= System, D= Dataset, mvc= Multivariate correlation analysis, NP = Normal profile generation, ID =Intruder Detection, DP= Detected packets.
IV.
RESULTS AND DISCUSSION
Performance Analysis:
Detection Rate: The detection rate is defined as the number of intrusion instances detected by the
system (True Positive) divided by the total number of intrusion instances present in the test set.
False Alarm Rate: Defined as the number of ’normal’ patterns classified as attacks (False Positive) divided by the total number of ’normal’ patterns.
Precision: Precision is the basic measure used in evaluating search strategies. Precision means how many selected items are relevant. Precision is calculated by using following formula:
Precision = Number of Relevant Retrieved / Number of Retrieved
Recall: Recall is the ratio of the number of relevant records retrieved to the total number of relevant records in the database. It is usually expressed as a percentage. Recall means how many relevant items are selected. Recall is calculated by using following formula:
Recall = Number of Relevant Retrieved / Total number of Relevant
F-measure: F-measure is a Frequency measure of a tests accuracy. It considers both the precision
and recall of the test to compute the score. F-measure is calculated from precision and recall by using following formula:
F-measure = (2 ∗ Precision ∗ Recall) / (Precision + Recall)
ALERT TYPE:
True Positive: Attack - Alert
False Positive: No attack - Alert
False Negative: Attack - No Alert
True Negative: No attack - No Alert Terms:
True Positive: A legitimate attack which triggers IDS to produce an alarm.
False Positive: An event signalling IDS to produce an alarm when no attack has taken place
False Negative: When no alarm is raised when an attack has taken place.
True Negative: An event when no attack has taken place and no detection is made.
Evaluation of Results:
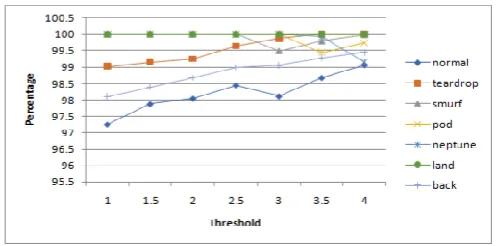
Evaluation of Intruder Detection is done by using NSL KDD dataset. Normal Profile is built by using NSL KDD Training dataset. Test profile is generated by using NSL KDD Test dataset. The Euclidian Distance is calculated for both Normal and Test Profiles. Threshold range is generated by using µ + σ * α and µ - σ * α. For normal Distribution, the value of α ranges from 1 to 3. Detection rate and False positive rate is evaluated for the different values of α. The Detection rate of intruder by using NSL dataset for normalized data is shown in following table,
For NSL Dataset Values of a normalized data for NSL dataset is tabular below and according to that the graph is given
Table 1. Normalized data for NSL dataset
Figure 1. Graph for normalized data table
Table 2. original data for NSL dataset
Figure 2. Graph for original data table
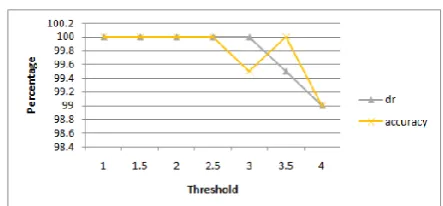
For Real time Dataset
The Detection rate of intruder by using real time dataset for 200 records is shown in following table.
Table 3. values of attack for real time dataset
Table 4. FPR
Figure 3. Graph for False Positive Rate
Figure 4. Graph for Detection Rate and Accuracy
V.
CONCLUSION
To detect intrusion, it is necessary to check what type it is of. So here the process of intrusion detection is given according to the types. This paper proposes the techniques that helps to detect the U2R, probing and DOS type of intrusions. This can further be extended to Reduce the processing time when large amount of dataset is provided. Also, the research would be interesting on real time sensitive datasets that have highest changes if getting intruder.
VI.
REFERENCES
[1]. Anna L. Buczak, Member, IEEE, and Erhan Guven, "A Survey of Data Mining and Machine Learning Methods for Cyber Security Intrusion Detection,"ieee communications surveys and tutorials, vol. 18, no. 2, second quarter 2016. [2]. M. Bhuyan, D. Bhattacharyya, and J. Kalita,
Network anomaly detection: Methods, systems and tools, IEEE Commun. Surv. Tuts., vol. 16, no. 1, pp. 303336, First Quart. 2014.
[3]. T. T. T. Nguyen and G. Armitage, A survey of techniques for internet traffic classification using machine learning, IEEE Commun. Surv. Tuts., vol. 10, no. 4, pp. 5676, Fourth Quart. 2008. [4]. P. Garcia-Teodoro, J. Diaz-Verdejo, G.
Maci-Fernndez, and E. Vzquez, Anomalybased network intrusion detection: Techniques, systems and challenges, Comput. Secur., vol. 28, no. 1, pp. 1828, 2009.
[6]. S. X. Wu and W. Banzhaf, The use of computational intelligence in intrusion detection systems: A review, Appl. Soft Comput., vol. 10, no. 1, pp. 135, 2010.
[7]. Xia Wang, Intrusion Detection Techniques inWireless Ad Hoc Networks, Proceedings of the 30th Annual International Computer Software and Applications Conference (COMPSAC’06) 0-7695-2655-1/06 2006 IEEE
[8]. Yan Wen, Jinjing Zhao, Huaimin Wang,A Novel Intrusion-Tolerant Approach for Internet Access,
978-0-7695-3151-9/08 2008 IEEE DOI
10.1109/ISIP.2008.28
[9]. Manjiri V. Kotpalliwar, Rakhi Wajgi,
Classification of Attacks Using Support Vector Machine (SVM) on KDDCUP99 IDS Database,
978-1-4799-1797-6/15 2015 IEEE DOI
10.1109/CSNT.2015.185
[10].Zhi-tang Li, Jie Lei, Li Wang, and Dong Li,A Data Mining Approach to Generating Network Attack Graph for Intrusion Prediction, Fourth International Conference on Fuzzy Systems and Knowledge Discovery (FSKD 2007) 0-7695-2874-0/07 2007 IEEE
[11].Surat Srinoy, Student Member, IEEE ,Intrusion Detection Model Based On Particle Swarm Optimization and Support Vector Machine, 1-4244-0700-1/07/ 2007 IEEE
[12].Mostafa Doroudian, Narges Arastouie,
Mohammad Talebi, Ali Reza Ghanbarian, Multilayered Database Intrusion Detection System for Detecting Malicious Behaviors in Big Data Transaction, ISBN: 978-1-4673-6988-6 2015 IEEE
[13].A. Markov, Extension of the limit theorems of probability theory to a sum of variables connected in a chain, Dynamic Probabilistic Systems, vol. 1, R. Howard. Hoboken, NJ, USA: Wiley, 1971 (Reprinted in Appendix B).
[14].L. E. Baum and J. A. Eagon, An inequality with applications to statistical estimation for probabilistic functions of Markov processes and to a model for ecology, Bull. Amer. Math. Soc., vol. 73, no. 3, p. 360, 1967.
[15].A. Arnes, F. Valeur, G. Vigna, and R. A. Kemmerer, Using Hidden markov models to evaluate the risks of intrusions: System
architecture and model validation, Lect. Notes Comput. Sci., pp. 145164, 2006.
[16].D. Ariu, R. Tronci, and G. Giacinto, HMMPayl: An intrusion detection system based on hiddenMarkov models, Comput. Secur., vol. 30, no. 4, pp. 221241, 2011.
[17].S. S. Joshi and V. V. Phoha, Investigating hidden Markov models capabilities in anomaly detection, in Proc. ACM 43rd Annu. Southeast Reg. Conf., 2005, vol. 1, pp. 98103.
[18].J. Zhang, M. Zulkernine, and A. Haque, Random-forests-based network intrusion detection systems, IEEE Trans. Syst. Man Cybern. C: Appl. Rev., vol. 38, no. 5, pp. 649659, Sep. 2008. [19].F. Gharibian and A. Ghorbani, Comparative study
of supervised machine learning techniques for intrusion detection, in Proc. 5th Annu. Conf. Commun. Netw. Serv. Res., 2007, pp. 350358. [20].J. H. Friedman, Multivariate adaptive regression
splines, Anal. Statist., vol. 19, pp. 1141, 1991. [21].S. Mukkamala, A. Sunga, and A. Abraham,
Intrusion detection using an ensemble of intelligent paradigms, J. Netw. Comput. Appl., vol. 28, no. 2, pp. 167182, 2004.
[22].L. Bilge, D. Balzarotti, W. Robertson, E. Kirda, and C. Kruegel, Disclosure: Detecting botnet command and control servers through large-scale netflow analysis, in Proc. 28th Annu. Comput. Secur. Appl. Conf. (ACSAC12), Orlando, FL, USA, Dec. 37, 2012, pp. 129138.
[23].R. Agrawal, T. Imielinski, and A. Swami, Mining Association Rules between Sets of Items in Large Databases, Proc. ACM SIGMOD, vol. 22, no. 2, pp. 207-216, 1993.
[24].Y. Bouzida and S. Gombault, Eigen connections to Intrusion Detection, Security and Protection in Information Processing Systems, pp. 241-258, 2004.
[25].Raja Azrina Raja Othman, "Understanding the Various Types of Denial of Service Attack" [26].Slvia Farraposo, Laurent Gallon, Philippe