R E V I E W
Open Access
Methodologies on estimating the energy
requirements for maintenance and
determining the net energy contents of
feed ingredients in swine: a review of
recent work
Zhongchao Li
†, Hu Liu
†, Yakui Li
†, Zhiqian Lv, Ling Liu, Changhua Lai, Junjun Wang, Fenglai Wang, Defa Li
and Shuai Zhang
*Abstract
In the past two decades, a considerable amount of research has focused on the determination of the digestible (DE) and metabolizable energy (ME) contents of feed ingredients fed to swine. Compared with the DE and ME systems, the net energy (NE) system is assumed to be the most accurate estimate of the energy actually available to the animal. However, published data pertaining to the measured NE content of ingredients fed to growing pigs are limited. Therefore, the Feed Data Group at the Ministry of Agricultural Feed Industry Centre (MAFIC) located at China Agricultural University has evaluated the NE content of many ingredients using indirect calorimetry. The present review summarizes the NE research works conducted at MAFIC and compares these results with those from other research groups on methodological aspect. These research projects mainly focus on estimating the energy requirements for maintenance and its impact on the determination, prediction, and validation of the NE content of several ingredients fed to swine. The estimation of maintenance energy is affected by methodology, growth stage, and previous feeding level. The fasting heat production method and the curvilinear regression method were used in MAFIC to estimate the NE requirement for maintenance. The NE contents of different feedstuffs were determined using indirect calorimetry through standard experimental procedure in MAFIC. Previously generated NE equations can also be used to predict NE in situations where calorimeters are not available. Although popular, the caloric efficiency is not a generally accepted method to validate the energy content of individual feedstuffs. In the future, more accurate and dynamic NE prediction equations aiming at specific ingredients should be established, and more practical validation approaches need to be developed.
Keywords:Heat production, Ingredients, Maintenance, Net energy, Prediction equations, Validation
Background
Most pigs are fed diets based on cereal (corn, wheat, barley, etc.) and protein sources (soybean meal, etc.). However, less-expensive, alternative feed ingredients either rich in dietary fiber or protein, such as corn by-products and oil-seed meals, have been increasingly in-cluded in swine diets in order to decrease feed costs [1].
In addition, using the net energy (NE) system may help to reduce feed cost because it takes the heat increment (HI) into consideration. Therefore, it is a more precise evaluation of the true energy value of the feed compared to the metabolizable energy (ME). In most situations, the NE content of ingredients is predicted from equa-tions. The most widely used prediction equations were developed more than 20 years ago and include NE pre-diction equations for growing pigs [2], fattening pigs [3], maintenance-fed adult sows [4], and growing boars [5]. These studies covered wide range of ingredients and * Correspondence:[email protected]
†Equal contributors
State Key Laboratory of Animal Nutrition, Ministry of Agriculture Feed Industry Centre, China Agricultural University, Beijing 100193, China
demonstrated that NE contents of ingredients or diets can be estimated based on their chemical compositions or di-gestible nutrients. Nevertheless, some highly processed in-gredients (or by-products) that have become more available nowadays (corn germ meal, cottonseed meal, rice bran, etc) were not included. Therefore, these prediction equations may not be suitable for these new feedstuffs.
Nine open-circuit respiration chambers were estab-lished at Ministry of Agriculture Feed Industry Centre (MAFIC) according to the design of van Milgen et al. [6]. Since 2012, many research projects have been con-ducted in MAFIC to determine the maintenance energy requirements for pigs and the NE content of individual ingredients. All data were determined using the same methods and procedures [1,7–14]. The objective of this review is to summarize the NE-related work conducted at MAFIC and compare these results with those from other research groups on methodological aspect, which included estimating the energy requirements for main-tenance as well as the determination, prediction, and validation of the NE content of various ingredients.
Some concepts about energy
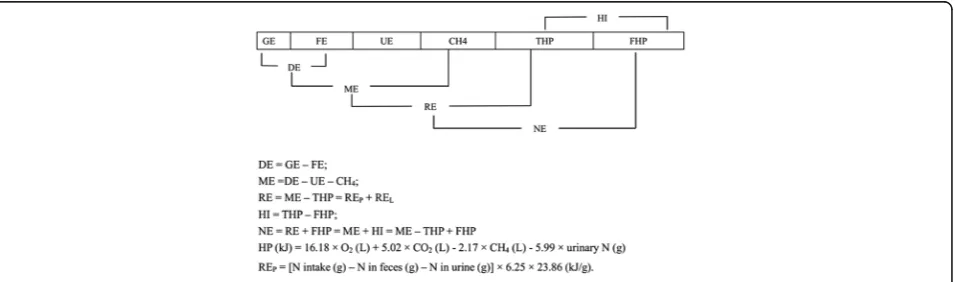
When measuring NE by the indirect calorimetry method, heat production (HP) can be calculated from gas exchanges (open-circuit respiration chambers) and the urinary nitrogen according to Brouwer [15]. The utilization of the energy in a feed by pigs is a multi-level system (Fig. 1). The ME can be partitioned into two parts: NE and HI. HI is the heat produced during the process of nutrient ingestion, digestion, and metabolism, and is thought to be useless [16]. However, it is difficult to separate the HI from total heat production (THP), and HI is typically calculated as THP minus NE require-ments for maintenance (NEm). The NEmalso cannot be
determined directly, and fasting heat production (FHP), which is measured in the fasted animal, is frequently used to estimate the NEm [2, 5, 17]. As a result, HI is
calculated as THP minus FHP. In growing animals, NE is usually estimated as the sum of NEm and retained
en-ergy (RE), and RE is usually evaluated as ME intake minus THP. In growing pigs, RE corresponds to the sum of RE as protein (REP) and RE as lipid (REL). The REPis
typically calculated using nitrogen retention (g) = N × 6. 25 × 23.86 (kJ/g) [18] and RELis calculated as the
differ-ence between RE and REP(Fig.1).
Information on intake and output for pigs
Modern pig production contributes to many environ-mental problems that relate to excretion from pigs, espe-cially in areas with highly intensive production systems. Therefore, measurement of intake and output data is very useful for the global design of manure management systems for swine [19].
In our NE trials, the inputs including feed intake, gross energy (GE) intake and O2 consumption as well as the
outputs including feces, urine, CO2, CH4, and HP have
been summarized according to diet characteristics (Table1). Although pigs were fed in crates and feed intake was lower than ad libitum, these data may still be useful as a reference for the actual production situation. Almost half of the GE consumed is used for HP and only one third of the GE is retained. Approximately 14% of the GE is excreted in the feces, 3% of the GE is excreted in the urine and 0.7% of the GE is excreted as methane.
Estimation of the energy requirements for maintenance
Estimation of the energy requirement for maintenance is very important when conducting research on energy me-tabolism, which will influence the absolute NE value of a feedstuff [8, 20]. The energy requirements for mainten-ance can be expressed as ME (MEm) or NE (NEm). The
choice of methodologies and measuring conditions are very important for estimating these energy values.
The NEm cannot be determined directly but there are
mainly 2 methods which have been used to estimate NEm.
Firstly, the FHP can be measured directly in fasted animals and it is then used as an estimate of NEm[2,5,17]. This
method is affected by the length of fasting, previous feed-ing level, and differences in activity between fastfeed-ing and fed status [7,8,21]. Additionally, FHP is affected by both the ATP requirement at the cellular level and heat pro-duced from the generation of ATP from body nutrient stores [22]. The second approach for estimating NEm
which has been widely used in the past is the regression method, in which THP is calculated through extrapolating HP measured at different ME intake levels to zero ME intake (HP0). The commonly used regression models
include linear model and curvilinear model. For linear re-gression [5, 16], the hypothesis is that the HP increased linearly with the ME intake. However, this method has great limitations. Firstly, the ME intake levels selected for
Fig. 3Exponential relationship between heat production and metabolizable energy (ME) intake for all pigs. HP = 749 × e(0.0002 × ME intake),
R2= 0.91,
P< 0.001. Data are from growing (●), and finishing (△) pigs (Zhang et al. [8]). HP: heat production
HP extrapolating typically range from 60% to 100% of ad libitum intake, thus there is a lack of information on the relationship between HP and ME intake below the energy requirements for maintenance [8,20]. In this method, the efficiencies of energy utilization for maintenance (km) and
growth (kg) are assumed to be constant. However, recent
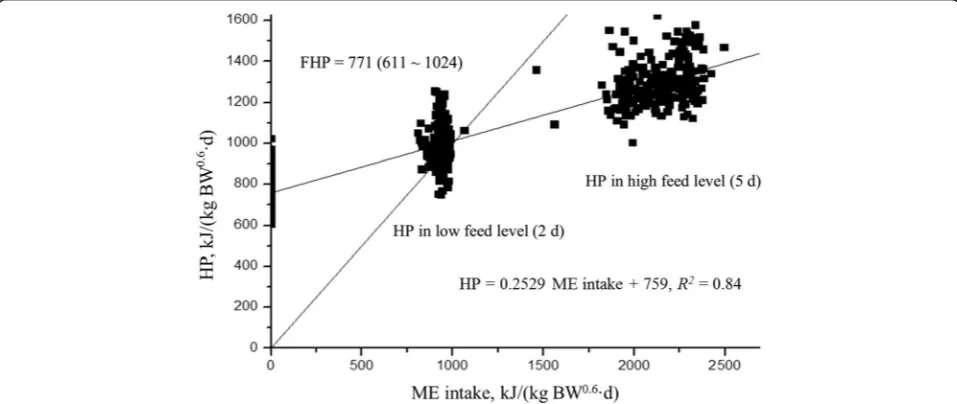
research reported that this traditional assumption may be incorrect [8,9,20,23]. Secondly, the FHP value measured throught direct method is variable and is affected by the previous feeding level [8,9,23,24]. These authors also re-ported that the HP0was lower than the actual measured
FHP value (Fig. 2). The curvilinear regression model to estimate the NEmwas proposed at MAFIC [8], which uses
exponential regression between HP and a wide range of ME intakes both above and below energy requirements for maintenance (Fig.3). In this method, the Y-intercept was thought to be the NEmand takes into account the
dif-ference between kg and km as well as the effect of
previous feeding level on FHP. However, both the lin-ear and curvilinlin-ear models provide only one estimate
of NEm, while pigs fed at different feeding levels have
different NEm.
The MEm was estimated by assuming that the HP is
equal to ME intake at maintenance. Therefore, based on the NEm estimation, the MEm was conventionally
calculated by solving the regression quations (linear regression model, HP = a + b ME intake; exponential regression model, HP = a eb×ME intake). A novel method to estimate MEm was proposed by Labussière et al.
[23], in which the estimated MEm ranged from the
MEm calculated at the lowest feeding level to MEm
calculated at the highest feeding level (Fig.2). MEm is
affected by feeding levels and estimated MEm
decreases in growing pigs when ME intake is reduced [23]. Several hypotheses have been suggested to explain the results, including the effect of the gastrointestinal tract size [6, 25], or the changed muscle protein turnover rate [26].
In our NE trials, where FHP was considered as the HP measured for 8 h after 31 h fasting from the last meal,
Table 2Comparison of extrapolated total heat production at zero energy intake (HP0) and FHP.
a
All works listed were conducted in MAFIC
No. Authors Experiments (diets) HP0 FHP Range of FHP
1 Liu et al. (2015) [10] Complete diets 768 781 605–901
2 Li et al. (2015) [1] Corn DDGS diets 783 795 611–971
3 Li et al. (2017) [13] Rapeseed meal 768 789 692–1,024
4 Li et al. (2018) [14] Five ingredients 717 770 615–973
5 Li et al. (unpublished) Corn 737 716 648–869
6 Li et al. (2017) [12] Rapeseed meal 798 775 651–866
Summary 759 771 611–1,024
a
Includes 6 experiments with 34 diets and 26 ingredients, 204 replications, 408 heat production and 204 fasting heat production
the HP0(759 kJ ME/ (kg BW0.6·d)) linearly regressed on
HP and ME intake was in the range of the FHP (611 to 1,024 kJ ME/ (kg BW0.6·d), a few of extreme outliers existed, and most FHP values ranged around 700 to 800, Table 2 and Fig. 4). The following regression equation was established based on all data in our NE trials: HP = 0.2529 ME intake + 759 (R2= 0.84). Consequently, the MEm= 1,016 kJ ME/ (kg BW0.6·d).
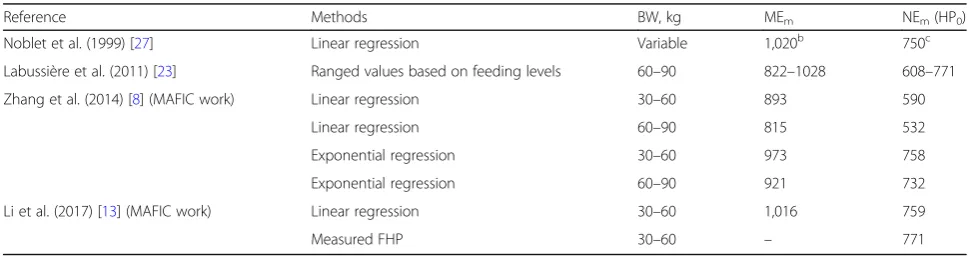
The estimated energy requirements for maintenance among different research projects are shown in Table3. These values depend on the methods used, growth stage, conditions of measurement (e.g. procedure, activity), feeding levels and the composition of the diet; they should then be interpreted with caution and are not dir-ectly comparable. Accounting for the effect of feeding level on FHP, the measurement of FHP immediately after a fed period is highly preferable [20]. The MEm
(1,016 kJ ME/ (kg BW0.6·d), summarized in MAFIC) was very close to the value (1,020 kJ ME/ (kg BW0.6·d)) obtained from different breeds and variable BW [27].
In conclusion, estimating the energy requirements for maintenance is a complex project. Future research should focus more on biochemical mechanisms and use new technologies to find more meaningful criteria which are representative of the maintenance condition for pigs.
Net energy content of ingredients
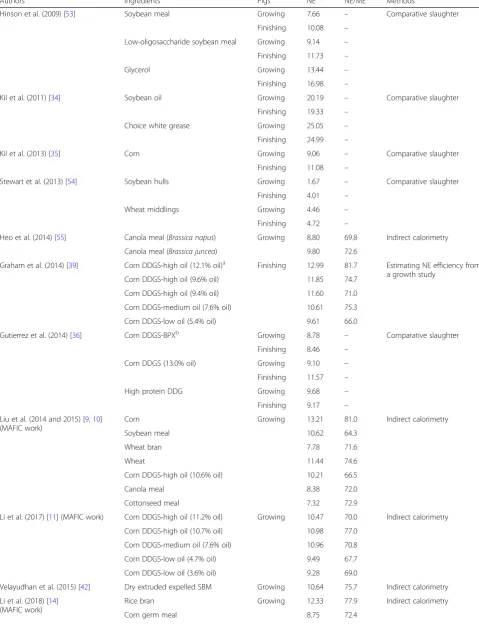
Previous studies have shown that the DE and ME sys-tems systematically underestimate the energy concentra-tion of feeds high in starch or fat and overestimate the energy concentration of feeds high in protein or crude fibre [5, 28]. Therefore, the NE system should be the most appropriate system by now to estimate the true energy value of feed ingredient, which is theoretically independent of the feed characteristics [28–31]. Large amounts of data pertaining to the determination of NE value of ingredients were published during the past dec-ade (Table 4). Indirect calorimetry and comparative slaughter are the two main methods used to determine
the NE content of ingredients. The indirect calorimetry consists of measuring oxygen consumption, and carbon dioxide and methane production [20]. These measurements combined with the urinary energy production are then used to calculate HP based on equations from Brouwer [15]. The comparative slaughter technique, on the other hand, directly measures energy gain based on chemical analysis of samples collected after slaughter, and HP is calculated as the difference between ME intake and energy gain [20]. Due to differences in experimental procedures, the chem-ical composition of ingredients, animals, and errors in ana-lysis, it is difficult to compare these two methods for a given ingredient, and determine which method should be used to estimate the true energy available to an animal. Ayoade et al. [32] reported that the NE in wheat and corn DDGS diets obtained with indirect calorimetry and com-parative slaughter method did not differ. However, many other results indicated that the NE values measured by in-direct calorimetry were greater than values calculated with the comparative slaughter method [33–36], which may be attributed to the fact that in studies using comparative slaughter technique, pigs were housed in a more practical facility and then can move freely with more heat produc-tion related to physical activity. Moreover, pigs in studies using comparative slaughter technique may sometimes be raised below their critical temperature with again an in-creased heat production. Therefore, heat production mea-sured using comparative slaughter method may be highly increased in connection with increased maintenance en-ergy and FHP values, while the FHP value used in indirect calorimetry procedure is obtained under minimal activity and at thermo-neutrality, which leads to the greater NE value [37,38].
Although questionable, Graham et al. [39] developed a new method to calculate the NE value of ingredients which estimates NE based on regression analysis deter-mined by estimating NE efficiency (NEE) from growth studies. In this method, the NE of a corn-soybean meal control diet was calculated based on literature data and
Table 3Comparison of the estimation of energy requirements for maintenance among different experimentsa
Reference Methods BW, kg MEm NEm(HP0)
Noblet et al. (1999) [27] Linear regression Variable 1,020b 750c
Labussière et al. (2011) [23] Ranged values based on feeding levels 60–90 822–1028 608–771
Zhang et al. (2014) [8] (MAFIC work) Linear regression 30–60 893 590
Linear regression 60–90 815 532
Exponential regression 30–60 973 758
Exponential regression 60–90 921 732
Li et al. (2017) [13] (MAFIC work) Linear regression 30–60 1,016 759
Measured FHP 30–60 – 771
a
Energy unit: kJ / (kg BW0.6 ·d) b
The average value for different breeds, variable BW c
Table 4Summary of research on the net energy content of ingredients conducted in the past decade (MJ/kg DM)
Authors Ingredients Pigs NE NE/ME Methods
Hinson et al. (2009) [53] Soybean meal Growing 7.66 – Comparative slaughter
Finishing 10.08 –
Low-oligosaccharide soybean meal Growing 9.14 –
Finishing 11.73 –
Glycerol Growing 13.44 –
Finishing 16.98 –
Kil et al. (2011) [34] Soybean oil Growing 20.19 – Comparative slaughter
Finishing 19.33 –
Choice white grease Growing 25.05 –
Finishing 24.99 –
Kil et al. (2013) [35] Corn Growing 9.06 – Comparative slaughter
Finishing 11.08 –
Stewart et al. (2013) [54] Soybean hulls Growing 1.67 – Comparative slaughter
Finishing 4.01 –
Wheat middlings Growing 4.46 –
Finishing 4.72 –
Heo et al. (2014) [55] Canola meal (Brassica napus) Growing 8.80 69.8 Indirect calorimetry
Canola meal (Brassica juncea) 9.80 72.6
Graham et al. (2014) [39] Corn DDGS-high oil (12.1% oil)a Finishing 12.99 81.7 Estimating NE efficiency from a growth study
Corn DDGS-high oil (9.6% oil) 11.85 74.7
Corn DDGS-high oil (9.4% oil) 11.60 71.0
Corn DDGS-medium oil (7.6% oil) 10.61 75.3
Corn DDGS-low oil (5.4% oil) 9.61 66.0
Gutierrez et al. (2014) [36] Corn DDGS-BPXb Growing 8.78 – Comparative slaughter
Finishing 8.46 –
Corn DDGS (13.0% oil) Growing 9.10 –
Finishing 11.57 –
High protein DDG Growing 9.68 –
Finishing 9.17 –
Liu et al. (2014 and 2015) [9,10] (MAFIC work)
Corn Growing 13.21 81.0 Indirect calorimetry
Soybean meal 10.62 64.3
Wheat bran 7.78 71.6
Wheat 11.44 74.6
Corn DDGS-high oil (10.6% oil) 10.21 66.5
Canola meal 8.38 72.0
Cottonseed meal 7.32 72.9
Li et al. (2017) [11] (MAFIC work) Corn DDGS-high oil (11.2% oil) Growing 10.47 70.0 Indirect calorimetry
Corn DDGS-high oil (10.7% oil) 10.98 77.0
Corn DDGS-medium oil (7.6% oil) 10.96 70.8
Corn DDGS-low oil (4.7% oil) 9.49 67.7
Corn DDGS-low oil (3.6% oil) 9.28 69.0
Velayudhan et al. (2015) [42] Dry extruded expelled SBM Growing 10.64 75.7 Indirect calorimetry
Li et al. (2018) [14] (MAFIC work)
Rice bran Growing 12.33 77.9 Indirect calorimetry
then the NEE (NE intake: ADG) was calculated accord-ing to actual pig growth. The NE of the test diet was cal-culated based on the hypothesis that the NEE of pigs fed a test diet was equal to that of pigs fed the control diet. The NE of the test ingredient was calculated according to the percentage of the test ingredient in the test diet.
From a practical point of view, and to avoid bias in the calculation of NE for different feedstuffs, it is necessary to use similar animals and maintain these animals under similar and standardized conditions [20]. In our labora-tory, the NE trials (data shown in Tables2,5, and6) were conducted in the same location (Fengning, Hebei, China) and using standardized conditions, including similar animals from same breed (Duroc × Large White × Land-race, BW ranged from 30 to 60 kg), similar chambers, a constant temperature and humidity and using the same experimental procedures. In these experiments, pigs were individually housed in metabolic crates for 16 d, which included 7 d to adapt to the feed and environmental conditions. On d 8, pigs were transferred to the open-circuit respiration chambers for measurement of O2
con-sumption as well as CO2and CH4production. During this
time, pigs were fed their diet at 2,400 kJ ME/ (kg BW0.6·d). Feces and urine were collected from d 9 to d 13, and HP was measured. From d 14 to d 15, pigs were fed at the maintenance requirement (MEm= 893 kJ ME/ (kg BW0. 6
·d)) obtained from the results of Zhang et al. [8] in order to adapt the pigs from the fed to the fasting state. On the
Table 4Summary of research on the net energy content of ingredients conducted in the past decade (MJ/kg DM)(Continued)
Authors Ingredients Pigs NE NE/ME Methods
Corn gluten feed 7.51 78.5
Peanut meal 10.75 75.3
Sunflower meal 6.49 67.2
Li et al. (2017) [13] (MAFIC work)
Rapeseed meal-expeller press Growing 10.14 72.2 Indirect calorimetry
Rapeseed meal-expeller press 11.46 80.1
Rapeseed meal-solvent extracted 7.98 65.3
Rapeseed meal-solvent extracted 9.47 75.1
Rapeseed meal-solvent extracted 7.91 72.7
Li et al. (2017) [12] (MAFIC work) Corn Growing 12.46 78.3 Indirect calorimetry
Soybean meal 11.34 70.2
Rapeseed meal-expeller press 11.71 74.7
Rapeseed meal-solvent extracted 8.83 76.5
a
Oil content as-fed basis; b
Corn DDGS-BPX, uncooked corn distillers dried grains with solubles
Table 5Levels of ingredients in the dietsa
Ingredients No. of
diets
Inclusion level,%
Max Mean
Corn 33 97.03 66.12
Soybean meal 26 25.00 17.58
Wheat bran 5 33.00 15.40
Wheat 4 58.37 20.59
Corn DDGS 9 29.25 17.53
Rapeseed meal 11 20.00 14.68
Cottonseed meal 4 10.00 5.75
Full-fat rice bran 1 29.25 29.25
Corn germ meal 1 29.25 29.25
Corn gluten feed 1 24.38 24.38
Peanut meal 1 19.50 19.50
Sunflower meal 1 29.25 29.25
Dicalcium phosphate 33 1.20 0.89
Limestone 34 1.46 0.83
Salt 34 0.40 0.36
Vitamin and mineral premix 34 0.50 0.50
Lysine HCl 10 0.71 0.40
DL-methionine 8 0.14 0.09
L-threonine 10 0.17 0.08
L-tryptophan 5 0.04 0.03
a
Includes 6 experiments, 34 diets and 26 ingredients
Table 6Chemical composition of dietsa(as-fed basis)
Chemical composition Minimum Maximum Mean
Dry matter 85.96 90.11 87.94
Crude protein 6.87 23.79 16.59
Neutral detergent fiber 8.52 24.33 14.33
Acid detergent fiber 1.56 9.59 4.52
Ether extract 2.18 5.52 3.05
Starch 31.57 63.10 43.07
Ash 2.97 5.91 4.43
Gross energy 15.48 16.90 16.12
a
last day of each period, pigs were fasted and FHP was estimated as the averaged HP of 8 h after 31 h fasting. Even not quantifying physical activity, the FHP in our trials was measured under minimum expected activity (during the night, in the dark, and adjustment of the cage, etc.) and after a long period of fasting. The FHP values measured in different studies using the same procedure conducted in MAFIC close to each other (Table 2) [1, 8–12], and also close to those obtained by the INRA group according to a specific methodology or those used in the large scale NE measurements [5].
Based on the above methodologies, a series of studies were conducted in MAFIC to evaluate the NE values of 26 ingredient samples, including 2 corn samples, 2 soybean meal samples, 1 wheat sample, 1 wheat bran sample, 8 rapeseed meal samples, 1 cottonseed meal sample, 6 corn DDGS samples, 1 rice bran sample, 1 corn germ meal sample, 1 corn gluten feed sample, 1 peanut meal sample and 1 sunflower meal sample. The estimated NE values were summarized in Table 4, and our NE values were comparable with those in feeding tables by Sauvant et al. [40] or NRC [41].
Net energy prediction equations
The NE prediction equations have been proposed for growing pigs (Just, 1982) and growing boars [5] with the latter have being widely used during the past two decades [32,42–44].
The NE in wheat-corn DDGS diets [28] or corn-DDGS [1] measured by indirect calorimetry is similar to values obtained with prediction equations of Noblet et al. [5]. However, Kil [45] reported that NE values for di-ets and ingredients predicted from the equations of Noblet et al. [5] fed to growing pigs were greater than the values measured by comparative slaughter. It should be mentioned that the measured NE values were obtained with a FHP value (536 kJ/(kg BW0.6·d)) markedly lower than the value (750 kJ/(kg BW0.6·d)) used in the prediction equations of Noblet et al. [5]. There are differences in methodology used to estimate the energy requirements for maintenance. Therefore, caution should be essential when comparing the measured values with predicted values. It is also difficult to compare NE values obtained by different methods using statistical procedures. A possible reason is the relatively large standard error of the mean for the NE of ingredients compared with diets when the NE values of ingredients are calculated according to the difference procedure. The inherent problems associated with using the difference procedure were also found by Kil et al. [34]. In the present review, the NE value of 26 ingredients and 34 diets measured at MAFIC were compared with values predicted by the equations of Noblet et al. [5] and Just [2]. From the present review, the equations of Noblet et al. [5] can be used to predict the NE value of most ingredients (Fig. 5), except for those ingredients containing high fiber content, such as sunflower meal or cottonseed meal. The NE of 34 diets can be accurately predicted by the equations of Noblet et al. [5] (Fig. 5). The equation proposed by Just [2] underestimate the NE value of the 26 ingredients and 34 diets (Fig. 6). Generally, the prediction equations proposed by Noblet et al. [5] can be used to predict NE in situations where calorimeters are not available. However, more accurate NE prediction equations should be established with those equations aimed at specific ingredients such as oil-seed meals and fibrous ingredients. Future research at MAFIC will focus on such projects.
Validation
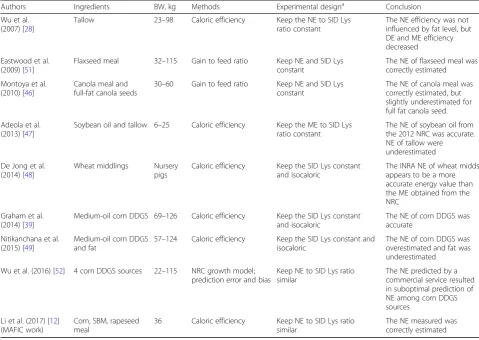
As mentioned above, the NE value of feedstuffs can be directly determined by either comparative slaughter or indirect calorimetry technique, or can be predicted from equations. However, only a few studies have been con-ducted to validate these estimated NE values [46]. The recent published literatures on NE value validation have been summarized in Table 7. Among these studies,
caloric efficiency is the most popular parameter used to determine whether the NE value of the ingredient was accurately estimated [12, 28, 39, 47–49]. The caloric efficiency was calculated as the daily energy intake (ADFI×dietary energy, MJ/kg) divided by ADG [39,48,49]. The validation approach using caloric efficiency is estab-lished based on the fact that pigs tend to consume their feed according to their energy requirements, and thus if the other nutrients such as amino acids are maintained constant, similar growth performance of pigs are expected [49,50]. Therefore, the test ingredient was included in ex-perimental diets in gradient levels in these validation trials, and similar caloric efficiency among the dietary treatments were expected if the assigned energy value is accurate. The NE values of tallow, soybean oil, wheat mid-dlings, medium-oil corn DDGS, and rapeseed meal have been validated through this method [12, 28, 39, 47, 48]. Moreover, some studies used gain to feed ratio instead of caloric efficiency as a parameter to validate the estimated
energy value. The underlying theories and experimental procedures of such experiments are the same as those using caloric efficiency. The NE value of flaxseed meal and canola meal have been validated through this method [46,51].
In the validation trials mentioned above, a key step in experimental design is to set up the constant values, usually the standardized ileal digestible lysine (SID Lys), among the dietary treatments when formulating treatment diets. In this situation, the net energy contents of the treatment diets tend to be slightly different due to the different inclusion levels of the test ingre-dients [39, 48, 49]. Some researchers then adjusted the energy-supplying parts of the diets to keep the NE value constant among the dietary treatments at the same time [46,51]. Therefore, the gain to feed ratio was equal with the caloric efficiency in these experiments. In many other studies, the NE to SID Lys ratio was kept con-stant among the dietary treatments when formulating treatment diets [12, 28, 47]. There is still no evidence showing which experimental design is more accurate in validation. The caloric efficiency can combine with other techniques, e.g. meta-analysis, to validate the NE content of ingredients as well as the prediction
equations for growth performance established based on meta-analysis [49].
However, the actual NE value of the ingredients, espe-cially the high-fiber ingredients, rely on the inclusion level of the ingredients in diets [2]. It was emphasized that the NE value of ingredients can be greatly affected at a high inclusion level in diets [48]. Furthermore, it is more com-mon that no significant difference were observed acom-mong dietary treatments using the caloric efficiency approach, especially when the number of replications is insufficient. Under such conditions, it is difficult to conclude that the assigned energy value is accurate, because we can only infer that the value is not wrong from statistical point of view. As a result, there are some drawbacks to use the cal-oric efficiency method to validate the energy content of in-gredients. In a more recent study, the target NE values of corn DDGS were compared with the estimated NE contents of DDGS based on the NRC growth model. Pre-diction error and bias between these two datasets were calculated and used to validate the target NE values [52]. This approach avoids to use caloric efficiency in energy content validation, but the choice of an appropriate model is vital to get convincing results.
Table 7Summary of validation research published in the past decade
Authors Ingredients BW, kg Methods Experimental designa Conclusion
Wu et al. (2007) [28]
Tallow 23–98 Caloric efficiency Keep the NE to SID Lys ratio constant
The NE efficiency was not influenced by fat level, but DE and ME efficiency decreased
Eastwood et al. (2009) [51]
Flaxseed meal 32–115 Gain to feed ratio Keep NE and SID Lys constant
The NE of flaxseed meal was correctly estimated
Montoya et al. (2010) [46]
Canola meal and full-fat canola seeds
30–60 Gain to feed ratio Keep NE and SID Lys constant
The NE of canola meal was correctly estimated, but slightly underestimated for full fat canola seed.
Adeola et al. (2013) [47]
Soybean oil and tallow 6–25 Caloric efficiency Keep the ME to SID Lys ratio constant
The NE of soybean oil from the 2012 NRC was accurate. NE of tallow were underestimated
De Jong et al. (2014) [48]
Wheat middlings Nursery pigs
Caloric efficiency Keep the SID Lys constant and isocaloric
The INRA NE of wheat midds appears to be a more accurate energy value than the ME obtained from the NRC
Graham et al. (2014) [39]
Medium-oil corn DDGS 69–126 Caloric efficiency Keep the SID Lys constant and isocaloric
The NE of corn DDGS was accurate
Nitikanchana et al. (2015) [49]
Medium-oil corn DDGS and fat
57–124 Caloric efficiency Keep the SID Lys constant and isocaloric
The NE of corn DDGS was overestimated and fat was underestimated
Wu et al. (2016) [52] 4 corn DDGS sources 22–115 NRC growth model; prediction error and bias
Keep NE to SID Lys ratio similar
The NE predicted by a commercial service resulted in suboptimal prediction of NE among corn DDGS sources
Li et al. (2017) [12] (MAFIC work)
Corn, SBM, rapeseed meal
36 Caloric efficiency Keep NE to SID Lys ratio similar
The NE measured was correctly estimated a
Conclusions and perspectives for future
The NE system provides a good foundation to increase the utilization of alternative feedstuffs in swine diets. However, research on NE is time-consuming, expensive, and complex and depends heavily on methodology. This review summa-rizes the NE research in swine conducted at MAFIC from methodological aspect. The net energy requirements for maintenance were estimated in MAFIC using both the fast-ing heat production method and the nonlinear regression method. The NE value of feedstuffs were determined using indirect calorimetry through standard experimental proced-ure in MAFIC, and the prediction equation from INRA (NE = (0.7 × DE) + [(1.61 × EE) + (0.48 × Starch) - (0.91 × CP) - (0.87 × ADF)]/1000 × 4.184) can be used to predict NE in situations where calorimeters are not available. Al-though with drawbacks, caloric efficiency is still the most popular parameter to validate the estimated NE content. In the future, new criteria established on biochemical mecha-nisms can be used to describe the maintenance condition for pigs. NE prediction equations based on individual ingre-dients should be established to improve the accuracy of prediction. More generally accepted approach is needed to further validate the estimated NE values of feedstuffs.
Abbreviations
ADFI:Average daily feed intake; ADG: Average daily gain; BW: Body weight; DE: Digestible energy; DM: Dry matter; FHP: Fasting heat production; GE: Gross energy; HI: Heat increment; HP: Heat production; kg: Efficiencies of energy utilization for growth; km: Efficiencies of energy utilization for maintenance; ME: Metabolizable energy; MEm: Metabolizable energy requirements for maintenance; N: Nitrogen; NE: Net energy; NEE: Net energy efficiency; NEm: Net energy requirements for maintenance; RE: Retention energy; REL: Retention energy as lipid; REP: Retention energy as protein; THP: Total heat production
Acknowledgements
We thank Dr. Jean Noblet and Dr. Philips A. Thacker for excellent assistance in editing the manuscript. We also thank our colleagues of the Ministry of Agricultural Feed Industry Centre for collaboration on net energy research.
Funding
This project was financially supported by the Modern Agricultural Industry Technology System (CARS-36), Developing key equipment for digital management and monitoring environment in animal production
(2013AA10230602), National Natural Science Foundation of China (31372317), the 111 Project (B16044) and China Postdoctoral Science Foundation. The funders had no role in study design, data collection and analysis, decision to publish, or preparation of the manuscript.
Availability of data and materials
All the data were presented in the main manuscript and available to readers.
Authors’contributions
ZL summarized all of the net energy experiments conducted at MAFIC and wrote the manuscript. HL and YL participated in the experiments. CL, FW, DL and SZ critically evaluated the manuscript. All authors read and approved the final manuscript.
Ethics approval and consent to participate
All procedures used in this study were performed according to the guidelines for the ethical treatment of animal by the Institutional Animal Care and Use Committee of China Agricultural University (Beijing, China).
Competing interests
The authors declare that they have no competing interests.
Received: 19 October 2017 Accepted: 13 April 2018
References
1. Li P, Li DF, Zhang HY, Li ZC, Zhao PF, Zeng ZK, et al. Determination and prediction of energy values in corn distillers dried grains with solubles sources with varying oil content for growing pigs. J Anim Sci. 2015;93:3458–70.
2. Just A. The net energy value of crude (catabolized) protein for growth in pigs. Livest Prod Sci. 1982;9:349–60.
3. Schiemann R, Nehring K, Hoffmann L, Jentsch W, Chudy A. Energetische Futterbevertung und Energienormen. Berlin: VEB Deutscher Landwirtschatsverlag; 1972.
4. Noblet J, Shi X, Dubois S. Metabolic utilization of dietary energy and nutrients for maintenance energy requirements in sows: basis for a net energy system. Br J Nutr. 1993;70:407–19.
5. Noblet J, Fortune H, Shi XS, Dubois S. Prediction of net energy value of feeds for growing pigs. J Anim Sci. 1994;72:344–54.
6. van Milgen J, Bernier JF, Lecozler Y, Dubois S, Noblet J. Major determinants of fasting heat production and energetic cost of activity in growing pigs of different body weight and breed/castration combination. Br J Nutr. 1998;79:509–17.
7. Hu Q, Wang FL, Piao XS, Ni JJ, Zhang XM, Li DF. Effects of fasting duration and body weight on fasting heat production in growing pigs. J Anim Vet Adv. 2012;11:2333–41.
8. Zhang GF, Liu DW, Wang FL, Li DF. Estimation of the net energy requirements for maintenance in growing and finishing pigs. J Anim Sci. 2014;92:2987–95.
9. Liu DW, Jaworski NW, Zhang GF, Li ZC, Li DF, Wang FL. Effect of experimental methodology on fasting heat production and the net energy content of corn and soybean meal fed to growing pigs. Arch Anim Nutr. 2014;68:281–95.
10. Liu DW, Liu L, Li DF, Wang FL. Determination and prediction of the net energy content of seven feed ingredients fed to growing pigs based on chemical composition. Anim Prod Sci. 2015;55:1152–63.
11. Li ZC, Li P, Liu DW, Li DF, Wang FL, Su YB, et al. Determination of the energy value of corn distillers dried grains with solubles containing different oil levels when fed to growing pigs. J Anim Physiol Anim Nutr.
2017;101:339–48.
12. Li ZC, Li YK, Lv ZQ, Liu H, Zhao JB, Noblet J, et al. Net energy of corn, soybean meal and rapeseed meal in growing pigs. J Anim Sci Biotechnol. 2017;8:44. 13. Li ZC. Net energy prediction of plant protein ingredients to growing pigs.
PhD thesis. Beijing: China Agricultural University; 2017.
14. Li Y, Li Z, Liu H, Noblet J, Liu L, Li D, et al. Net energy content of rice bran, corn germ meal, corn gluten feed, peanut meal, and sunflower meal in growing pigs. Asian-Australas J Anim Sci. 2018.https://doi.org/10.5713/ajas. 17.0829. [Epub ahead of print].
15. Brouwer E. Report of sub-committee on constants and factors. Proceedings of the 3rd EAAP symposium on energy metabolism; Troonn, Publ. 11. London: Academic Press; 1965. p. 441–3.
16. Ewan RC. Energy utilization in swine nutrition. In: Lewis AJ, Southern LL, editors. Swine nutrition. 2nd ed. New York: CRC Press; 2001. p. 903–16. 17. Kil DY, Kim BG, Stein HH. Feed energy evaluation for growing pigs.
Asian-Australas J Anim Sci. 2013;26:1205–17.
18. Chwalibog A, Jakobsen K, Tauson A-H, Thorbek G. Energy metabolism and nutrient oxidation in young pigs and rats during feeding, starvation and re-feeding. Comp Biochem Physiol A Mol Integr Physiol. 2005;140:299–307. 19. Jørgensen H, Prapaspongsa T, Poulsen HD. Models to quantify excretion of dry matter, nitrogen, phosphorus and carbon in growing pigs fed regional diets. J Anim Sci Biotechnol. 2013;4:42.
20. Noblet J, van Milgen J. Energy and energy metabolism in swine. In: Chiba LI, editor. Sustainable swine nutrition. Ames, IA: Wiley-Blackwell; 2013. p. 33–5. 21. Labussière E, Dubois S, van Milgen J, Noblet J. Partitioning of heat
production in growing pigs as a tool to improve the determination of efficiency of energy utilization. Front Physiol. 2013;4:146.
23. Labussiere E, van Milgen J, de Lange CF, Noblet J. Maintenance energy requirements of growing pigs and calves are influenced by feeding level. J Nutr. 2011;141:1855–61.
24. de Lange K, van Milgen J, Noblet J, Dubois S, Birkett S. Previous feeding level influences plateau heat production following a 24 h fast in growing pigs. Br J Nutr. 2006;95:1082–7.
25. Koong LJ, Nienaber JA, Pekas JC, Yen JT. Effects of plane of nutrition on organ size and fasting heat production in pigs. J Nutr. 1982;112:1638–42. 26. Gerrits W, Schrama JW, Tamminga S, Verstegen M. Effect of protein and
protein-free energy intake on myofibrillar protein degradation in preruminant calves of 120 and 200 kilograms of live weight. J Anim Sci. 1998;76:1364–70.
27. Noblet J, Karege C, Dubois S, van Milgen J. Metabolic utilization of energy and maintenance requirements in growing pigs: effects of sex and genotype. J Anim Sci. 1999;77:1208–16.
28. Wu Z, Li DF, Ma YX, Yu Y, Noblet J. Evaluation of energy systems in determining the energy cost of gain of growing-finishing pigs fed diets containing different levels of dietary fat. Arch Anim Nutr. 2007;61:1–9. 29. Noblet J. Digestive and metabolic utilization of energy in swine: application
to energy evaluation systems. J Appl Anim Res. 2000;17:113–32. 30. Noblet J, Henry Y. Energy evaluation systems for pig diets: a review. Livest
Prod Sci. 1993;36:121–41.
31. Noblet J, Van Milgen J. Energy value of pig feeds: effect of pig body weight and energy evaluation system. J Anim Sci. 2004;82:E229–38.
32. Ayoade DI, Kiarie E, Neto MAT, Nyachoti CM. Net energy of diets containing wheat-corn distillers dried grains with solubles as determined by indirect calorimetry, comparative slaughter, and chemical composition methods. J Anim Sci. 2012;90:4373–9.
33. Quiniou N, Dubois S, Noblet J. Effect of dietary crude protein level on protein and energy balances in growing pigs: comparison of two measurement methods. Livest Prod Sci. 1995;41:51–61.
34. Kil DY, Ji F, Stewart LL, Hinson RB, Beaulieu AD, Allee GL, et al. Net energy of soybean oil and choice white grease in diets fed to growing and finishing pigs. J Anim Sci. 2011;89:448–59.
35. Kil DY, Ji F, Stewart LL, Hinson RB, Beaulieu AD, Allee GL, et al. Effects of dietary soybean oil on pig growth performance, retention of protein, lipids, and energy, and on the net energy of corn in diets fed to growing or finishing pigs. J Anim Sci. 2013;91:3283–90.
36. Gutierrez NA, Kil DY, Liu Y, Pettigrew JE, Stein HH. Effects of co-products from the corn-ethanol industry on body composition, retention of protein, lipids and energy, and on the net energy of diets fed to growing or finishing pigs. J Sci Food Agric. 2014;94:3008–16.
37. Bray HJ, Giles LR, Gooden JM, Black JL. Energy expenditure in growing pigs infected with pleuropneumonia. In: KJ MC, Unsworth EF, ARG W, editors. Energy metabolism of farm animals. Northern Ireland: Newcastle: Proc. 14th Symp. Energy Metab; 1997. p. 291–4.
38. Verstegen MWA. Developments towards net energy systems in feeds and animals. In: Proc. Saskatoon, SK: Western Nutr. Conf; 2001. p. 170–84. 39. Graham AB, Goodband RD, Tokach MD, Dritz SS, DeRouchey JM,
Nitikanchana S, et al. The effects of low-, medium-, and high-oil distillers dried grains with solubles on growth performance, nutrient digestibility, and fat quality in finishing pigs. J Anim Sci. 2014;92:3610–23.
40. Sauvant D, Perez JM, Tran G. Tables of composition and nutritional value of feed materials: pigs, poultry, cattle, sheep, goats, rabbits, horses and fish. Wageningen Academic Pub; 2004.
41. NRC. Nutrient requirements of swine. 11th. Ed. Washington: National Academy Press; 2012.
42. Velayudhan DE, Heo JM, Nyachoti CM. Net energy content of dry extruded-expelled soybean meal fed with or without enzyme supplementation to growing pigs as determined by indirect calorimetry. J Anim Sci. 2015;93:3402–9.
43. Rojas OJ, Stein HH. Concentration of digestible, metabolizable, and net energy and digestibility of energy and nutrients in fermented soybean meal, conventional soybean meal, and fish meal fed to weanling pigs. J Anim Sci. 2013;91:4397–405.
44. Sotak-Peper KM, Gonzalez-Vega JC, Stein HH. Concentrations of digestible, metabolizable, and net energy in soybean meal produced in different areas of the United States and fed to pigs. J Anim Sci. 2015;93:5694–701. 45. Kil DY. Digestibility and energetic utilization of lipids by pigs. PhD thesis.
Urbana, IL: University of Illinois; 2008.
46. Montoya CA, Leterme P. Validation of the net energy content of canola meal and full-fat canola seeds in growing pigs. Can J Anim Sci. 2010;90:213–9.
47. Adeola O, Mahan DC, Azain MJ, Baidoo SK, Cromwell GL, Hill GM, et al. Dietary lipid sources and levels for weanling pigs. J Anim Sci. 2013;91:4216–25. 48. De Jong J, DeRouchey J, Tokach M, Dritz S, Goodband R. Effects of dietary
wheat middlings, corn dried distillers grains with solubles, and net energy formulation on nursery pig performance. J Anim Sci. 2014;92:3471–81. 49. Nitikanchana S, Dritz SS, Tokach MD, DeRouchey JM, Goodband RD, White BJ.
Regression analysis to predict growth performance from dietary net energy in growing-finishing pigs. J Anim Sci. 2015;93:2826–39.
50. Quiniou N, Noblet J. Effect of the dietary net energy concentration on feed intake and performance of growing-finishing pigs housed individually. J Anim Sci. 2012;90:4362–72.
51. Eastwood L, Kish PR, Beaulieu AD, Leterme P. Nutritional value of flaxseed meal for swine and its effects on the fatty acid profile of the carcass. J Anim Sci. 2009;87:3607–19.
52. Wu F, Johnston LJ, Urriola PE, Hilbrands AM, Shurson GC. Evaluation of NE predictions and the impact of feeding maize distillers dried grains with solubles (DDGS) with variable NE content on growth performance and carcass characteristics of growing-finishing pigs. Anim Feed Sci Technol. 2016;215:105–16.
53. Hinson RB, Kil DY, Beaulieu AD, Stewart LL, Fi J, Pettigrew JE, et al. Net energy content content of commercial and low-oligosaccharide soybean meal. J Anim Sci. 2009;87(E-Suppl. 3):99.
54. Stewart LL, Kil DY, Ji F, Hinson RB, Beaulieu AD, Allee GL, et al. Effects of dietary soybean hulls and wheat middlings on body composition, nutrient and energy retention, and the net energy of diets and ingredients fed to growing and finishing pigs. J Anim Sci. 2013;91:2756–65.