Visualizing sound: counting wolves by using a
spectral view of the chorus howling
Passilongo
et al.
Passilongoet al. Frontiers in Zoology (2015) 12:22
M E T H O D O L O G Y
Open Access
Visualizing sound: counting wolves by
using a spectral view of the chorus howling
Daniela Passilongo
1*, Luca Mattioli
2, Elena Bassi
1, László Szabó
3and Marco Apollonio
1Abstract
Introduction:Monitoring large carnivores is a central issue in conservation biology. The wolf (Canis lupus) is the most studied large carnivore in the world. After a massive decline and several local extinctions, mostly due to direct persecutions, wolves are now recolonizing many areas of their historical natural range. One of the main monitoring techniques is the howling survey, which is based on the wolves’ tendency to use vocalisations to mark territory ownership in response to howls of unknown individuals. In most cases wolf howling sessions are useful for the localisation of the pack, but they provide only an aural estimation of the chorus size.
We tested and present a new bioacoustic approach to estimate chorus size by recording wolves’replies and visualising choruses through spectrograms and spectral envelopes. To test the methodology, we compared: a) the values detected by visual inspections with the true chorus size to test for accuracy; b) the bioacoustic estimations of a sample of free-ranging wolves’replies developed by different operators to test for precision of the method; c) the aural field estimation of chorus size of a sample of free-ranging wolves’replies with the sonogram analysis of the same recordings to test for difference between methods.
Results:Visual inspection of the chorus by spectrogram and spectrum proved to be useful in determining the number of concurrent voices in a wolf chorus. Estimations of chorus size were highly correlated with the number of wolves counted in a pack, and 92 % of 29 known chorus sizes were recognized by means of bioacoustic analysis. On the basis of spectrographic evidence, it was also possible to identify up to seven concurrent vocalisations in a chorus of nine wolves. Spectral analysis of 37 free ranging wolves’replies showed a high correlation between the chorus size estimations of the different operators (92.8 %), but a low correlation with the aural estimation (59.2 %). Conclusions:Wolf howling monitoring technique could be improved by recording wolves’replies and by using bioacoustic tools such as spectrograms and spectral envelopes to determine the size of the wolf chorus. Compared with other monitoring techniques (i.e., genetic analysis), bioacoustic analysis requires widely available informatic tools (i.e., sound recording set of devices and sound analysis software) and a low budget. Information obtained by means of chorus analysis can also be combined with that provided by other techniques.
Moreover, howls can be recorded and stored in audio file format with a good resolution (i.e. in“Wave”format), thus representing a useful tool for future listening and investigations, which can be countlessly employed without risks of time deterioration.
* Correspondence:dpassilongo@uniss.it 1
Department of Science for Nature and Environmental Resources, University of Sassari, via Muroni 25, I-07100 Sassari, Italy
Full list of author information is available at the end of the article
Introduction
Monitoring and managing the recovery of large wide-ranging mammalian carnivores are major issues for both conservation biologists and wildlife managers [1]. In the light of the continuous habitat loss and direct persecu-tion of these species, large carnivores conservapersecu-tion has become a pressing need [2]. Often described as “ charis-matic species” [3], these carnivores actually have a high ecological [2, 4], economic and social impact [3, 5–7] and, therefore, an in-depth knowledge of their ecology and behaviour is highly desirable for the development of an effective conservation strategy.
At the beginning of the 1990s, after a massive decline caused by centuries of direct persecution, deforestation and overhunting of its natural prey [8, 9], the wolf (Canis lupus), became almost extinct in Western Eur-ope, United States and Mexico [4]. At the present, thanks to legal protection and socio-economic changes in Europe, as the improvement in habitat quality and the presence of large populations of wild ungulates [10]; the relocation effort [11] and areas with vast public lands [12] in US, wolves have reoccupied 67 % of their histor-ical range worldwide [4]; in this context, monitoring wolf population is a crucial issue for wolf conservation efforts.
One of the main wolf monitoring tools is the howling survey [13]: given the tendency of resident wolves to re-spond to extraneous vocal stimuli in order to defend the resources in their territories and to avoid encounter with neighbour packs, this approach consists in the acoustic stimulation produced through human simulation or playback of actual wolf howls [14–16]. This method was employed in several studies for monitoring and census-ing wolf packs [15, 17–19] and other species with similar vocal behaviour [20, 21]. However, in most cases, suc-cessful field wolf howling sessions end with the pack lo-calisation and an aural estimation of chorus size, and only few attempts to determine chorus size through complex sound and statistical analysis have been made [22–26]. In this regard, several studies have already found both individual [26–28] and group vocal signature [29] by using spectrographic analysis, thus emphasising the high potential of bioacoustic tools to improve the knowledge on this species. Nevertheless, no study has yet used available bioacoustic softwares and visual spec-trographic inspection of the howling to estimate chorus size.
In most cases chorus size is estimated aurally, by counting each individual as it joins the chorus [15, 30]. However, precise estimation of the number of wolves is difficult with this method because only the first two or three wolves enter in the chorus as a staggered basis followed by the rest of the pack en masse [15]. More-over, the packs often reply before the end of the
stimulus, and, in particular, packs with more adults tend to reply more quickly [15, 22, 30]. Additionally, since subordinate adults’ and pups’ howls consist in a rapid frequency modulation, they add complexity to the chorus and even experts may encounter difficulties in counting them (see [15]). Counting ability in humans has been tested also in the case of human voices [31] and music instruments [32]. In both cases, human aural perception generally failed to count more than three concurrent sources, however, during the test on the de-numerability of music instruments, musicians performed about 20 % better than non-musicians [32], thus highlighting the variability level associated to individual background and expertise. Consistent with these find-ings, studies on the aural denumerability of chorus size also recognised about 3 wolves [15, 22].
For this reason, researchers conservatively set a fixed pack size to their data collected through howling survey (see [33, 34]), and, if possible, determine the pack size and the aggregation rate of the packs of their target pop-ulations using other, often more expensive and time-consuming techniques (genetic: [34, 35], tracks: [33], VHF/GPS collars: [36, 37]; camera traps: [38]). Since during the reply some individuals of the pack could stay silent [16] or be temporarily absent [37], chorus size does not necessarily correspond to the actual pack size; even so, chorus size can be used as a proxy of the mini-mum pack size. As for wolves, the pack is the basic so-cial unit [39] and pack size is correlated with several ecological traits such as hunting efficiency and prey se-lection [40, 41], pack size estimation is a key-issue for wolf monitoring, research, and conservation purposes.
In this paper, we present a bioacoustic approach based on the visual inspection of the sound to estimate chorus size of the pack. We validated the method by evaluating both its accuracy (comparison of the chorus size esti-mated through the method with the real chorus size) and its precision (comparison of the chorus size esti-mated through the method by two operators) The effi-ciency of the method was then proved by comparing the chorus size estimated through visual inspections with the estimation of the chorus size based on an aural estimation.
Therefore, the aim of this study was to test the bene-fits of using bioacoustic analysis to estimate wolf chorus size by recording and analysing wolves’choruses during the wolf howling monitoring sessions, thus highlighting a further connection between behavioural and conserva-tion issues.
Results and discussion
Accuracy of the method
Visual estimation by spectrogram and spectrum pro-vided an accurate evaluation of the chorus size as a
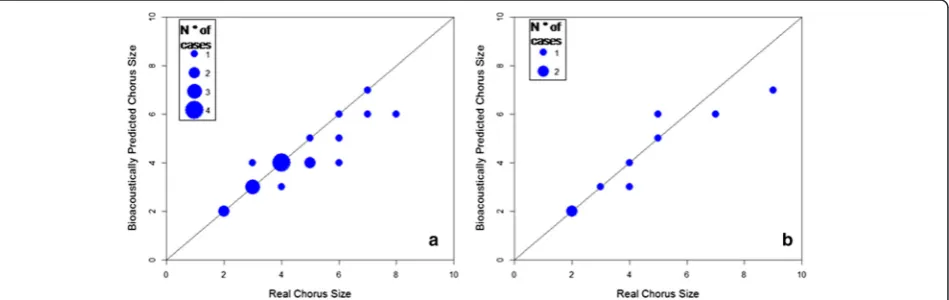
strong positive correlation was found between real and estimated values in both our tests of known chorus size (Human simulated howling, HSH: n= 20, Spearman’s rho = 0.90, p< 0.0001; and Wolf downloaded howling, WDH: n= 9, Spearman’s rho = 0.97, p< 0.0001), (Fig. 1) with no difference between real and estimated means (Wilcoxon signed rank test, HSH: n= 20, Z= 2.12, p= 0.057; WDH: n= 9,Z= 1.13, p= 0.501). The most com-mon error was the underestimation (false negative) for one individual (five and two cases in HSH and WDH), followed by the underestimation of two individuals (two and one cases) (Fig. 1). Overestimation (false positive) occurred twice, with four concurrent voices estimated in a chorus size of three (in HSH) and six concurrent calls estimated in a chorus of five individuals (in WDH) (Fig. 1). Choruses composed by two individuals were al-ways correctly estimated and it was even possible to rec-ognise up to six different voices in a chorus of eight contemporaneous voices (in HSH test) and up to seven different voices in a chorus of nine elements (in WDH test). In the two cases of overestimation, the detection of the “phantom voice” was probably due to the misinter-pretation of a mix of non-linear (deterministic chaos, subharmonics) [42, 43] and environmental phenomena (reverberation, echoes) [44]. In fact, while harmonic overtones were easily recognised because of their shape (the same as F0) and frequencies (integer multiple of F0) (Fig. 2) and, therefore, hardly misinterpreted as a differ-ent fundamdiffer-ental frequency (one more individual), other phenomena could affect and limit chorus visualisation. However, repeated measures in different parts of the chorus could effectively limit overestimation errors.
Considering the overall sample (test HSH and WDH), 92 % of the total number of voices were recognised by the visual analysis of the choruses, thus highlighting the potential and wide applicability of this methodology.
In the last few years, like all the inherent computer science technologies, analysis tools such as spectrograms and spectral envelopes based on the digital Fourier transform [45] have become accessible to a broad range of researchers [46]. This was possible thanks to the spread of several highly interactive software (e.g., Raven, made available by Cornell University [47], and widely accessed open source software environments and pro-gramming languages such as R [48], with its Seewave package specifically dedicated to time series (i.e. sounds) visualisation and analysis [49] (see Fig. 3 and Additional file 1 and Additional file 2 for an example of spectro-graphic and spectral visualisation of a wolves chorus).
Precision of the method
Results from the visual estimation performed by another independent operator after the training on the method-ology, also showed high correlation values for both test (Human simulated howling, HSH: n= 20, Spearman’s rho = 0.92, p< 0.0001; and Wolf downloaded howling, WDH: n= 9, Spearman’s rho = 0.80, p= 0.009); and no statistical difference between real and estimated means (Wilcoxon signed rank test, HSH: n= 20, Z= 1.73, p= 0.147; WDH: n= 9, Z= 0.74, p= 0.495) confirming the accuracy and showing the precision of the bioacoustic method.
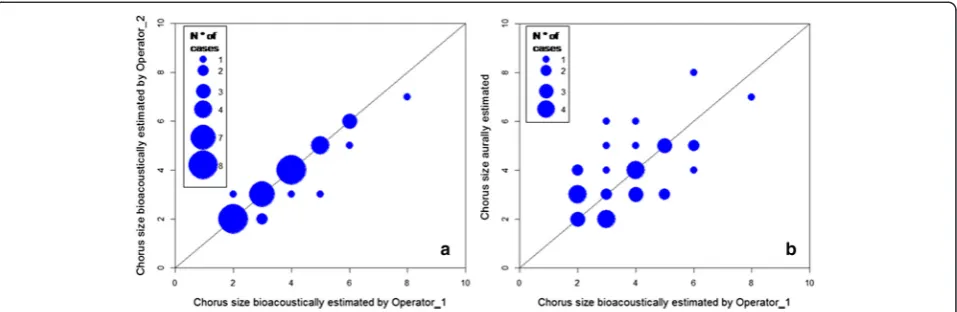
Similarly, analysis of free ranging wolves’replies showed a high correlation between bioacoustic estimations of chorus sizes by independent operators (Spearman’s rho = 0.93, p< 0.0001) with no difference between operators’ means (Wilcoxon, n= 37, Z=−1.898, p= 0.112). Chorus size estimation by visual inspection was the same for both operators in 30 replies out of 37 (88 %), and operator 2 agreed with operator 1 in 131 out of 138 total voices clas-sification. Maximum difference between operators was of two individuals in only one case and one individual in six
cases (Fig. 4a), thus showing a high precision of spectro-gram analysis.
Efficiency of the method
Comparison of aural estimations of the 37 free ranging wolves’replies with the bioacoustic estimations (Fig. 4b) showed low correlation in both cases (vs. Operator 1: Spearman’s rho = 0.59, p= 0.0001; and vs. Operator 2:
rho = 0.63, p< 0.0001), which thus proved the two methods do not provide the exact same results.
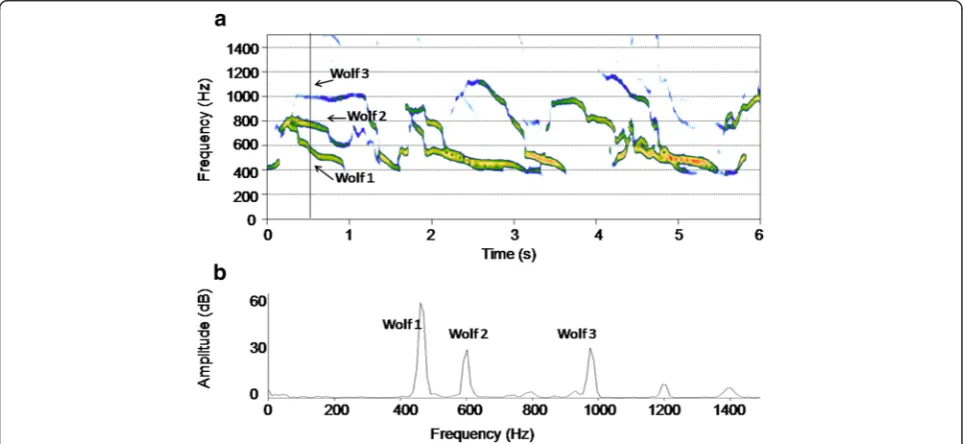
Aural and bioacoustic estimations showed similar overall mean pack size, i.e. comparable accuracy, but very low concordance that is different precision. Mean chorus size obtained from bioacoustic and aural method did not differ statistically (Wilcoxon, n= 37, Operator 1 vs. Aural:Z= 0.446; p= 0.689; Operator 2 vs. Aural:Z= Fig. 2Spectral components of a wolf chorus. Narrow band spectrogram (DFT size: 2048 samples; Hanning window; frequency grid: 21.5 Hz; time step: 10 ms; bandwidth: 37.5 Hz) showing 3.5 s of a wolf chorus emitted by a free ranging pack and recorded during the howling survey. Spectrogram (a) and its spectral envelope (b) at the second 1.7 are presented. Three different howls recognizable because of the different shape of F0 and harmonic structure, are present at the same time. Other amplitude picks are due to background noise and echoes. Legend: W = wolf ; F0 = fundamental frequency; F1 = first harmonic; F2 = second harmonic
Fig. 3Three wolves’choral howls. Chorus howls of at least three different wolves (free-ranging) recorded during the howling survey in 2007. Spectrogram (a) and spectrum (b) (window length: 4026 samples) were computed by Seewave, anopen sourceR project package dedicated to the sound analysis. Colours (from red to blue) represent amplitude degradation. See also Additional file 1 and Additional file 2 for analysis of wolves choruses with Seewave
1.362; p= 0.186) as a consequence of bi-directional dif-ferences between aural and bioacoustic estimations. Aural and visual pack size estimations were identical in only 12 cases (32 %); a difference of one individual was found in 16 cases, a difference of two individuals was found in eight cases. Finally, three more individuals were estimated aurally with respect to the bioacoustic estima-tion in one case (Fig. 4b).
For polyphonic sounds, visualisation is a source separ-ation method [46] and, below certain sizes, good spec-trographic exams of wolf choruses can realistically reveal a number of different contemporaneous sources. How-ever, as the number of contemporaneous sources in-creases (7–9 sources, depending on the quality of the recordings and the chorus modulation), the overlap be-tween howls generates a high-density spectrogram (and spectral envelope), in which the different components of the sound can hardly be discriminated.
Here we showed a high correlation between bioacous-tic estimation performed by visual inspection of the chorus and real chorus size and between the estimations of different operators, thus highlighting the precision of the technique. Sound editing can also improve listening quality: indeed, most of the factors affecting aural field estimation (high background noise) can be totally (chick-adees) or partially (in case of overlap with the target fre-quencies - e.g., airplanes’engines) removed (filtered out) during the sound analysis phase.
Conversely, we showed.discrepancies between aural and bioacoustic chorus size estimations. Previous works [15, 22] also showed that aural field estimation of wolf packs commonly failed to count more than three wolves correctly, consistent with human general failure to rec-ognise more than three concurrent sources in a poly-phonic contest, both in the case of human voice [31] and music instruments [32].
Although chorus size does not necessarily correspond to pack size [16, 37] and further studies are needed in order to better determine the age class of the members and the overall active space of the choruses, we believe that this method represents a very useful tool and a rela-tive low-budget technique for the estimation of mini-mum wolf pack size.
Conclusions
In this paper, we presented a bioacoustic approach based on visual spectrographic inspections of wolves’ howling to handily estimate the chorus size of the pack. We demonstrated that the process of recording and analys-ing wolves’ replies collected during the howling survey has several advantages. Once recorded, a sound is avail-able for a potentially infinite number of listening ses-sions. Moreover, in order to improve the quality of the sound and, consequently, of the chorus size estimation, these recordings can also be edited (i.e., filtered, ampli-fied) and saved in modified versions. For this reason, we suggest to save the original files for possible future stud-ies. Also, prerequisite for a good spectrographic analysis and thus for a good estimation of the chorus size is the recording quality: an ultra-directional microphone, un-compressed“wave”or“aif”format and an adequate sam-pling frequency ( 22,000 or 44,000 Hz) are essential characteristics for recording the howls correctly.
Recordings of wolves’ replies and bioacoustic analysis can help determine chorus size, thus allowing to count different wolves in a chorus in a more precise and less sensitive way than with the more subjective, extempor-aneous field estimation by ear.
managers in the use of the technique described. A bio-acoustic approach to the howling survey can help wild-life and conservation biologists monitor wolves as well as other canid species with similar acoustic territorial marking behaviour, such as the coyote (Canis latrans), and the golden jackal (Canis aureus), offering a realistic, objective (because based on the spectral components of the choruses) estimation of any pack size of up to six-eight members and thus, the possibility to track this trend.
Since this source of information can be combined with other sources (e.g., genetic samples [50], snow tracks [34], remote photo-videos [51]) in a cross-modal moni-toring, we believe that chorus size estimations by means of bioacoustic analysis can help biologists monitor wild populations of vocal animals, through non-invasive methods and properly inform administrators on the con-servation strategies required, on the basis of a realistic estimate of the status and trends of these predators.
Materials and methods
Tests procedure
We evaluated the reliability of the chorus size estimation by visual inspection of spectrogram and spectrum. First, we measured the accuracy of the estimated chorus size. During a howling survey there is generally no visual access to the replying pack. We thus analysed bioacoustically choruses of known size, either simulated by humans (i.e.
“Human simulated howling” test, HSH; n= 20), or of real wolves (i.e. “Wolf downloaded howling” tests, WDH; n= 9). Second, we estimated the precision of the technique by comparing bioacoustically estimated values of 37 free-ranging wolves’choral replies from two inde-pendent operators. A training on bioacoustic analysis fol-lowing the procedure highlighted in this paper was performed by operators before the tests.
Finally, we tested whether aural estimations and esti-mations from visual inspection of spectrogram and spectrum provided comparable results. Using the same 37 wolves’replies we compared aural chorus size estima-tions obtained in the field during the howling survey (not necessarily by the same field operators) with the bioacoustics estimations of the same choruses.
Data acquisition
Human-simulated howls (HSH) were recorded in sum-mer 2012 and 2013, by groups of 2 to 8 volunteers who were asked to howl together after training on howling simulation. Breaking and flat howls were alternated, with at least 5 howls per trial, and one individual entering in the chorus as a staggered basis, following Harrington and Mech [14]. Human howls were recorded in Fonte del Baregno (43°62’ N, 11°93’ E), within the protected area called Alpe di Catenaia in the Apennine Mountains,
in the North-East of Tuscany, Italy. Distance between source and recorder was 100 m.
Choruses from the internet (Wolf Downloaded Howls, WDH) were downloaded from YouTube as video file (.flv) format with VSO downloader 2.9.12 [52] after a re-search with keywords such as “wolf”,“howls” or similar terms. We selected and downloaded 9 videos in which it was effectively possible to count the howling wolves and all the howling wolves were well visible. So as to be sure that the chorus size corresponded to the pack size, 8 out of the 9 choruses used in the WDH were recorded in captivity (especially in the zoo). The videos were then converted from the original video format (MP4, “.mov” or“.flv”types) into audio format (2 channels, Wave for-mat, 44,100 KHz and 16 bit format) with the software 4Free Video Converter [53] . All the links to the original files are in Additional file 3.
Free-ranging wolves’replies were collected from 2008 to 2014 during a wolf howling monitoring program (fol-lowing the Habitat Directive on priority species [92/43/ EEC]) carried out in the Province of Arezzo (3230 km2), Eastern Tuscany, Italy.
Wolf howling survey was performed in summer (from July to October), when the pack activity was focused in the home-sites, because of the pups presence and the rate of response was consequently higher [14, 15, 54]. Sam-pling sites were chosen so as to cover the whole study area, following the method described by Harrington and Mech [15] as“saturation census”and adapting it to local requirements/topography to maximise the range of audi-bility and minimise sound dispersion [54]. Following the standard procedure suggested by Harrington and Mech [15]: i) no session was conducted during rainfalls nor with strong wind; ii) wolf howling was performed overnight, to minimise the anthropogenic noise; iii) two trials were con-ducted per site.
Wolves respond to the howling of unfamiliar individ-uals in six different basic ways, from retreating silently to remaining and replying with/by vocal approach [14] in relation to their resources (e.g. fresh prey), and social context (e.g. presence of pups) and to the stimulus [16]; moreover, they respond to human simulated howling as well as to playbacks [13, 14]. For these reasons, our stimuli always consisted in a chorus howls emitted by two individuals (howling playback by a captive pair of wolves (duration: 1.20 min) or by human simulated howling (duration: circa 1 min)). Playback of recorded chorus howls was emitted by an exponential horn with high emission directionality (120° horizontal coverage and 60° vertical).
Three minutes after the first stimulus, if no answer had followed, a second trial (higher in volume to cover a bigger area) was attempted, after which the operators left the site. In case of response, reply bearing, times and
an extemporaneous estimation of the chorus size by ear (from the operator without headphone and microphone) were recorded for each answer. For a better localization of the pack we repeated one or more trials from a place closer to the presumed site of response or concurrent sessions were performed by two groups of operators. Real pack sizes were unknown for the free-ranging wolves.
Humans’ and free-ranging wolves’ howls were cap-tured with a Sennheiser directional microphone fitted with a windshield (ME67 head with K6 power module– frequency response: 50–20,000 Hz) and saved on a hand-held M-Audio Microtrack 24/96 II digital recorder, in uncompressed Wave format with a 44,100 Hz sam-pling rate and 16 bits amplitude resolution.
Bioacoustic analysis
Acoustic signals were analysed with Raven pro 1.4, de-veloped by Cornel Lab of Ornithology) [47], and with the open source Seewave package [49] in R v. 2.9.0 [48] to implement the spectral view.
To estimate chorus size by visual inspections, spectro-grams and spectral envelopes were computed for each audio file (Figs. 2 and 3). Spectral envelope (orspectrum) represents the sound at a given instant, showing the fre-quencies on the horizontal axis and the sound pressure (or amplitude) on the vertical axis [47, 55, 56]. The spec-trogram of a sound represents instead a sequence of spectra, showing time on the horizontal axis, frequency on the vertical axis, and the sound pressure as a greyscale or different colour scale (Fig. 3) [47, 55, 56]. Spectrogram and spectrum are based on the mathemat-ical function Fourier transform [47, 55, 56], and the ver-sion of this function which is used to represent digitalised/discrete signals is called discrete Fourier transform (DFT) [47]. DFT size represents the length of the analysis window (the window size), and thus the number of frames sampled to compute each spectrum of the spectrogram, while the window function (i.e., Han-ning, Gaussian) determines how to taper the abruptness of the onset and offset of a segment [56]. A narrow-band spectrogram (high window size values) results in a spectrogram with frequencies which clearly differ from one another. To analyse wolves choruses, parameters were set as follows: DFT size: 2048 samples; Hanning window; frequency grid: 21.5 Hz; time step: 10 ms, where frequency grid = (sampling frequency)/DFT size, while time step was taken to be the distance between the centre of subsequent samples. In case of noise in the recordings (anthropogenic: cars, planes, high music from villages, human voices, bells; natural: wind, rivers, other animals), a band-pass flat filter (100–2000 Hz) was ap-plied to delete noise and thus to improve the audibility of wolves’replies.
Every single howl emitted by a wolf appears as a fun-damental frequency (F0) and its harmonic overtones, or harmonics (Fig. 2). The fundamental frequency is the glottal pulse rate and determines the pitch of the voice [56], while harmonic overtones are integer multiples of the fundamental frequency (F0*2; F0*3;…, F0*N) [56].
Chorus size was then estimated by counting the num-ber of different howls (viewed as the fundamental plus harmonics) visualised at the same time (Fig. 2)), assum-ing that one wolf cannot produce multiple fundamental frequencies at a given time. Harmonic overtones were easily recognised because of their shape (same as F0) and frequencies (integer multiples of F0); since the dif-ference between howls (inter-harmonic space) doubles from the fundamental frequencies to the first har-monics, they can also help recognise different howls (Fig. 2).
Statistical analysis
All statistical analyses were carried out using R v. 2.9.0 [48]. Spearman’s rank correlations were computed to compare the real and bioacoustically predicted chorus size, the bioacoustic estimations of the chorus sizes per-formed by two different operators and the bioacoustic and aural estimation of the chorus size. Hypotheses of no mean differences between the real and bioacoustically predicted chorus size, the bioacoustic estimations of the chorus sizes performed by two different operators and the bioacoustic and aural estimation of the chorus size were tested by Wilcoxon matched-pairs signed-ranks test.
Additional files
Additional file 1:R Script for wolf choruses analysis with Seewave package in R environment.(R 1 kb)
Additional file 2:Audio file of free-ranging wolf howling. (WAV 7962 kb)
Additional file 3:Links to the videos used for WDH test. (DOCX 12 kb)
Competing interests
The authors declare that they have no competing interests.
Authors’contributions
Conceived and designed the experiments: DP, LM, MA. Performed the experiments: DP, LM, EB, LS. Analysed the data: DP, LM, EB, LS. Wrote the paper: DP, LM, EB, MA. All authors read and approved the final manuscript.
Acknowledgements
Funding
This work has been supported by Regione Toscana, University of Sassari and by the Provincial Government of Arezzo (Italy). The funders had no role in study design, data collection and analysis, decision to publish, or preparation of the manuscript.
Author details
1
Department of Science for Nature and Environmental Resources, University of Sassari, via Muroni 25, I-07100 Sassari, Italy.2Servizio Piano Faunistico,
Provincia di Arezzo, Piazza della Libertà 3, I–57100 Arezzo, Italy.3Szent István University, Institute for Wildlife Conservation, Páter K str 1, Gödöllő, Hungary.
Received: 17 March 2015 Accepted: 1 September 2015
References
1. Mladenoff DJ, Sickley TA, Wydeven AP. Predicting gray wolf landscape recolonization: logistic regression models vs. new field data. Ecol Appl. 1999;9:37–44.
2. Dickman AJ, Macdonald EA, Macdonald DW. A review of financial instruments to pay for predator conservation and encourage human-carnivore coexistence. Proc Natl Acad Sci. 2011;108:19836–6. 3. Primack RB. Essentials of conservation biology. Fifth: Edition; 2010. 4. Ripple WJ, Estes JA, Beschta RL, Wilmers CC, Ritchie EG, Hebblewhite M,
et al. Status and ecological effects of the world’s largest carnivores. Science. 2014;343:1241484.
5. Walpole MJ, Leader-Williams N. Tourism and flagship species in conservation. Biodivers Conserv. 2002;11:543–7.
6. Kleiven J, Bjerke T, Kaltenborn BP. Factors influencing the social acceptability of large carnivore behaviours. Biodivers Conserv. 2004;13:1647–58. 7. Berger KM. Carnivore-Livestock conflicts: effects of subsidized predator
control and economic correlates on the sheep industry. Conserv Biol. 2006;20:751–61.
8. Promberger C, Schroder W, editors. Wolves in Europe: status and perspectives. Ettal, Germany: Munich Wildlife Society; 1993. 9. Breitenmoser U. Large predators in the Alps: the fall and rise of man’s
competitors. Biol Conserv. 1998;83:279–89.
10. Chapron G, Kaczensky P, Linnell JDC, von Arx M, Huber D, Andrén H, et al. Recovery of large carnivores in Europe’s modern human-dominated landscapes. Science. 2014;346:1517–9. doi:10.1126/science.1257553. 11. Ripple WJ, Beschta RL. Trophic cascades in Yellowstone: The first 15 years
after wolf reintroduction. Biol Conserv. 2012;145:205–13. doi:10.1016/ j.biocon.2011.11.005.
12. Fritts SH, Bangs EE, Gore JF. The relationship of wolf recovery to habitat conservation and biodiversity in the northwestern United States. Landsc Urban Plan. 1994;28:23–32. doi:10.1016/0169-2046(94)90040-X.
13. Pimlott DH. The use of tape-recorded wolf howls to locate timber wolves. Toronto: Twenty-second Midwest Wildlife Congress; 1960. p. 15.
14. Harrington FH, Mech LD. Wolf howling and its role in territory maintenance. Behaviour. 1979;68:207–48.
15. Harrington FH, Mech LD. An analysis of howling response parameters useful for wolf pack censusing. J Wildl Manag. 1982;46:686–93.
16. Harrington FH. Aggressive howling in wolves. Anim Behav. 1987;35:7–12. 17. Fuller TK, Sampson BA. Evaluation of a simulated howling survey for wolves.
J Widl Manag. 1988;52:60–3.
18. Nowak S, Jędrzejewski W, Schmidt K, Theuerkauf J, Mysłajek RW, Jędrzejewska B. Howling activity of free-ranging wolves (Canis lupus) in the Białowieża Primeval Forest and the Western Beskidy Mountains (Poland). J Ethol. 2006;25:231–7.
19. Blanco JC, Yolanda C. Surveying wolves without snow: a critical review of the methods used in Spain. Hystrix. Ital J Mammal. 2012;23:35–48. 20. Szabó L, Heltai M, Szucs E, Lanszki J, Lehoczki R. Expansion range of the
golden jackal in Hungary between 1997 and 2006. Mammalia. 2009;73:307–11. doi:10.1515/MAMM.2009.048.
21. Gese EM, Ruff RL. Howling by coyotes (Canis latrans): variation among social classes, seasons, and pack sizes. Can J Zool. 1998;76:1037–43.
22. Harrington FH. Chorus howling by wolves: Acoustic structures, pack size and Beau Geste effect. Bioacoustics. 1989;2:117–36.
23. Dugnol B, Fernández C, Galiano G. Wolf population counting by spectrogram image processing. Appl Math Comput. 2007;186:820–30.
24. Dugnol B, Fernández C, Galiano G, Velasco J. Implementation of a diffusive differential reassignment method for signal enhancement: An application to wolf population counting. Appl Math Comput. 2007;193:374–84.
25. Dugnol B, Fernández C, Galiano G, Velasco J. On a chirplet transform-based method applied to separating and counting wolf howls. Signal Process. 2008;88:1817–26.
26. Passilongo D, Dessi-Fulgheri F, Gazzola A, Zaccaroni M, Apollonio M. Wolf counting and individual acoustic discrimination by spectrographic analysis [Abstract]. Bioacoustics. 2012;21:78–9.
27. Tooze ZJ, Harrington FH, Fentress JC. Individually distinct vocalizations in timber wolves, Canis lupus. Anim Behav. 1990;40:723–30.
28. Palacios V, Font E, Marquez R. Iberian wolf howls: acoustic structure, individual variation, and a comparison with North American populations. J Mammal. 2007;88:606–13.
29. Zaccaroni M, Passilongo D, Buccianti A, Dessi-Fulgheri F, Facchini C, Gazzola A, et al. Group specific vocal signature in free- ranging wolf packs. Ethol Ecol Evol. 2012;24:322–31.
30. Joslin PWB. Movements and home sites of timber wolves in Algonquin Park. Am Zool. 1967;7:279–88.
31. Huron D. Voice Denumerability of Homogeneous Timbres. Music Percept Interdiscip J. 2010;6:361–82.
32. Stöter F-R, Schoeffler M, Edler B, Herre J. Human ability of counting the number of instruments in polyphonic music. Proc Meetings Acoust. 2013;19:035034–4.
33. Boitani L. Patterns of homesites attendance in two Minnesota wolf packs. In: Harrington FH, Paquet PC, editors. Wolves of the World: Perspectives of Behavior, Ecology and Conservation. New York: Noyes, Park Ridge; 1982. p. 158–72.
34. Apollonio M, Mattioli L, Scandura M, Mauri L, Gazzola A, Avanzinelli E. Wolves in the Casentinesi Forests: insights for wolf conservation in Italy from a protected area with a rich wild prey community. Biol Conserv. 2004;120:249–60.
35. Stenglein JL, Waits LP, Ausband DE, Zager P, Mack CM. Estimating gray wolf pack size and family relationships using non invasive genetic sampling at rendezvous sites. J Mammal. 2011;92:784–95.
36. Burch JW, Layne GA, Follmann EH, Rexstad EA. Evaluation of Wolf Density Estimation from Radiotelemetry Data. Wildl Soc Bull. 2005;33(4):1225–36.
37. Iliopoulos Y, Youlatos D, Sgardelis S. Wolf pack rendezvous site selection in Greece is mainly affected by anthropogenic landscape features. Eur J Wildl Res. 2013;60:23–34.
38. Galaverni M, Palumbo D, Fabbri E, Caniglia R, Greco C, Randi E. Monitoring wolves (Canis lupus) by non-invasive genetics and camera trapping: A small-scale pilot study. Eur J Wildl Res. 2012;58:47–58. doi:10.1007/s10344-011-0539-5. 39. Mech LD. The Wolf: The Ecology and Behaviour of an Endangered Species.
New York: The Natural History Press, Garden City; 1970.
40. Jedrzejewski W, Schmidt K, Theuerkauf J, Jedrzejewska B, Selva N, Zub K, et al. Kill rate and predation by wolves on ungulate populations in Bialowieza primeval forest (Poland). Ecology. 2002;83:1341–56. 41. Shmidt Mech LD. Wolf pack size and food acquisition. Am Nat.
1997;150(4):513–7.
42. Peters G, Tembrock G. Subharmonics, biphonation, and deterministic chaos in mammal vocalizations. Bioacoustics. 1998;9:171–96.
43. Riede T, Herzel H, Mehwald D, Seidner W, Trumler E, Böhme G. Nonlinear phenomena in the natural howling of a dog-wolf mix. J Acoust Soc Am. 2000;108:1435–42.
44. Richards DG, Wiley RH. Reverberations and Amplitude Fluctuations in the Propagation of Sound in a Forest: Implications for Animal Communication. Am Nat. 2008;115:381–99.
45. Harris F. On the Use of Windows for Harmonic Analysis with the Discrete Fourier Transform. Proc IEEE. 1978;66:51–83.
46. Herbst CT, Herzel H, Svec JG, Wyman MT, Fitch WT. Visualization of system dynamics using phasegrams. J R Soc Interface. 2013;10:20130288. 47. Charif RA, Waack AM, Strickman LM. Raven Pro 1.3 User’s Manual. Ithaca,
New York: Cornell Laboratory of Ornithology; 2008.
48. Core Development Team R. R: a language and environment for statistical computing. Vienna, Austria: R foundation for statistical computing; 2011. 49. Sueur J, Aubin T, Simonis C. Seewave: a free modular tool for sound analysis
and synthesis. Bioacoustics. 2008;18:213–26.
50. Marescot L, Pradel R, Duchamp C, Cubaynes S, Mrboutin E, Choquet R, et al. Capture–recapture population growth rate as a robust tool against
detection heterogeneity for population management. Ecol Appl. 2011;21:2898–907. doi:10.1890/10-2321.1.
51. Morgan TW, Elliott CL. Comparison of remotely-triggered cameras vs. howling surveys for estimating coyote (Canis latrans) Abundance in central Kentucky. J Ky Acad Science. 2011;72(2):84–90.
52. VSO Downloader. Copyright VSO Software SARL. VSO-Software SARL Bat A, 1er Etage,109 Avenue de Lespinet, 31400 Toulouse.
53. 4Free Video Converter. 4 Free Studio. Copyright© 2000~2015 4Free Video Converter Inc. a Multimedia Utility Company.
54. Gazzola A, Avanzinelli E, Mauri L, Scandura M, Apollonio M. Temporal changes of howling in south European wolf packs. Ital J Zool. 2002;69:157–61. 55. Boersma P, Weenink D. Praat: doing phonetics by computer. 2009.
http://www.praat.org.
56. Hopp S, Owren MJ, Evans CS, editors. Animal Acoustic Communication: Sound Analysis and Research Methods. Berlin: Springer; 1998.
Submit your next manuscript to BioMed Central and take full advantage of:
• Convenient online submission
• Thorough peer review
• No space constraints or color figure charges
• Immediate publication on acceptance
• Inclusion in PubMed, CAS, Scopus and Google Scholar
• Research which is freely available for redistribution