R E S E A R C H
Open Access
Automatic schizophrenic discrimination
on fNIRS by using complex brain network
analysis and SVM
Hong Song
1, Lei Chen
1, RuiQi Gao
1, Iordachescu Ilie Mihaita Bogdan
1, Jian Yang
2, Shuliang Wang
1*,
Wentian Dong
3, Wenxiang Quan
3, Weimin Dang
3and Xin Yu
3FromIEEE BIBM International Conference on Bioinformatics & Biomedicine (BIBM) 2016 Shenzhen, China. 15-18 December 2016
Abstract
Background: Schizophrenia is a kind of serious mental illness. Due to the lack of an objective physiological data supporting and a unified data analysis method, doctors can only rely on the subjective experience of the data to distinguish normal people and patients, which easily lead to misdiagnosis. In recent years, functional Near-Infrared Spectroscopy (fNIRS) has been widely used in clinical diagnosis, it can get the hemoglobin concentration through the variation of optical intensity.
Methods: Firstly, the prefrontal brain networks were constructed based on oxy-Hb signals from 52-channel fNIRS data of schizophrenia and healthy controls. Then, Complex Brain Network Analysis (CBNA) was used to extract features from the prefrontal brain networks. Finally, a classier based on Support Vector Machine (SVM) is designed and trained to discriminate schizophrenia from healthy controls. We recruited a sample which contains 34 healthy controls and 42 schizophrenia patients to do the one-back memory task. The hemoglobin response was measured in the prefrontal cortex during the task using a 52-channel fNIRS system.
Results: The experimental results indicate that the proposed method can achieve a satisfactory classification with the accuracy of 85.5%, 92.8% for schizophrenia samples and 76.5% for healthy controls. Also, our results suggested that fNIRS has the potential capacity to be an effective objective biomarker for the diagnosis of schizophrenia.
Conclusions: Our results suggested that, using the appropriate classification method, fNIRS has the potential capacity to be an effective objective biomarker for the diagnosis of schizophrenia.
Keywords: Functional near-infrared spectroscopy, Schizophrenia discrimination, Complex brain network analysis, Support vector machine
Background
Schizophrenia [1] is a mental disorder characterized by abnormal social behavior and failure to understand what is real. Common symptoms include false beliefs, unclear or confused thinking, hearing voices that others do not hear, reduced social engagement and emotional expres-sion, and a lack of motivation. It not only produce great
*Correspondence: [email protected]
1School of Software, Beijing Institute of Technology, Beijing, China Full list of author information is available at the end of the article
pain to the patients but also bring a heavy burden to their family.
fNIRS is a haemodynamic-based technique for the assessment of functional activity in the human brain [2]. Based on the tight coupling of neural activity and gen delivery [3], changes in the concentration of oxy-genated and deoxyoxy-genated haemoglobin are noninvasively measured by fNIRS and taken as indicators for cortical activation. The typical fNIRS signal observed after neural activation is a decrease of deoxygenated accompanied by an increase of oxygenated comparable in time course to
Song et al. BMC Medical Informatics and Decision Making 2017, 17(Suppl 3):166 Page 2 of 66
the blood oxygenation level dependent signal of fMRI [4]. fNIRS provides comprehensive information about haemo-dynamics consisting of oxygenated, deoxygenated and changes in total haemoglobin. It is characterised by its straightforward application which resembles in the out-ward appearance more an electroencephalogram. Thus, the data collection is comfortable for the subjects because of the less constrictive measurement circumstances which probably lead to more ecologically valid conditions than in other neuroimaging methods [5]. These inherent advan-tages accompanied by the rapid developments in tech-nology and methodology enabled fNIRS to easily enter psychological, psychiatric and basic research on children, adults and elderly subjects.
Because the symptom of schizophrenia is similar with other diseases, such as depression and anxiety. Doctors can only use the information of genetic predisposition, substance abuse, living conditions and prenatal stressors to predict the schizophrenia is triggered or not. Usually it is not generate immediately but takes years for the dis-ease to surface. So design a computer aided identification method can help improving the doctor’s diagnostic result. With that being the case, many patients can have access to a proper medication, as such, the wellbeing of the patients and the medical quality of hospitals will increase.
During the past several years, many studies have applied the fNIRS technique to investigate the brain activation patterns in patients with schizophrenia. Converging evi-dence suggests schizophrenia patients are often associ-ated with reduced activities and inappropriate activity timing around the bilateral prefrontal cortex during a verbal fluency task or other cognitive tasks [6]. Based on these findings, some studies have attempted to apply the fNIRS signal as a diagnostic tool with different pat-tern recognition methods. In [7], authors measured the changes of the oxy-Hb signal during multiple cognitive tasks from two fNIRS channels located in the bilateral prefrontal areas and then applied stepwise linear discrim-inant analysis to distinguish patients with schizophrenia from healthy subjects. They separated the total sample into two groups, and each group consisted of 60 sub-jects (including 30 patients with schizophrenia and 30 age-and gender-matched healthy controls). The experi-mental results demonstrated that there was an accuracy rate of 88.3% for classification in the first group, and the discrimination function derived from the first group cor-rectly differentiated 75% of the subjects in the second group. To integrate spatial and temporal information in multichannel fNIRS, [8] employed a novel probabilistic pattern recognition method called Gaussian process clas-sifier for the diagnostic classification of schizophrenia. Using the temporal patterns of fNIRS data measured dur-ing a workdur-ing memory task, an overall accuracy of 76% was achieved in a group of 80 samples. And [9] applied
a 52 channel fNIRS system to identify the significantly different regions in the prefrontal cortex during a ver-bal fluency test and then utilized a k-means clustering method for discriminant analysis between schizophre-nia patients and healthy subjects. The results indicated 68.69% and 71.72% of the participants were correctly clas-sified as schizophrenic or healthy subjects with all 52 channels and six significantly different channels, respec-tively. And [10] proposed a method using principal com-ponent analysis and SVM to discriminate patients with schizophrenia from health controls using a large sample of 52 schizophrenia patients and 38 healthy controls. They achieved a satisfactory classification with the accuracy of 93.33%, 100% for schizophrenia samples and 84.62% for healthy controls.
Human brain network is one of the complex networks [11, 12]. Researchers have used the complex network the-ory [13, 14] to construct the brain network, then analyze the constructed brain network using complex network theory and calculate index of the brain network for further study. The brain network can be divided into structural and functional brain network [15, 16]. The nodes and edges are two key elements in the brain network. Diffusion tensor imaging and diffusion spectrum imaging [17, 18] are two imaging techniques used in structural brain net-work. Since the two techniques can track the direction of the mental fiber electrical signal, the structural brain net-work is considered as directional. The definition of the node of functional brain network is changing with differ-ent imaging techniques. Generally we define the connec-tions between nodes by calculating pearson correlation or partial correlation which is used to describe the statisti-cal significance of functional brain signals over a period of time. The functional network is non-directional since the correlation between nodes only reflects their statistical significance, no causal relationship.
In this paper, we designed a cognitive task and recruited a group of subjects to perform this task. The group included 42 schizophrenia patients and 34 healthy con-trols and a 52 multichannel fNIRS system was used to examine the hemodynamic signals in the bilateral pre-frontal and superior temporal cortices during the cogni-tive task. Then we used CBNA to extract the effeccogni-tive features between schizophrenia patients and healthy con-trols. Finally we trained the SVM classifier and evaluated it with leave-one-out cross validation. The results show that the proposed approach has the high potential to be a promising clinical tool in the objective diagnosis and treatment of psychiatric disorders.
Methods
DataSet description
Fig. 1Ten to twenty system channel map for the 52 channels
a 52 multichannel fNIRS System (ETG-4000, Hitachi Medical Co., Japan). In the system, 33 probes (17 emit-ters and 16 detectors) were stabilized on the scalp and arranged as a 3×11 array, which was positioned accord-ing to the international 10–20 system. The recordaccord-ing channels were established between each pair of emit-ters and detectors, which resulted in 52 channels total. Specifically, the detector between Channel 5 and 6 was located at Fz, Channel 46 and 49 were placed in Fp2 and Fp1, and the emitters which were close to Channel 43 and 52 were fitted around T4 and T3, respectively. Fz, Fp2, Fp1, T4 and T3 are the reference electrode positions in the international 10-20 system, shown in Fig. 1. Thus, the fNIRS probe set covered the entire prefrontal cortex and some regions of the superior temporal cortex. The relative changes in oxy-Hb and deoxy-Hb were measured using a reflectance mode with two different wavelengths (695 and 830 nm) of near-infrared light. The relative changes in total-Hb were equal to the sum of oxy-Hb and deoxy-Hb. The temporal resolution of fNIRS was set to 0.1 s.
The dataset included 42 patients with schizophrenia (mean age: 31 ± 12 years, female/male: 26/16) and 34 ageand sex-matched healthy controls (mean age: 33 ± 10 years, female/male: 20/14). All subjects were right-handed and native Chinese speakers. The diagnosis for schizophrenia was based on the Structured Clinical Inter-view for the DSM-IV (American Psychiatric Association, 1994). The healthy controls were enrolled through the local community and then assessed to confirm no history of psychiatric or neurologic disorders. This study was con-ducted in accordance with the Declaration of Helsinki and was approved by the ethics committee of Peking Univer-sity Sixth Hospital. All subjects provided written informed consent after the experimental procedure had been fully explained.
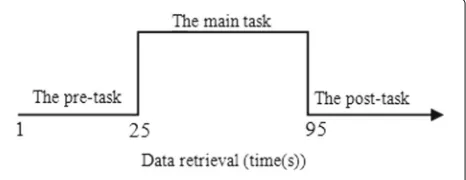
The experiment was performed in a quiet environment. All subjects were required to maintain emotionally sta-bility prior to the experiment and to avoid moving the head as much as possible during the measurement. We designed a one-back memory task. The task comprised a 5s pre-scan and a 25s waiting period, a 70s task period, and a 50s post-task baseline period. We can see it in Fig. 2. During the pre- and post-task baseline periods, the sub-jects were required to stare the screen. During the task period, they were instructed to press a button with their right index finger whether or not the current image pre-sented on the screen was the same as the previously shown one. The images were changed every 2s and the rendering time was 0.5s, there were a total of 29 figures shown. A detailed description of this experimental procedure could be found in elsewhere [19].
Schizophrenic discrimination method
The process of schizophrenia discrimination includes preprocessing the fNIRS data, constructing brain net-work, feature extraction, training the classifier, cross validation and testing. The flowchart of schizophrenia discrimination process is shown in Fig. 3. In this paper,
Song et al. BMC Medical Informatics and Decision Making 2017, 17(Suppl 3):166 Page 4 of 66
Fig. 3The framework of schizophrenia discrimination
CBNA is used to extract the feature eigenvalues and SVM is used as the classifier.
Preprocessing data
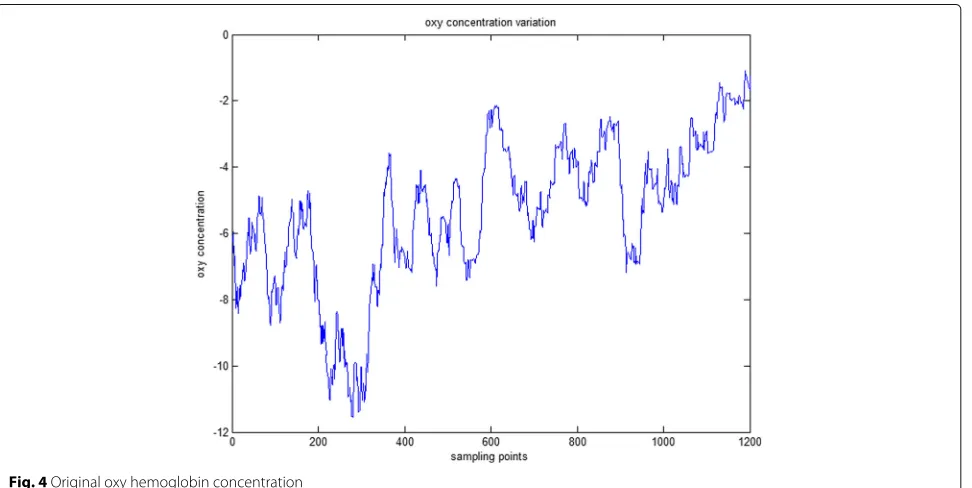
The original fNIRS data of a schizophrenia patient is shown in Fig. 4, the blue line plots the oxy hemoglobin concentration variation of healthy person. In order to reduce the effects of the high frequency noise, low-pass filtering is used to do data preprocessing. Before low-pass filtering, We first use Fast Fourier transform to do spectrum analysis to find which frequency the fNIRS exists in. Figure 5 shows the Fast Fourier transform result of original oxy hemoglobin con-centration variation of healthy person and schizophrenia patient, blue line represents the healthy person and red
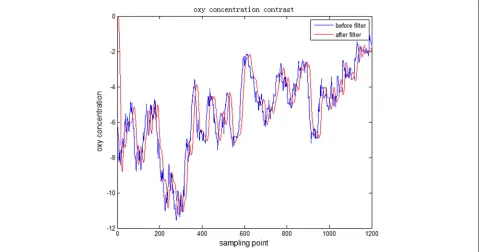
line represents the schizophrenia patient. It is obvi-ously that the frequency of fNIRS signal mainly exists in 0.0–0.5 HZ, so a low-pass filter with the cut-off frequency 0.5 Hz is designed to do the filtering. The result of the low-pass filtering is shown in Fig. 6. The blue line represents original data and red line represents processed data. It can be seen that the curve after low-pass filter is smoother than before, some high frequency noise is reduced. This reduced the effects of high frequency noise and improved the classification accuracy.
Construct the brain network
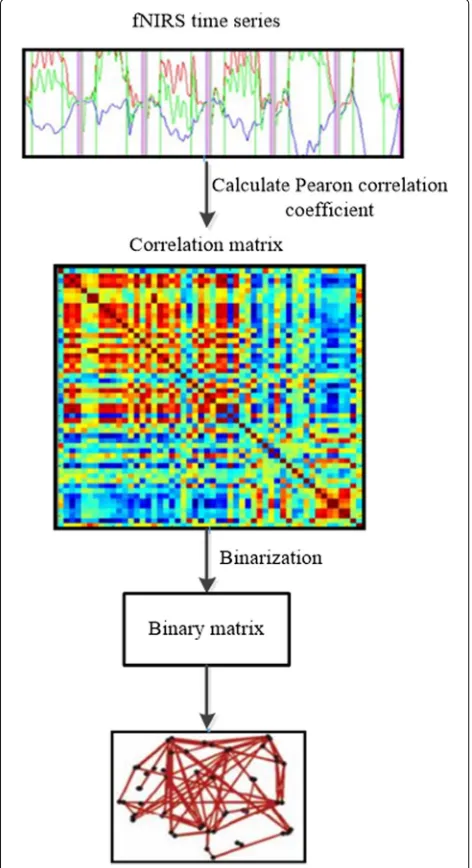
The process of a functional brain network construction is shown in Fig. 7. During the construction process, defining
Fig. 5The fourier transform of original oxy hemoglobin concentration of normal and schizophrenia people
the edge and node of the brain network are two important steps. Nodes in the brain network correspond to the measured 52 channels of fNIRS. The Pearson correlation coefficient of fNIRS time series between different nodes is usually calculated to quantify the relationship between them. The edge is defined by setting an appropriate
threshold to binarize the connection relationship of the nodes.
The Pearson correlation coefficient is calculated as follows, take theithandjthchannel’s fNRIS data as variable
X,Y(i,j = 1, 2. . .52,i = j), the Pearson correlation coefficient isri,j, then
Song et al. BMC Medical Informatics and Decision Making 2017, 17(Suppl 3):166 Page 6 of 66
Fig. 7The flow chart of functional brain network construction
ri,j= cov(X
,Y)
σXσY =
E(X−μX)(Y−μY)
σXσY
= E(XY)−E(X)E(Y)
E(X2)−E2(X)E(Y2)−E2(Y) (1)
Wherecov(X,Y)is the covariance,σX,σY are the
stan-dard deviation, μX, μY are the mean of variableX and
Yrespectively. The Pearson correlation coefficient of two variablesXandYis equal to the covariance divided by the product of the standard deviation of the two variables.
From the calculation process of Pearson correlation coefficient, we can get a Pearson correlation coefficient matrix with a row and column which have 52 dimensions
for a subject. Each element in the matrix is a Pearson correlation coefficient value. Wheni=j, the Pearson cor-relation coefficient is 1. Here we calculated the Pearson correlation coefficient of 76 subjects and constructed 76 correlation coefficient matrices. Fig. 8 shows the result of Pearson correlation coefficient matrix of a schizophrenic patient after color rendering.
After quantizing the relationship between 52 chan-nels,we got the Pearson correlation coefficient matrix, it is necessary to choose an appropriate thresholdT in order to construct the edge of the nodes. Whether there is an edge connection between two nodes is depend on the Pearson correlation between two channels.If the absolute value of the Pearson correlation coefficient is greater than the threshold, there is an edge between the corresponding nodes, and vice versa.
ei,j=
1, |ri,j| ≥T
0, |ri,j|<T (2)
We use sparsity as a measurement of the thresholdT. Sparsity is the ratio of the actual number of edge to the possible maximum number of edge in matrix. There is no quantitative relationship between sparsity S and thresh-oldT. If the sparsity of the binarized matrix is set to 50%, when binarizing the Pearson correlation matrix,T is the median of the ascending correlation coefficient. When the correlation coefficient is greater than the median, it has edge and vice verse. The actual number of edge is just half of the maximum possible one. In the study of the brain network, most researchers use sparsity with fixed interval to study the topological properties of the brain network with multiple thresholds. Here we set the sparsity range from 1 to 50% to ensure the sparseness of the network.
After binarization, we get the binary matrix which is corresponding to the brain network matrix. Thus we get the brain network of 76 subjects.
Feature extraction based on CBNA
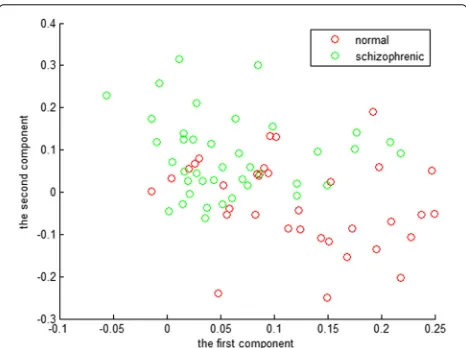
After get the brain network of 76 subjects, the basic attribute index of the network is calculated by using the formula of basic attribute value in complex network the-ory. The basic attributes we used here are the degree of node, clustering coefficient, local efficiency and global efficiency. In this way we get a 52-dimensional eigenvec-tor of the above four attributes. Since the threshold is changed from 0.01 to 0.5 with an interval of 0.01, it is necessary to select eigenvector with significant differences in each attribute from the 50 thresholds to make subse-quent classification decisions. After reduce the dimension of eigenvector of each attribute, we find there is a signif-icant difference of the node degree when the threshold is set to 0.21. Thus, we choose the attribute of the node degree at threshold 0.21 to construct the final eigenvector. Fig. 9 shows the result of eigenvectors constructed with the attribute of node degree when the threshold is 0.21. It can be seen that the eigenvector between the healthy control and schizophrenic has significance difference.
SVM-based classifier
The SVM is a learning machine for a two-class classifica-tion problem [20]. It is proposed by Vapnik as an extension of statistical learning theory. Due to its ability to handle high-dimensional data and could acquire high accuracy in the classification, SVM has been widely used in many areas.
SVM conceptually implements the idea that vectors are non-linearly mapped to a high dimension feature space. In the feature space, a linear separation surface is created
Fig. 9Result of eigenvectors constructed with the attribute of node degree when the threshold is set to 0.21
to separate the training data by minimizing the margin between the vectors of the two classes. The training ends with the definition of a decision surface that divides the space into two sub-spaces. Each sub-space corresponds to one class of the training data. Once the training is com-pleted, the test data are mapped to the feature space. A class is then assigned to the test data depending on which sub-space they are mapped to. In this paper, a SVM toolkit named libsvm written by Lin Chih-Jen from Taiwan Uni-versity [21] is used. A radial basis function is selected as a kernel function and parameters are kept as default values. Cross validation is frequently used in classification problems, which mainly divided intoK fold cross valida-tion and the leave-one-out cross validavalida-tion. Here we use the leave-one-out cross validation to evaluate the classifi-cation result. Suppose there areNsamples, leave-one-out cross validation continuesNrounds, each round one sam-ple will be as a test samsam-ple, the restN−1 samples are as the training sample. AfterNrounds of cross validation, each round will get a classification accuracy. Finally, the aver-age classification accuracy will be acquired forNrounds. leave-one-out cross validation can effectively reduce the classification accuracy error caused by the inefficient sam-ple. Here the dataset we used include 34 healthy persons and 42 schizophrenic patients. In the leave-one-out cross validation, the dataset is separated into 76 samples, every sample will be as a test sample and the rest 75 samples will be a training set, continues 76 rounds.
Results and discussion
The testing result of schizophrenics and healthy controls is shown in Table 1, where 39 of the 42 schizophre-nia and 26 of 34 health controls were discriminated successfully on Oxy-Hb/Deoxy-Hb signal. The method based on CBNA and SVM successfully discriminated 65 (39 schizophrenia and 26 healthy persons) signals with an overall accuracy of 85.5% for fNIRS classification on test-ing set. And on total signal, where 39 of the 42 schizophre-nia and 22 of 34 health controls were discriminated successfully. The method successfully discriminated 61 (39 schizophrenia and 22 healthy persons) signals with an overall accuracy of 80.3%.
Our study was a binary classification, and we first defined the class of schizophrenia patient as positive and the class of healthy control as negative. Then, TP is the number of schizophrenia patients correctly predicted; TN
Table 1The finally testing result
Classification accuracy Specificity Sensitivity
Oxy-Hb 85.5% 76.5% 92.8%
Deoxy-Hb 85.5% 76.5% 92.8%
Song et al. BMC Medical Informatics and Decision Making 2017, 17(Suppl 3):166 Page 8 of 66
is the number of healthy controls correctly predicted; FP is the number of healthy controls classified as schizophre-nia patients; and the FN is the number of schizophreschizophre-nia patients classified as healthy controls. Finally, the perfor-mance of a classifier can be quantified by using the ACC, SS and specificity or TNR; These measures are defined as follows:
ACC = TP+TN
TP+FP+TN+FN (3)
SS = TP
TP+FN (4)
TNR = TN
TN+FP (5)
ACC represents the ration between correctly classi-fied samples and total samples. SS represents the ratio between correctly classified schizophrenic patients and total schizophrenic patients. TNR represents the ratio between correctly classified health controls and total health controls. Therefore, a good fNIRS-aided diagnostic classifier is assumed to have larger ACC and TNR values.
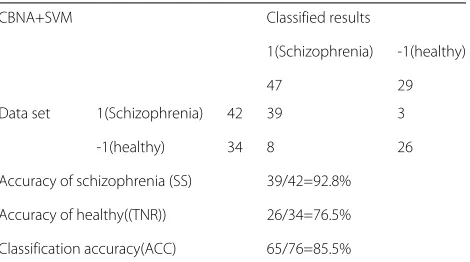
After 76 rounds of cross validation, there are totally 11 misclassified cases on Oxy-Hb signal. Including 8 cases of normal people and 3 cases of schizophrenic patients. The classification accuracy is 85.5%, specificity is 76.5%, sensitivity is 92.8%. Table 2 shows more details about the testing results on Oxy-Hb signal. For the Deoxy-Hb sig-nal, there are also 11 misclassified cases. Including 8 cases of normal people and 3 cases of schizophrenic patients. The classification accuracy is 85.5%, specificity is 76.5%, sensitivity is 92.8%, the same as Oxy-Hb signal. For the total signal is shown in Table 3. There are 15 misclassi-fied cases. Including 12 cases of normal people and 3 cases of schizophrenic patients. The classification accuracy is 80.3%, specificity is 64.7% and sensitivity is 92.8%. Here we choose Oxy-Hb signal to discriminate schizophrenic. This accuracy is especially satisfactory for the discrimination.
Table 2Testing result of schizophrenic and healthy on Oxy-Hb signal
CBNA+SVM Classified results
1(Schizophrenia) -1(healthy)
47 29
Data set 1(Schizophrenia) 42 39 3
-1(healthy) 34 8 26
Accuracy of schizophrenia (SS) 39/42=92.8% Accuracy of healthy((TNR)) 26/34=76.5%
Classification accuracy(ACC) 65/76=85.5%
Table 3Testing result of schizophrenic and healthy on total signal
CBNA+SVM Classified results
1(Schizophrenia) -1(healthy)
61 25
Data set 1(Schizophrenia) 42 39 3
-1(healthy) 34 12 22
Accuracy of schizophrenia (SS) 39/42=92.8% Accuracy of healthy((TNR)) 22/34=64.7% Classification accuracy(ACC) 61/76=80.3%
Conclusion
Our study demonstrated that the designed task is an effective experimental paradigm. Compared with healthy controls, the multichannel fNIRS results on the sample confirmed that schizophrenia patients in the Chinese pop-ulation had significant lower brain activation over the prefrontal cortex and superior temporal cortex. Finnally, we achieved a considerable overall classification accu-racy of 85.5% (65/76) using the SVM classifier and CBNA based feature selection on the oxy-Hb signal. Thus, SVM had the good classification performance especially after performing the CBNA based feature selection. Our results illustrated that, by using the appropriate classification method, fNIRS represents a promising diagnostic tool to differentiate schizophrenia patients from healthy controls.
Abbreviations
ACC: Accuracy; CBNA: Complex brain network analysis; Deoxy-Hb:
Deoxygenated hemoglobin; FN: False negative; fNIRS: Functional near-infrared spectroscopy; FP: False positive; LN: Letter-number; OSH: Optimal separating hyperplane; Oxy-Hb: Oxygenated hemoglobin; SVM: Support vector machine; TP: True positive; TN: True negative; TNR: True negative rate; VFT: Verbal fluency test
Acknowledgements
The authors would like to thank the staff of Peking University Sixth Hospital for welcoming and assisting the research team and the interview participants for their time.
Funding
Publication costs were funded by the National Hi-Tech Research and Development Program (2015AA043203), and the National Science Foundation Program of China (81430039, 61672099, 81430039, 61501030). This study received financila support from Frontier and interdisciplinary innovation program of Beijing Institute of Technology.
Availability of data and materials
The data is not shared with outside institutions.
About this supplement
Authors’ contributions
HS, LC and RQG planned the study, did experiment and wrote the manuscript. YJ and SLW modified the manuscript. WTD, WXQ, WMD and XY collected and interpreted the data. All authors read and approved the final manuscript.
Ethics approval and consent to participate
The study was conducted in accordance with the Declaration of Helsinki, and was approved by the local (Institute of Mental Health, Peking University ) ethics committee. Informed consent to participate in the study was obtained from all participants. Data access was granted in the context of project National Science Foundation Program of China (81430039/61672099), where the authors’ institutions participate
Consent for publication
Not applicable.
Competing interests
The authors declare that they have no competing interests.
Author details
1School of Software, Beijing Institute of Technology, Beijing, China.2School of
Optics and Electronics, Beijing Institute of Technology, Beijing, China.3Peking
University Sixth Hospital, Peking University Institute of Mental Health, Key Laboratory of Mental Health, Ministry of Health (Peking University), Beijing, China.
Published: 20 December 2017
References
1. Buckley PF, Miller BJ, Lehrer DS, Castle DJ. Psychiatric comorbidities and schizophrenia. Schizophr Bull. 2009;35:383–402.
2. Hoshi Y. Functional near-infrared optical imaging: utility and limitations in human brain mapping. Psychophysiology. 2003;40:511–20.
3. Duan L, Zhang YJ, Zhu CZ. Quantitative comparison of resting-state functional connectivity derived from fnirs and fmri: A simultaneous recording study. NeuroImage. 2012;60:2008–18.
4. Ehlis AC, Ringel TM, Plichta MM, et al. Cortical correlates of auditory sensory gating: a simultaneous near-infrared spectroscopy event-related potential study. Neuroscience. 2009;159:1032–43.
5. Suzuki M, Miyai I, Ono T, et al. Prefrontal and premotor cortices are involved in adapting walking and running speed on the treadmill: an optical imaging study. Neuroimage. 2004;23:1020–6.
6. Ehlis AC, Schneider S, Dresler T, Fallgatter AJ. Application of functional near-infrared spectroscopy in psychiatry. Neuroimage. 2014;85:478–88. 7. Azechi M, Iwase M, Ikezawa K, et al. Discriminant analysis in schizophrenia
and healthy subjects using prefrontal activation during frontal lobe tasks: a near-infrared spectroscopy. Schizophr Res. 2010;117:52–60.
8. Camacho LP, Prieto JG, Parellada M, et al. Predictors of schizophrenia spectrum disorders in early-onset first episodes of psychosis: a support vector machine model. J. European child & adolescent psychiatry. 2015;24(4):427–440.
9. Chuang CC, Nakagome K, Pu S, et al. Discriminant analysis of functional optical topography for schizophrenia diagnosis. J Biomed Opt. 2014;19: 0110061–6.
10. Song H, Bogdan IIM, Wang S, et al. Automatic schizophrenia discrimination on fnirs by using pca and svm. IEEE Int Conf Bioinforma Biomed IEEE Comput Soc. 2016;389–94.
11. Rubinov M, Sporns O. Complex network measures of brain connectivity: uses and interpretations. Neuroimage. 2010;52:1059–69.
12. Sporns O. The human connectome: a complex network. Ann N Y Acad Sci. 2011;1224:109–25.
13. Cao Y, Chen X, Sun K. Identification of vulnerable lines in power grid based on complex network theory. Electr Power Autom Equip. 2006;12: 1–5.
14. Yijia CXSKC. Structural vulnerability analysis of large power grid based on complex network theory. Trans China Electrotechnical Soc. 2007;22: 138–44.
15. van den Heuvel MP, Stam CJ, Kahn RS, et al. Efficiency of functional brain networks and intellectual performance. J Neurosci. 2009;29:7619–24. 16. Khundrakpam BS, Reid A, Brauer J, et al. Developmental changes in
organization of structural brain networks. Cereb Cortex. 2013;23:2072–85.
17. Jones DK, Leemans A. Diffusion tensor imaging. Magn Reson Neuroimaging Methods Protoc. 2011;1:127–44.
18. Menzel MI, Tan ET, Khare K, et al. Accelerated diffusion spectrum imaging in the human brain using compressed sensing. Magn Reson Med. 2011;66:1226–33.
19. Wang L, Fu X. Data mining with computational intelligence. IEEE Trans Neural Netw. 2006;17:826–6.
20. Suykens JAK, Vandewalle J. Least squares support vector machine classifiers. Neural Process Lett. 1999;9:293–300.
21. Chang CC, Lin CJ. Libsvm: a library for support vector machines. ACM Trans Intell Syst Technol. 2011;2:27.
• We accept pre-submission inquiries
• Our selector tool helps you to find the most relevant journal
• We provide round the clock customer support
• Convenient online submission
• Thorough peer review
• Inclusion in PubMed and all major indexing services
• Maximum visibility for your research
Submit your manuscript at www.biomedcentral.com/submit