R E S E A R C H A R T I C L E
Open Access
The predictability of claim-data-based
comorbidity-adjusted models could be improved
by using medication data
Ji Hwan Bang
1,2, Soo-Hee Hwang
1,3, Eun-Jung Lee
1,4and Yoon Kim
1,5*Abstract
Background:Recently, claim-data-based comorbidity-adjusted methods such as the Charlson index and the Elixhauser comorbidity measures have been widely used among researchers. At the same time, there have been an increasing number of attempts to improve the predictability of comorbidity-adjusted models. We tried to improve the predictability of models using the Charlson and Elixhauser indices by using medication data; specifically, we used medication data to estimate omitted comorbidities in the claim data.
Methods:We selected twelve major diseases (other than malignancies) that caused large numbers of in-hospital mortalities during 2008 in hospitals with 700 or more beds in South Korea. Then, we constructed prediction models for in-hospital mortality using the Charlson index and Elixhauser comorbidity measures, respectively. Inferring missed comorbidities using medication data, we built enhanced Charlson and Elixhauser comorbidity-measures-based prediction models, which included comorbidities inferred from medication data. We then compared the c-statistics of each model.
Results:247,712 admission cases were enrolled. 55 generic drugs were used to infer 8 out of 17 Charlson
comorbidities, and 106 generic drugs were used to infer 14 out of 31 Elixhauser comorbidities. Before the inclusion of comorbidities inferred from medication data, the c-statistics of models using the Charlson index were 0.633-0.882 and those of the Elixhauser index were 0.699-0.917. After the inclusion of comorbidities inferred from medication data, 9 of 12 models using the Charlson index and all of the models using the Elixhauser comorbidity measures were improved in predictability but, the differences were relatively small.
Conclusion:Prediction models using Charlson index or Elixhauser comorbidity measures might be improved by including comorbidities inferred from medication data.
Keywords:Severity-of-illness index, Comorbidity, Prescriptions, Drug, Risk-adjustment, Outcome assessment
Background
When reviewing medical records, claim data, such as claim data for payment, is much easier to obtain than clinical data. Thus, in recent years, many researchers have used claim data to predict prognoses for hospital-ized patients [1-16]. The most widely adopted methods of predicting patients’prognoses based on claim data are comorbidity-adjusted models such as the Charlson index
and the Elixhauser index [17,18]. However, one problem with comorbidity-adjusted models has been the number of missed comorbidities in claim data. Two separate Canadian studies revealed that 33-48% of comorbidities have been missed in claim data [19,20].
As claim-data-based comorbidity-adjusted models have become increasingly popular, many researchers have tried to find methods of improving the predictability of the comorbidity-adjusted models in order to overcome these limitations [21-25]. Some investigators have made efforts to compensate for problems caused by missed comorbidities in claim data by using drug prescription information. The Chronic Disease Score (CDS) is a * Correspondence:[email protected]
1
Department of Health Policy and Management, Seoul National University College of Medicine, 103 Daehak-ro, Jongno-gu, Seoul 110-799, Korea 5
Institute of Health Policy and Management, Medical Research Center, Seoul National University, Seoul, Korea
Full list of author information is available at the end of the article
prominent example of such efforts [26,27]. However, the performance of the CDS-based models in the pre-diction of prognoses was inferior to that of diagnosis-based models, including comorbidity-adjusted models [28,29]. The disappointing outcomes of trials using the CDS might be attributed to two flaws of the CDS: first, some drugs included in the CDS can be used for two or more diseases (or conditions), and second, the drugs by themselves may not reflect the severity of diseases (or conditions).
Therefore, it’s fair to assume that an algorithm-based comorbidity inference method combining medication data with the indications of each drug could help to identify missed comorbidities reflecting severity of dis-eases (or conditions). Our hypothesis is that if missed comorbidities, traced by medication data, were added to comorbidity-adjusted models, the predictabilities of the models might be improved. The purpose of our study is 1) to develop an algorithm-based comorbidity inference method by combining medication data and the indica-tions of each drug to identify missed comorbidities; and 2) to evaluate to what degree the predictive performance of comorbidity-adjusted models can be improved by the addition of drug-inferred comorbidities identified by the algorithm.
Methods
Framework of the study Subjects
We obtained inpatient claim data from all South Korean hospitals with more than 700 beds during the year 2008. After excluding malignant diseases, we identified twelve most responsible diagnoses that caused high numbers of in-hospital deaths.
Comorbidity-adjusted models for predicting in-hospital mortality
The Charlson index and Elixhauser comorbidity mea-sures were used to build comorbidity-adjusted models for in-hospital mortality (see‘Tools for adjusting severity of comorbidities’, below, for details), and the predictive performance of each model was evaluated.
Inferring missed comorbidities
Using medication, we inferred missed comorbidities from the claim data.
Comorbidity-adjusted models for predicting in-hospital mortalities that include drug-inferred comorbidities
We built in-hospital mortality prediction models based on the Charlson and Elixhauser comorbidity measures and at the same time included comorbidities inferred from prescribed medications.
Comparison of predictabilities of comorbidity-adjusted models before and after the inclusion of comorbidities inferred from medication data
We compared the predictability of the Charlson and Elixhauser comorbidity-based models that included co-morbidities inferred from medication data with the ori-ginal models of the Charlson and Elixhauser indices, which did not include the comorbidities inferred from medication data.
Study subjects
The study population consisted of all inpatients in South Korea who were admitted to any of the 66 hospitals identified as having more than 700 beds in 2008. To en-sure the validity and stability of the estimates for comorbidity-based mortality prediction, we chose to limit our study to hospitals with more than 700 beds, as they care for more than half of all South Koreans admit-ted to hospitals. We obtained the claim data of the hos-pitals included in the study from the HIRA, the organization that reviews all the claims of the entire population of South Korea, regardless of whether they belong to the national health insurance or the medical aid program. For patients who admitted twice or more during the study period, we considered them different cases. If the study subjects had been admitted the previ-ous year, in 2007, we also obtained and utilized the claim data of corresponding cases in 2007 in our construction
of the Charlson-index-based models (see ‘Tools for
adjusting severity of comorbidities’, below, for details). First, we identified the most responsible diagnoses (MRDx), which account for 80% of the in-hospital mor-talities identified in the claims. MRDx meant the princi-pal diagnoses that were most responsible for the hospitalization. We then excluded the claims with MRDx of malignancies because we could not accurately exclude the cancer patients admitted for palliative care. Regardless of the quality of care, in-hospital mortalities of cancer patients admitted for palliative care will inevit-ably be much higher than those of cancer patients ad-mitted for active treatment. Thus we did not include the cases with MRDx of malignant diseases (see next para-graph for detail). We grouped MRDx according to the classifications established by the US Agency for Health-care Research and Quality, but divided acute cerebrovas-cular diseases into intracranial hemorrhage and ischemic infarct because these two categories are quite different in pathophysiology and therapeutic approach [30].
be high regardless of the quality of care. We performed this study to develop methodology to rank quality of care of Korean hospitals. If we adapt comorbidity-adjusted models to measure quality of care in cancers, hospitals with many cancer patients for palliative or ter-minal care must be underrated unjustly. Thus we ex-cluded all the cancer patients.
Exclusion criteria
We excluded cases that met any of following criteria:
1. Age≤28 days or≥120 years [31]. 2. In-hospital stay > 365 days [31].
3. Transferred cases, including both transferred-in and transferred-out cases: The prognoses of transferred cases might not reflect qualities of care in
current hospitals.
4. Most responsible diagnoses that have a wide range of clinical spectrums (ex. sepsis, respiratory failure, intoxications, other lower respiratory diseases, cardiac arrest, ventricular fibrillation): They are not clinically homogeneous categories which are not suitable for a valid and reliable risk-adjusted mortal-ity prediction. This is the first large study which adapted comorbidity adjusted method, thus we de-cided to include relatively homogenous groups. Moreover, in these cases, the most responsible diag-noses, per se, might be results or complications of treatment rather than POA (present on illness).
Tools for adjusting the severity of comorbidities
In our study, we adopted the Charlson index with Deyo’s application as well as the Elixhauser comorbidity mea-sures for adjusting the severity of comorbidities. In a comorbidity-adjusted model, comorbidity indicates an associated disease or condition existing before the point of admission and is used interchangeably with Present on Admission (POA). In contrast, a disease or condition that occurred after hospitalization is called a complica-tion or non-POA [19].
Charlson index
The Charlson index is the most frequently used method for adjusting the severity of comorbidities in studies based on claim data [17]. In 1987, M.E. Charlson and her colleagues reported 17 comorbidities that influence the prognoses of hospitalized patients, and they gave a “weight” of 1 to 6 to each individual comorbidity, de-pending on the strength of the treatment outcome: the higher weight, the worse the prognosis tends to be (Additional file 1: Table S1). The sum of weights for co-morbid conditions indicates the severity of coco-morbidi- comorbidi-ties for each individual case. Widely accepted among researchers, the Charlson index has been used to build
nation-wide prognoses prediction models in many countries [31-33].
To apply the Charlson index, it is important to distin-guish a comorbidity (or POA) from a complication (or non-POA) in associated diagnoses (not MRDx). Deyo’s application has been used more than any other to make this distinction [21]. In Deyo’s application, chronic dis-eases (or conditions) are classified as POA conditions. In addition, according to Deyo’s application, diseases (or conditions) that are not explicitly chronic must be men-tioned in the previous data from at least one year prior to the index admissions in order to be considered as POA conditions; otherwise, they are regarded as non-POA conditions (Additional file 1: Table S1).
Elixhauser comorbidity index
Elixhauser et al. found 31 comorbidities that influence the prognoses of hospitalized patients (when hyperten-sion is divided between uncomplicated hypertenhyperten-sion and complicated hypertension) (Additional file 1: Table S2) [18]. In the Elixhauser comorbidity index, existence or non-existence of specific comorbidities is used to adjust the severity of comorbidities. The Elixhauser comorbid-ity index is generally accepted as similar or superior to the Charlson index in its prediction of prognoses [34-37]. However, Elixhauser-index-based models could be unstable due to the high number of independent vari-ables in the model.
In order to discriminate between POA conditions and non-POA conditions, the Diagnosis-related Group (DRG) screening method was used in the Elixhauser comorbidity measures. The DRG screening method classified secondary diagnoses as non-POA when the method determined that secondary diagnoses belonged to the same disease category as the MRDx and/or re-sulted from MRDx; otherwise, they were considered POA conditions.
Because the International Classification of Diseases-10th Edition (ICD-10) has been used for diagnostic cod-ing in South Korea since 1995, Quan’s algorithm was applied to convert ICD-10 diagnoses to the ICD-9-CM diagnoses on which the Charlson index and Elixhauser comorbidity index were originally based [38].
Inferring missed comorbidities
We excluded drugs that met any of following criteria: 1) Drugs that can be used for more than one disease en-tity under the prescription guidance of the HIRA [39]; 2) Drugs possibly used in relatively mild abnormal con-ditions including topical agents; 3) Antineoplastics; 4) Parenteral drugs. For example, paroxetine, one of the most frequently prescribed antidepressants, was ex-cluded because it could be used to treat other conditions such as obsessive-compulsive disorder. In the Elixhauser comorbidity measures, uncomplicated hypertension and complicated hypertension are classified as different en-tities. If a patient was prescribed an antihypertensive, we could not determine whether he or she had uncompli-cated hypertension or compliuncompli-cated hypertension. Thus, we excluded antihypertensives. Similarly, in both the Charlson index and the Elixhauser comorbidity index, uncomplicated diabetes is distinguished from compli-cated diabetes. Thus, we excluded antidiabetic drugs. Antineoplastic drugs were excluded because they could be used not only for cancer patients, but also for pa-tients with connective tissue diseases and transplantation patients. Parenteral drugs were excluded because many parenteral drugs were used to treat conditions that ap-peared after admission.
Finally, to eliminate non-POA conditions from the in-ferred comorbidities, the DRG screening method of the Elixhauser comorbidity measure was used (see‘Tools for adjusting severity of comorbidities’for details) [18].
Building prediction models for in-hospital mortalities In this study, we built prediction models for in-hospital mortalities using multiple logistic regression analyses. The independent variables of each model were: age, sex, status of health insurance (the National Health Insur-ance beneficiaries or Medical Aids beneficiaries), admis-sion category (emergency admisadmis-sion or not), operative status (operated on or not), and adjusted severity of co-morbidities measured by the Charlson index or Elixhauser comorbidity measures. Following our application of the aforementioned methods, we built four models for each disease in the study, as indicated below.
1. Charlson models: Charlson-index-based
comorbidity-adjusted models that use only comor-bidities described in the claim data.
2. Elixhauser models: Elixhauser-comorbidity-measure-based models that use only comorbidities described in the claim data.
3. Enhanced Charlson models: Charlson-index-based comorbidity-adjusted models that use both comor-bidities described in the claim data and inferred from medication data.
4. Enhanced Elixhauser models:
Elixhauser-comorbidity-measure-based comorbidity-adjusted
models that use both comorbidities described in the claim data and inferred from medication data.
Statistic validation of the models
We calculated the c-statistic for each model and com-pared them to measure whether the addition of drug-inferred comorbidities could improve the predictive power of the Charlson and Elixhauser comorbidity indi-ces. The c-statistic is an indicator of predictability. If the c-statistic = 0.5, it means the predictability of the model is 0%. If the c-statistic = 1.0, it means the predictability of the model is 100%. Additionally, we carried out Hosmer-Lemeshow Goodness-of-Fit tests to examine the fitness of the models. We performed bootstrapping method to calculate a 95% confidence interval of the c-statistics of each model.
Changes of Charlson index scores in original and enhanced models were compared by Wilcoxon signed rank test.
All the statistical analyses were performed by SAS v9.2 (SAS Institute Inc., Cary, NC, USA).
Ethics statement
According to the policy of our institution (Seoul Na-tional University, College of Medicine), researches re-quested by the government to the public interests are to be exempted from approval by the Institutional Review Board (IRB). Our study was proposed by the govern-mental organization of Korea (The HIRA). Therefore this study was accomplished without ethical review of the IRB.
Results
General characteristics of the study population
Total 706,321 admissions with 33 MRDx were account for 80% of in-hospital mortalities during study period. Excluding the cased with MRDx of wide range of clinical spectrums and malignancies, finally 12 MRDx with 247,712 admission cases were included in this study (Table 1). The overall in-hospital mortality rate was 6.8% (16,962 cases). In the 12 MRDX, intracranial hemorrhage was the most frequent MRDx of in-hospital mortalities, followed by pneumonia, ischemic infarct, acute myocar-dial infarction, and non-alcoholic liver disease. The major-ity of study cases were adults (median age: 61 years, interquartile range: 47-71), except cases of pneumonia (median age: 4 years, interquartile range: 1-63), and 59.1% of the cases (146,484 cases) were male.
Charlson models and enhanced Charlson models
medication data and HIRA’s prescriptions guidelines (Additional file 1: Table S3).
Out of the 17 comorbidity conditions on the Charlson index, the following eight conditions could be inferred from medication data: congestive heart failure, periph-eral vascular disease, cerebrovascular disease, dementia, chronic pulmonary disease, connective tissue disease and rheumatic disease, renal disease, and AIDS. Of the 26,113 inferred and/or documented cases of peripheral vascular disease, 74.3% (19,406 cases) were detected only
by inferring from medication data. With regard to other medical conditions, the percentage of cases inferred by medication data were as follows: congestive heart failure (41.5%), chronic pulmonary disease (39.0%), renal dis-ease (7.3%), cerebrovascular disdis-ease (5.6%), AIDS (3.8%), connective tissue disease/rheumatic disease (1.5%), and dementia (1.2%) (Table 2). Changes of Charlson index scores in original and enhanced models were statistically significant in all the 12 pairs (P< 0.01 in all the pairs, data not shown).
Table 1 Most responsible diagnoses which were account for 80% of in-hospital mortalities during study period
MRDx1 No. of death No. of admission Male (%) Mortality rate (%) Age, years (IQR2) LOS3, days (IQR2)
Liver cancer 3,657 56,433 78.4 6.5 60 (52-67) 6 (4-11)
Lung cancer 3,591 66,116 73.5 5.4 65 (57-71) 6 (4-11)
Stomach cancer 2,421 75,545 68.2 3.2 59 (50-68) 5 (3-11)
Sepsis 1,867 7,090 54.4 26.3 52 (1-72) 7 (4-15)
ICH4* 1,661 13,340 50.6 12.5 60 (49-70) 18 (8-30)
Pneumonia* 1,342 48,587 56.7 2.8 4 (1-63) 6 (5-9)
Leukemia 1,015 16,796 58.5 6.0 39 (13-58) 8 (3-24)
Pancreatic cancer 967 12,509 60.2 7.7 64 (55-70) 6 (2-13)
Other gastrointestinal cancer 937 13,863 52.3 6.8 64 (55-71) 7 (4-16)
Colon cancer 913 49,480 57.7 1.9 62 (53-69) 4 (3-7)
Ischemic infarct* 882 30,349 56.3 2.9 68 (58-75) 9 (6-15)
AMI5* 855 13,912 68.7 6.1 65 (54-73) 7 (5-9)
Non-alcoholic liver disease* 726 15,246 58.6 4.8 53 (44-65) 8 (4-14)
Intracranial injury* 620 9,676 69.5 6.4 53 (35-68) 10 (4-19)
Non-Hodgkin’s lymphoma 583 16,747 60.5 3.5 56 (43-67) 5 (2-11)
Rectal and anal cancer 581 34,853 63.2 1.7 61 (53-69) 5 (4-9)
Respiratory failure 571 2,317 60.0 24.6 64 (8-75) 9 (5-20)
Breast cancer 563 48,483 0.42 1.2 48 (42-56) 3 (2-8)
CRF6* 553 17,921 54.6 3.1 59 (47-69) 6 (4-16)
Intoxication 433 4,751 57.0 9.5 50 (37-65) 3 (2-7)
COPD7* 407 12,162 64.4 3.3 68 (56-76) 8 (5-12)
Gastrointestinal bleeding 406 15,039 72.1 2.7 58 (46-70) 6 (3-9)
Alcoholic liver disease* 401 7,983 88.0 5.0 51 (45-59) 8 (5-14)
Aspiration pneumonia* 398 2,573 68.7 15.5 72 (60-80) 14 (7-26)
CHF8* 394 7,892 40.0 5.0 74 (66-80) 8 (5-12)
Other lower respiratory disease 363 8,818 58.4 4.1 61 (50-71) 6 (3-10)
ARF9 344 3,406 55.2 10.1 67 (50-76) 9 (5-16)
Esophageal cancer 342 7,873 92.7 4.3 65 (58-70) 6 (3-13)
Head and neck cancer 297 11,669 80.1 2.6 59 (50-68) 6 (2-12)
Coronary atherosclersis* 287 68,071 59.2 0.4 63 (54-70) 3 (2-5)
Secondary malignacy 282 6,055 52.6 4.66 60 (50-75) 8 (4-16)
Cardiac arrest 278 766 64.8 36.3 59 (47-70) 7 (2-20)
Sum 28,937 706,321 59.7 4.1 60 (48–69) 5 (3-11)
1 Most responsible diagnoses, 2 Interquartile range, 3 Length of stay, 4 Intracranial hemorrhage, 5 Acute myocardial infarction, 6 Chronic renal failure, 7 Chronic obstructive pulmonary disease, 8 Congestive heart failure, 9 Acute renal failure.
Table 2 Additional Charlson index comorbidities inferred from drug prescribing information (N = 247,712)
Comorbidities Claim
data1(A) Prescribinginformation2(B) Claim datainformation∩3(APrescribing
∩B)
Fraction of additional comorbidities inferred by prescribing information {(A∪B)-A}/(A∪B)
Peripheral vascular disease 6,707 21,858 2,452 74.3%
Congestive heart failure 4,531 4,159 946 41.5%
Chronic pulmonary disease
30,656 36,129 16,517 39.0%
Renal disease 8,298 1,054 400 7.3%
Cerebrovascular disease 8,196 638 153 5.6%
AIDS 51 10 8 3.8%
Connective tissue disease/ rheumatic disease
2,727 114 72 1.5%
Dementia 3,811 261 216 1.2%
1 No. of cases of each Charlson index comorbidity identified from claim data, 2 No. of cases each Charlson index comorbidity inferred from drug prescribing information, 3 No. cases of each Charlson index comorbidity identified (or inferred) both claim data and drug prescribing information.
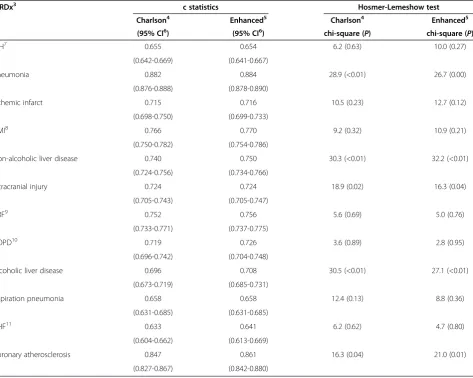
Table 3 Results of original Charlson models1and enhanced Charlson2models
MRDx3 c statistics Hosmer-Lemeshow test
Charlson4 Enhanced5 Charlson4 Enhanced5
(95% CI6) (95% CI6) chi-square (P) chi-square (P)
ICH7 0.655 0.654 6.2 (0.63) 10.0 (0.27)
(0.642-0.669) (0.641-0.667)
Pneumonia 0.882 0.884 28.9 (<0.01) 26.7 (0.00)
(0.876-0.888) (0.878-0.890)
Ischemic infarct 0.715 0.716 10.5 (0.23) 12.7 (0.12)
(0.698-0.750) (0.699-0.733)
AMI8 0.766 0.770 9.2 (0.32) 10.9 (0.21)
(0.750-0.782) (0.754-0.786)
Non-alcoholic liver disease 0.740 0.750 30.3 (<0.01) 32.2 (<0.01)
(0.724-0.756) (0.734-0.766)
Intracranial injury 0.724 0.724 18.9 (0.02) 16.3 (0.04)
(0.705-0.743) (0.705-0.747)
CRF9 0.752 0.756 5.6 (0.69) 5.0 (0.76)
(0.733-0.771) (0.737-0.775)
COPD10 0.719 0.726 3.6 (0.89) 2.8 (0.95)
(0.696-0.742) (0.704-0.748)
Alcoholic liver disease 0.696 0.708 30.5 (<0.01) 27.1 (<0.01)
(0.673-0.719) (0.685-0.731)
Aspiration pneumonia 0.658 0.658 12.4 (0.13) 8.8 (0.36)
(0.631-0.685) (0.631-0.685)
CHF11 0.633 0.641 6.2 (0.62) 4.7 (0.80)
(0.604-0.662) (0.613-0.669)
Coronary atherosclerosis 0.847 0.861 16.3 (0.04) 21.0 (0.01)
(0.827-0.867) (0.842-0.880)
Comparing the predictive power of the original Charlson model and the enhanced models using c-statistics, the enhanced models were slightly superior to the original in all but three MRDx categories (See Additional file 1: Tables S5-S28 to review the model coefficients). Im-provements of c-statistics, however, were relatively small and c-statistics of the enhanced models were within 95% confidence intervals of the original Charlson models (Table 3). The c-statistics of the original models ranged from 0.633 (congestive heart failure) to 0.882 (pneumonia) while those of the enhanced models ranged from 0.641 (congestive heart failure) to 0.884 (pneumonia). In models for intracranial injury and aspir-ation pneumonia, the c-statistics of the original and en-hanced models were equal. In intracranial hemorrhage, the c-statistic of the original model was slightly higher than that of the enhanced model (0.655 and 0.654, respectively).
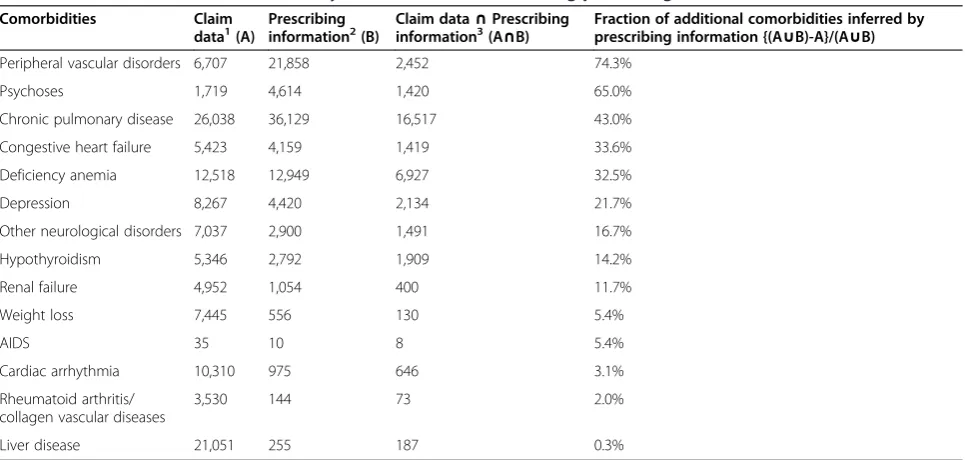
Elixhauser models and enhanced Elixhauser models After the author’s (JH Bang) review of the patients’ medi-cation data and HIRA’s prescriptions guidelines, 106 drugs were selected to infer missed comorbidities on the Elixhauser index in the claim data (Additional file 1: Table S4). Out of 31 comorbidity conditions on the Elixhauser index, the following fourteen conditions could be inferred from medication data: congestive heart failure, cardiac arrhythmia, peripheral vascular disorders, other neurological disorders, chronic pulmonary disease, hypothyroidism, renal failure, liver disease, AIDS, rheuma-toid arthritis and collagen vascular diseases, weight loss, deficiency anemia, psychoses, and depression. As with the
enhanced Charlson models, in the 26,113 inferred and/ or documented cases of peripheral vascular disease, large numbers of cases (19,406 cases, or 74.3%) were detected only by inferring from medication data. Per-ipheral vascular disease was followed by psychosis (65.0%), chronic pulmonary disease (43.0%), congestive heart failure (33.6%), deficiency anemia (32.5%), de-pression (21.7%), other neurological disorders (16.7%), hypothyroidism (14.2%), renal failure (11.7%), weight loss (5.4%), AIDS (5.4%), cardiac arrhythmia (3.1%), rheumatoid arthritis/collagen vascular diseases (2.0%), liver disease (0.3%) (Table 4).
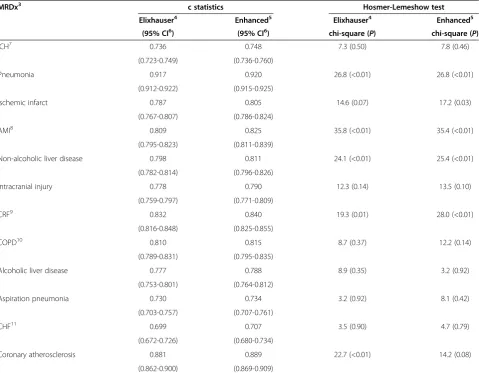
The c-statistics of the original Elixhauser model ranged from 0.699 (congestive heart failure) to 0.917 (pneumonia) while those of the enhanced models ranged from 0.707 (congestive heart failure) to 0.920 (pneumonia) (Table 5, see Additional file 1: Tables S29-S52 to review the model coefficients). Comparing the predictive power of the ori-ginal and enhanced Elixhauser models using c-statistics, the enhanced models were slightly superior to the original models in all MRDx categories, although once again im-provement of c-statistics was relatively small and majority of c-statistics of the enhanced models were within 95% confidence intervals of the original Elixhauser, except for acute myocardial infarction (Table 5).
Discussion
In this study, we showed that the predictability of comorbidity-adjusted models can be improved by the addition of missed comorbidities inferred from patients’ medication data.
Table 4 Additional Elixhauser comorbidity measures inferred from drug prescribing information (N = 247,712)
Comorbidities Claim
data1(A)
Prescribing information2(B)
Claim data∩Prescribing information3(A∩B)
Fraction of additional comorbidities inferred by prescribing information {(A∪B)-A}/(A∪B)
Peripheral vascular disorders 6,707 21,858 2,452 74.3%
Psychoses 1,719 4,614 1,420 65.0%
Chronic pulmonary disease 26,038 36,129 16,517 43.0%
Congestive heart failure 5,423 4,159 1,419 33.6%
Deficiency anemia 12,518 12,949 6,927 32.5%
Depression 8,267 4,420 2,134 21.7%
Other neurological disorders 7,037 2,900 1,491 16.7%
Hypothyroidism 5,346 2,792 1,909 14.2%
Renal failure 4,952 1,054 400 11.7%
Weight loss 7,445 556 130 5.4%
AIDS 35 10 8 5.4%
Cardiac arrhythmia 10,310 975 646 3.1%
Rheumatoid arthritis/ collagen vascular diseases
3,530 144 73 2.0%
Liver disease 21,051 255 187 0.3%
The Chronic Disease Score (CDS) has also attempted to use medication data to improve the predictive power of the comorbidity index. However, in the CDS, there is little consideration for drugs used to treat two or more diseases [26,27]. For example, epilepsy is considered as a comorbid condition in the CDS, yet many antiepileptic drugs are used to treat other conditions such as neuro-genic pain and mood disorders. Consequently, inaccur-ate inference of comorbid conditions can occur, which may negatively affect predictability in the CDS system. In this study, we used drugs that are used exclusively to treat one disease category. Thus, in our study, we elimi-nated inaccurate inferences of comorbid conditions caused by drugs that are used to treat two or more conditions.
Other researchers have also tried to combine diagnosis-based scores (ex. Charlson index) and pharmacy-diagnosis-based scores (ex. CDS-1 or CDS-2). These studies showed that
the predictabilities of combined models were generally better than those of models composed only of diagnosis-based scores [29,40,41]. Yet, in our opinion, these at-tempts at combined models had additional problems. First, these models created the potential for double count-ing and/or different countcount-ing of risk scores for cases with the same comorbidity. For example, if both patient A and patient B have rheumatoid arthritis (RA) and are pre-scribed gold salt to relieve RA, but the diagnosis of RA is missed only in the claim data of patient A, the risk scores of the two patients would be different even though they have the same comorbidity. In this example, the same pharmacy-based scores are assigned to both patient A and patient B because they take same medication, but the diagnosis-based score is assigned only to patient B. Sec-ond, by combining diagnosis-based scores and pharmacy-based scores, the number of independent variables (i.e.,
Table 5 Results of original Elixhauser models1and enhanced Elixhauser2models
MRDx3 c statistics Hosmer-Lemeshow test
Elixhauser4 Enhanced5 Elixhauser4 Enhanced5
(95% CI6) (95% CI6) chi-square (P) chi-square (P)
ICH7 0.736 0.748 7.3 (0.50) 7.8 (0.46)
(0.723-0.749) (0.736-0.760)
Pneumonia 0.917 0.920 26.8 (<0.01) 26.8 (<0.01)
(0.912-0.922) (0.915-0.925)
Ischemic infarct 0.787 0.805 14.6 (0.07) 17.2 (0.03)
(0.767-0.807) (0.786-0.824)
AMI8 0.809 0.825 35.8 (<0.01) 35.4 (<0.01)
(0.795-0.823) (0.811-0.839)
Non-alcoholic liver disease 0.798 0.811 24.1 (<0.01) 25.4 (<0.01)
(0.782-0.814) (0.796-0.826)
Intracranial injury 0.778 0.790 12.3 (0.14) 13.5 (0.10)
(0.759-0.797) (0.771-0.809)
CRF9 0.832 0.840 19.3 (0.01) 28.0 (<0.01)
(0.816-0.848) (0.825-0.855)
COPD10 0.810 0.815 8.7 (0.37) 12.2 (0.14)
(0.789-0.831) (0.795-0.835)
Alcoholic liver disease 0.777 0.788 8.9 (0.35) 3.2 (0.92)
(0.753-0.801) (0.764-0.812)
Aspiration pneumonia 0.730 0.734 3.2 (0.92) 8.1 (0.42)
(0.703-0.757) (0.707-0.761)
CHF11 0.699 0.707 3.5 (0.90) 4.7 (0.79)
(0.672-0.726) (0.680-0.734)
Coronary atherosclerosis 0.881 0.889 22.7 (<0.01) 14.2 (0.08)
(0.862-0.900) (0.869-0.909)
explanatory variables in a prediction model) inevitably in-creases. An increased number of independent variables may result in the instability of a prediction model, espe-cially when the number of study cases is relatively small.
In our study, we used the medication data only to infer missed comorbidities, and inferred comorbidities were directly included in comorbidity-adjusted models with-out increasing the number of independent variables. Consequently, our study is free from the above two problems.
To find missed comorbidities, we included only those drugs that are used to treat a single disease entity. One potential concern was that this method would result in an uneven distribution of additional comorbidities in-ferred from the medication data. For example, the ma-jority of patients with rheumatologic or connective tissue diseases have been prescribed immunosuppres-sants. Because such agents might be used to treat solid tumors or hematologic malignancies, we did not use im-munosuppressants to infer missed comorbidities. As a result, the number of drug-inferred comorbidities of rheumatologic or connective tissue diseases was rela-tively small (Tables 2 and 4). Therefore, it would be rea-sonable to suspect that the uneven detection of missed comorbidities might decrease the fitness of the models. However, our study showed that fitness, as shown by the Hosmer-Lemeshow Goodness-of-Fit tests, was similar between the original and enhanced Charlson models as well as between the original and enhanced Elixhauser models (Tables 3 and 5). Thus, we could affirm that un-even detection of missed comorbidities did not consti-tute an unacceptable problem.
Another remarkable finding of our study is that using medication data to infer missed comorbidities improved the predictabilities of Elixhauser models more than those of Charlson models. We believe that these differences were related to the respective characteristics of the Charlson and Elixhauser models. In the Charlson index, the sum of the weight of comorbidities is used to adjust the severity of comorbidities without consideration to the interaction of MRDx and the specific comorbidity [17]. In the Elixhauser index, however, interaction be-tween MRDx and each comorbidity is considered [18]. As a result, inferred comorbidities might increase the predictabilities of Elixhauser models more than those of Charlson models.
Another important consideration is that although we used the DRG screening method to differentiate between drug-inferred diagnoses that were POA and those that were non-POA, it is possible that POA conditions de-fined by DRG screening method could truly be non-POA conditions. However, in our study, the majority of drug-inferred comorbidities were chronic conditions that were not thought to develop after hospitalization
(Tables 2 and 4). Thus, we thought that most of the drug-inferred comorbidities were developed before or at the time of hospitalization.
Our study has some limitation: first, we excluded can-cer cases and cases diagnosed to have a wide range of clinical spectrums which occupied major portion of in-hospital mortalities, thus further studies are warranted to generalize the findings of our study; second, improve-ment of c-statistics in enhanced models was relatively small and most of c-statistics of enhanced models were within 95% confidence intervals of original models, thus to confirm the results of our study, additional studies should be followed.
Conclusion
In conclusion, predictabilities of comorbidity-adjusted models might be improved by the use of medication data to infer missed comorbidities.
Additional file
Additional file 1:Detailed information and model coefficients.
Competing interests
The authors declare that they have no competing interests.
Authors’contributions
JHB: The main researcher, has analyzed the data and written the manuscript. SHH has processed the raw data. EJL has reviewed previous studies and related researches YK has designed framework of the study and supervised the entire study. All authors read and approved the final manuscript.
Acknowledgements
This study was accomplished by financial support of the Health Insurance Review and Assessment Service of Korea (HIRA). Original data were provided by the HIRA (Registered No.: 0411-20090054).
Author details
1Department of Health Policy and Management, Seoul National University College of Medicine, 103 Daehak-ro, Jongno-gu, Seoul 110-799, Korea. 2Division of Infectious Diseases, Seoul National University - Seoul Metropolitan Government Boramae Medical Center, Seoul, Korea.3Current address: Health Insurance Review and Assessment Service, Seoul, Korea. 4
Current address: Department of Health Informatics and Management, Chungbuk National University College of Medicine, Cheongju, Korea. 5
Institute of Health Policy and Management, Medical Research Center, Seoul National University, Seoul, Korea.
Received: 23 September 2012 Accepted: 18 November 2013 Published: 20 November 2013
References
1. Hannan EL, Kilburn H Jr, Lindsey ML, Lewis R:Clinical versus administrative data bases for CABG surgery: does it matter?Med Care1992,30:892–907. 2. Luft HS, Romano PS:Chance, continuity, and change in hospital mortality rates: coronary artery bypass graft patients in California hospitals, 1983 to 1989.JAMA1993,270:331–337.
3. Naylor CD, Chen E:Population-wide mortality trends among patients hospitalized for acute myocardial infarction: the Ontario experience, 1981 to 1991.J Am Coll Cardiol1994,24:1431–1438.
5. Ghali WA, Hall RE, Ash AS, Rosen AK, Moskowitz MA:Evaluation of complication rates after coronary artery bypass surgery using administrative data.Methods Inf Med1998,37:192–200.
6. Librero J, Peiro S, Ordinana R:Chronic comorbidity and outcomes of hospital care: length of stay, mortality, and readmission at 30 and 365 days.J Clin Epidemiol1999,52:171–179.
7. Lenert LA, Linde-Zwirble W, Newbold R III, Korenblat BM, Doherty J, Smith ME:Using administrative data to compare the relative effective-ness of amlodipine vs nifedipine CC.Am J Manag Care1999,5:1535–1540. 8. Valenstein M, Ritsema T, Green L, Blow FC, Mitchinson A, McCarthy JF,
Barry KL, Hill E:Targeting quality improvement activities for depression: implications of using administrative data.J Fam Pract2000,49:721–728. 9. Tai D, Dick P, To T, Wright JG:Development of pediatric comorbidity
prediction model.Arch Pediatr Adolesc Med2006,160:293–299. 10. Schatz M, Nakahiro R, Crawford W, Mendoza G, Mosen D, Stibolt TB:
Asthma quality-of-care markers using administrative data.Chest2005, 128:1968–1973.
11. Carney CP, Jones L, Woolson RF:Medical comorbidity in women and men with schizophrenia: a population-based controlled study.J Gen Intern Med2006,21:1133–1137.
12. Fulton-Kehoe D, Gluck J, Wu R, Mootz R, Wickizer TM, Franklin GM: Measuring work disability: what can administrative data tell us about patient outcomes?J Occup Environ Med2007,49:651–658.
13. Stukenborg GJ, Wagner DP, Harrell FE Jr, Oliver MN, Heim SW, Price AL, Han CK, Wolf AM, Connors AF Jr:Present-at-admission diagnoses improved mortality risk adjustment among acute myocardial infarction patients.
J Clin Epidemiol2007,60:142–154.
14. Tam V, Frost SA, Hillman KM, Salamonson Y:Using administrative data to develop a nomogram for individualising risk of unplanned admission to intensive care.Resuscitation2008,79:241–248.
15. Ting G, Schneeweiss S, Scranton R, Katz JN, Weinblatt ME, Young M, Avorn J, Solomon DH:Development of a health care utilisation data-based index for rheumatoid arthritis severity: a preliminary study.
Arthritis Res Ther2008,10:R95.
16. Di Bari M, Balzi D, Roberts AT, Barchielli A, Fumagalli S, Ungar A, Bandinelli S, De Alfieri W, Gabbani L, Marchionni N:Prognostic stratification of older persons based on simple administrative data: development and validation of the“Silver Code,”to be used in emergency department triage.J Gerontol A Biol Sci Med Sci2010,65:159–164.
17. Charlson ME, Pompei P, Ales KL, MacKenzie CR:A new method of classifying prognostic comorbidity in longitudinal studies: development and validation.J Chronic Dis1987,40:373–383.
18. Elixhauser A, Steiner C, Harris DR, Coffey RM:Comorbidity measures for use with administrative data.Med Care1998,36:8–27.
19. Quan H, Parsons GA, Ghali WA:Validity of information on comorbidity derived rom ICD-9-CCM administrative data.Med Care2002,40:675–685. 20. Humphries KH, Rankin JM, Carere RG, Buller CE, Kiely FM, Spinelli JJ:
Co-morbidity data in outcomes research: are clinical data derived from administrative databases a reliable alternative to chart review?J Clin Epidemiol2000,53:343–349.
21. Deyo RA, Cherkin DC, Ciol MA:Adapting a clinical comorbidity index for use with ICD-9-CM administrative databases.J Clin Epidemiol1992, 45:613–619.
22. D’Hoore W, Sicotte C, Tilquin C:Risk adjustment in outcome assessment: the Charlson comorbidity index.Methods Inf Med1993,32:382–387. 23. D’Hoore W, Bouckaert A, Tilquin C:Practical considerations on the use of
the Charlson comorbidity index with administrative data bases.J Clin Epidemiol1996,49:1429–1433.
24. Romano PS, Roos LL, Jollis JG:Adapting a clinical comorbidity index for use with ICD-9-CM administrative data: differing perspectives.J Clin Epidemiol1993,46:1075–1079. discussion 1081-1090.
25. Ghali WA, Hall RE, Rosen AK, Ash AS, Moskowitz MA:Searching for an improved clinical comorbidity index for use with ICD-9-CM administra-tive data.J Clin Epidemiol1996,49:273–278.
26. Von Korff M, Wagner EH, Saunders K:A chronic disease score from automated pharmacy data.J Clin Epidemiol1992,45:197–203. 27. Clark DO, Von Korff M, Saunders K, Baluch WM, Simon GE:A chronic disease
score with empirically derived weights.Med Care1995,33:783–795. 28. Schneeweiss S, Maclure M:Use of comorbidity scores for control of
confounding in studies using administrative databases.Int J Epidemiol
2000,29:891–898.
29. Schneeweiss S, Seeger JD, Maclure M, Wang PS, Avorn J, Glynn RJ: Performance of comorbidity scores to control for confounding in epidemiologic studies using claims data.Am J Epidemiol2001,154:854–864. 30. Clinical Classifications Software for ICD-10 Data.http://www.ahrq.gov/
research/data/hcup/icd10usrgd.html#download.
31. CIHI:Technical Notes: Hospital Standardized Mortality Ratio (HSMR).In
Book Technical Notes: Hospital Standardized Mortality Ratio (HSMR).City: Canadian: Institute for health information; 2012.
32. Aylin P, Bottle A, Jen MH, Meddleton S:Technical document: HSMR mortality indicators.InBook Technical document: HSMR mortality indicators.
London: Dr Foster Intelligence; 2010.
33. Jarman B, Pieter D, van der Veen AA, Kool RB, Aylin P, Bottle A, Westert GP, Jones S:The hospital standardised mortality ratio: a powerful tool for Dutch hospitals to assess their quality of care?Qual Saf Health Care2010, 19:9–13.
34. Stukenborg GJ, Wagner DP, Connors AF Jr:Comparison of the performance of two comorbidity measures, with and without information from prior hospitalizations.Med Care2001,39:727–739. 35. Southern DA, Quan H, Ghali WA:Comparison of the Elixhauser and
Charlson/Deyo methods of comorbidity measurement in administrative data.Med Care2004,42:355–360.
36. Dominick KL, Dudley TK, Coffman CJ, Bosworth HB:Comparison of three comorbidity measures for predicting health service use in patients with osteoarthritis.Arthritis Rheum2005,53:666–672.
37. Kurichi JE, Stineman MG, Kwong PL, Bates BE, Reker DM:Assessing and using comorbidity measures in elderly veterans with lower extremity amputations.Gerontology2007,53:255–259.
38. Quan H, Sundararajan V, Halfon P, Fong A, Burnand B, Luthi JC, Saunders LD, Beck CA, Feasby TE, Ghali WA:Coding algorithms for defining comorbidities in ICD-9-CM and ICD-10 administrative data.Med Care
2005,43:1130–1139.
39. Drug reimbursement information of the Korean Health Insurance.http://www. hira.or.kr/dummy.do?pgmid=HIRAA030009000000.
40. Parker JP, McCombs JS, Graddy EA:Can pharmacy data improve prediction of hospital outcomes? Comparisons with a diagnosis-based comorbidity measure.Med Care2003,41:407–419.
41. Gilmer T, Kronick R, Fishman P, Ganiats TG:The Medicaid Rx model: pharmacy-based risk adjustment for public programs.Med Care2001, 39:1188–1202.
doi:10.1186/1472-6947-13-128
Cite this article as:Banget al.:The predictability of claim-data-based comorbidity-adjusted models could be improved by using medication data.BMC Medical Informatics and Decision Making201313:128.
Submit your next manuscript to BioMed Central and take full advantage of:
• Convenient online submission
• Thorough peer review
• No space constraints or color figure charges
• Immediate publication on acceptance
• Inclusion in PubMed, CAS, Scopus and Google Scholar
• Research which is freely available for redistribution