www.ocean-sci.net/3/1/2007/
© Author(s) 2007. This work is licensed under a Creative Commons License.
Ocean Science
A nested circulation model for the North Aegean Sea
V. Kourafalou1,2and K. Tsiaras1
1Hellenic Center for Marine Research, Anavyssos, Greece
2Rosenstiel School of Marine and Atmospheric Science, Univ. of Miami, Miami, Fl, USA
Received: 3 April 2006 – Published in Ocean Sci. Discuss.: 30 May 2006
Revised: 6 October 2006 – Accepted: 15 December 2006 – Published: 24 January 2007
Abstract. A multi-nested approach has been employed for
numerical simulations in the northern part of the Aegean Sea in the framework of the MFSTEP (Mediterranean Forecast System: Toward Environmental Predictions) project. The high resolution (∼1.6 km) hydrodynamic model of the North Aegean Sea (NAS) has been nested within a coarser model of the Eastern Mediterranean (resolution∼3.6 km) which is also nested within a basin scale model for the Mediterranean Sea (resolution of∼7 km). The high resolution of the NAS model allows the representation of topographic details that have never been reproduced in modelling studies of the re-gion. Such details can enhance the simulation of coastal fea-tures, but can also influence basin-scale processes, such as the pathways of waters of Black Sea origin inflowing at the Dardanelles Straits and bifurcating through island passages.
We employ comparisons of the North Aegean and Eastern Mediterranean models in terms of computed flow fields and distribution of hydrodynamic properties, to evaluate the nest-ing procedure, the initialization requirements and the ability of a nested model to perform reliable short term simulations that employ high resolution atmospheric forcing, when ini-tialized from a coarser OGCM.
We show that the topographic details of the high resolu-tion, nested NAS model affect the distribution of the Dard-anelles plume and the evolution of coastal currents, while the imposed high frequency, high resolution atmospheric forcing allows for the formation of an overall energetic flow field af-ter a few days of spin-up period. Increased resolution and smaller coastal depth in the NAS simulations influence the flow through island passages and straits. A longer initializa-tion procedure results in the establishment of stronger cur-rents and better-developed buoyant plumes.
Correspondence to: V. Kourafalou
1 Introduction
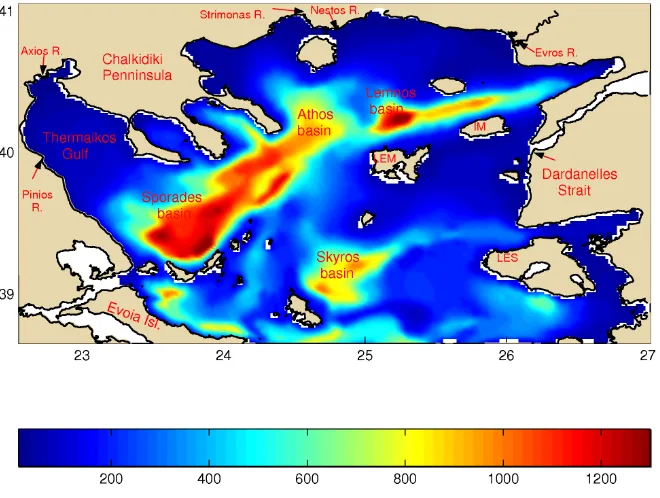
The physical setting of the North Aegean Sea is unique, mainly due to the complex topography of islands, straits, peninsulas and a combination of very shallow and very deep regions. The North Aegean Trough consists of an extended deep area that forms around three major depressions (max-imum depth near 1300 m): the Sporades basin, the Athos basin and the Lemnos basin (Fig. 1). The deep basins sep-arate shelf areas of the Northern Aegean from the generally deeper central basin interior. Examples are the shelf areas to the east and west of the Chalkidiki peninsula, where a number of rivers contribute to the development of coastal currents, which are also triggered by wind forcing. Larger than all the North Aegean rivers combined, is the buoyant in-flow of waters of Black Sea origin through the Dardanelles Strait. The development and evolution of the Dardanelles plume is influenced by the presence of neighboring islands and the shallow Lemnos plateau, between the Lemnos and Imroz islands. Other topographic depressions include the Skyros basin and a small area south of the Lesvos island.
Fig. 1. The bathymetry of the North Aegean Sea (NAS) model, sub-basins and rivers. LES: Lesvos island; LEM: Lemnos island; IM: Imroz
island.
This study is an extension of the model development and numerical simulations of the North Aegean circulation that took place during the Mediterranean Forecast System Pilot Project (MFSPP; Pinardi et al., 2003). The North Aegean model that was developed in the framework of MF-SPP (Kourafalou and Barbopoulos, 2003) had a horizontal resolution of∼3 km and was nested within the Aegean and Levantine Eddy Resolving Model (ALERMO) of a resolu-tion of∼5.5 km (Korres and Lascaratos, 2003) that was also nested in a basin-wide Mediterranean OGCM of∼10 km res-olution (Demirov and Pinardi, 2002). In MFSTEP, the same downscaling approach was employed in several areas of the Mediterranean Sea, including the Northern Aegean. The new North Aegean model domain remained the same (north of
∼38.5◦N, see Fig. 1), but horizontal resolution was doubled (∼1.6 km), following grid spacing decreases in ALERMO (∼3.6 km) and the Mediterranean OGCM (∼7 km). The scope of the North Aegean model simulations during MF-SPP was the study of the seasonal variability; consequently, climatological atmospheric forcing was employed. The fo-cus of the present study is on short term simulations with high frequency, high resolution atmospheric forcing that are initialized as a double nest on a longer running OGCM. The objective is to develop a nesting procedure that is suitable for the North Aegean, evaluate the initialization method and examine the effects of higher resolution on the simulated cir-culation fields.
The study motivation is linked to the longer term goal of pre-operational simulations with the North Aegean Sea
(NAS) model. We recognize that prior to attempting ocean forecasts, a series of experiments are necessary to avoid er-rors associated with the numerical procedure. In this context, we follow certain aspects of the methodology introduced by Atlas (1997) for the so-called OSSE’s (Observing System Simulation Experiments), which employ nested numerical simulations to evaluate observational needs for forecast im-provements. We consider the larger-scale ALERMO model (nested in the longer running OGCM) as our “nature run”, giving an adequate representation of the basic circulation features that govern the Northern Aegean circulation. Our task is then to examine if the nested NAS model can success-fully reproduce the features present in the outer model during short-term simulations. Complimentary tasks involve how the initialization procedure and differences in model set-up (such as resolution and topography) might modify the larger scale fields and possibly introduce additional circulation fea-tures, not present in the outer model. Our current experi-ments are only the first steps toward OSSE type simulations that will help design an integrated system of observations and data assimilative forecasts in the North Aegean.
2 Model description
2.1 Model set-up
(POM, Blumberg and Mellor, 1983) which is a three-dimensional, sigma-coordinate, free surface and primitive equation model. POM is a widely spread community model that has been used in numerous basin-scale, regional and coastal applications (details at http://www.aos.princeton.edu/ WWWPUBLIC/htdocs.pom/). The vertical eddy viscosity / diffusivity coefficients are evaluated according to the Mellor-Yamada 2.5 turbulence closure scheme (Mellor and Mellor-Yamada, 1982) while the calculation of horizontal diffusion is based on Smagorinsky (1963). The model domain (Fig. 1) lies be-tween 22.53◦E and 27◦E and between 38.63◦and 41.03◦N. Horizontal resolution is approximately 1/60◦ (DX∼1.4 km, DY∼1.8 km) while up to 25 sigma-levels are resolved in the vertical, with logarithmic distribution approaching the sur-face. The U.S Navy Digital Bathymetric Data Base (DBDB1, 1/60◦×1/60◦)is used to build the model bathymetry with
bi-linear interpolation into the model grid; this is the best avail-able bathymetry that covers the model domain. The mini-mum coastal depth (Hmin) is set at 10 m; this is almost a third of the ALERMO Hmin of 26 m.
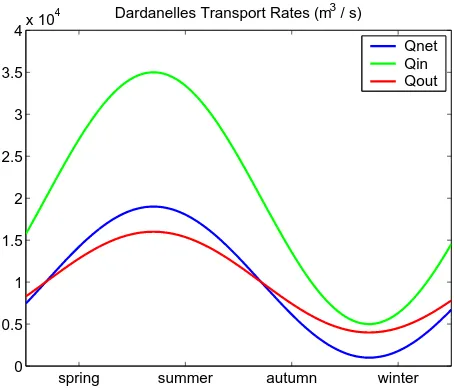
Particular care has been given to the parameterization of riverine and Black Sea inputs. River inflows are modelled as source terms in the continuity equation, based on the plume dynamics study of Kourafalou et al. (1996). This param-eterization allows for the development of buoyancy driven circulation that is mainly controlled by the amount of dis-charge and the interaction with wind stress and topography. All major North Aegean rivers (Evros, Axios, Aliakmonas, Pinios, Strimonas and Nestos) are represented (as 2–6 point sources) in the model. River runoff is set to constant val-ues (same as in Kourafalou and Barbopoulos, 2003), based on climatological annual means (Therianos, 1974); higher frequency discharge values were not available. The Ther-maikos Gulf (Fig. 1) river discharges have been modified as seasonal means according to measurements obtained during the METRO-MED project (Kourafalou et al., 2004). The fresh water is assumed of having zero salinity and season-ally varying temperature (the value for January is 10.5◦C). A parameterization different than the imposed net inflow in Kourafalou and Barbopoulos (2003) was adopted for the Dar-danelles water exchange regime. The new scheme employs inflow of Black Sea Water (BSW) and outflow of Aegean water i.e., a two layer (inflow-outflow) open boundary con-dition with prescribed transport rates and BSW salinity (Nit-tis et al., 2006). In the present study the inflow and outflow transport rates follow a seasonal cycle with maximum values during July (Fig. 2) while BSW salinity is assumed constant (28.3 psu). The depth of the upper layer is assumed to be half of the total water column depth (∼25 m). A uniform velocity is calculated for the two layers according to the prescribed inflow/outflow transports. The same scheme was adopted by the ALERMO model.
spring summer autumn winter 0
0.5 1 1.5 2 2.5 3 3.5
4x 10
4 Dardanelles Transport Rates (m3 / s)
Qnet Qin Qout
Fig. 2. The annual distribution of Dardanelles inflow (Qin), outflow
(Qout) and net flux (Qnet), as prescribed for the NAS and ALERMO models.
2.2 Nesting procedure
The Northern Aegean Sea (NAS) model has an open boundary to the south where it is nested to the coarser (1/30◦ by 1/30◦)intermediate model (MFSTEP-ALERMO,
based on the POM code, http://www.oc.phys.uoa.gr/mfstep/ ALERMO MFSTEP DETAILS.htm, Sofianos et al., 2006). The intermediate model is at its turn nested to the Mediterranean-wide MFSTEP-OGCM model (http://www. bo.ingv.it/mfstep/, 1/16◦ by 1/16◦ based on the OPA code, http://www.lodyc.jussieu.fr/opa/). The nesting-approach is one-way, i.e., each coarse model influences the solution within the immediate finer one, without any feedback.
The coupling procedure between the NAS and ALERMO models takes into account bathymetry fitting along the nest-ing boundary and employs the specification of flows and wa-ter properties. The NAS model grid and bathymetry along the open boundary are fitted to those of ALERMO in order to minimize interpolation errors for the open boundary in-put variables. The location of the nested boundary was care-fully chosen to minimize bathymetric discrepancies between the two models (no islands or straits are present along the boundary). Daily average prognostic fields along the open boundary (total velocityU,V; barotropic velocityUa, Va,
temperatureT, salinityS, and surface elevationζ) are taken from the daily averaged ALERMO fields, which are bilin-early interpolated into the model grid and linbilin-early interpo-lated in time providing lateral input of Velocity (totalUc,Vc
and barotropicUac,Vac), Temperature (Tc), Salinity (Sc)and
free-surface elevation (ζc)along the open boundary at each
5/Jan 10/Jan 15/Jan 20/Jan 25/Jan 30Jan −20
0 20
m/s
Wind variability at point (26.10,39.99)
5/Jan 10/Jan 15/Jan 20/Jan 25/Jan 30Jan −20
0 20
m/s
Wind variability at point (25.17,38.95)
5/Jan 10/Jan 15/Jan 20/Jan 25/Jan 30Jan −20
0 20
m/s
Wind variability at point (22.85,40.11)
1 hour LAM Jan 2003
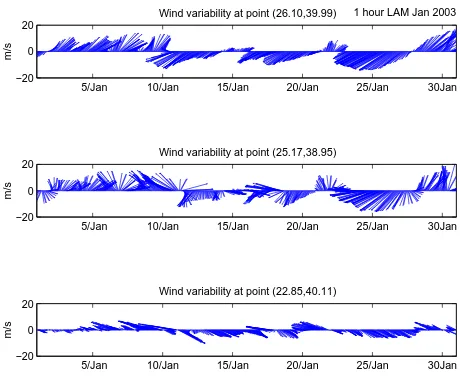
Fig. 3. Limited Area Model (LAM) atmospheric forcing time series
for January 2003 at 3 points of the NAS domain; near the Dard-anelles (upper); near the south NAS boundary (middle) and in the Thermaikos Gulf (bottom).
– An upstream advection scheme is used forT,S when the normal velocityV is directed outwards the model domain. WhenV is directed inwards,T andS are di-rectly prescribed by the ALERMO model.
∂T , S ∂t +V
∂T , S
∂y =0; V <0 (1)
(T , S)=(Tc, Sc); V >0 (2)
– The baroclinic velocities are exactly prescribed by
Alermo velocities:
(U, V )=(Uc, Vc) (3)
– The free-surface elevation is not nested (zero-gradient
boundary condition)
– The barotropic velocity normal to the south boundary is
computed according to a Flather type radiation condi-tion (Flather, 1976), while the tangential velocity is set equal to the Alermo velocity.
Va=Vac−
r
g
H(ζ−ζc) and Ua=Uac (4) wheregis the acceleration of gravity andH the water column depth.
A volume constraint is applied on velocities normal to the open boundary to ensure that the water flux across the open boundary is the same with the one predicted by ALERMO.
2.3 Initial conditions and forcing
The model forcing employs 1-hour atmospheric forecast fields at 1/10◦resolution, that were provided by the SKIRON (http://forecast.uoa.gr/) atmospheric Limited Area Model (LAM) which is based on a non-hydrostatic version of the ETA/NCEP model (http://www.emc.ncep.noaa.gov/). The asynchronous air-sea coupling is based on a well-tuned set of bulk formulae for the computation of momentum, heat and freshwater fluxes, taking the following atmospheric pa-rameters as input: wind velocity at 10 m; relative humidity at 2m; air temperature at 2 m; precipitation; net incoming short wave radiation; and incoming long wave radiation.
The net heat flux at the sea surface is given as the sum of radiative, sensible and evaporative components:
Q=Qr −Qe−Qh (5)
whereQis the net heat flux to the ocean,Qris the net
radia-tive gain received by the ocean,Qhis the sensible heat flux
andQeis the evaporative heat flux.
The radiative term Qr in Eq. (1) consists of three
com-ponents: the shortwave radiative gain received by the ocean Qrs, the upward infrared radiation flux emitted by the
oceanQiruand the downward atmospheric infrared radiation
reaching the sea surfaceQird:
Q=Qrs−Qiru+Qird (6)
The net shortwave radiative gain at the sea surfaceQrsis
pro-vided directly by the atmospheric model at 1-hour intervals. The downward infrared radiation flux termQirdis also
pro-vided directly by the atmospheric model at 1-hour intervals while the upward infrared radiation flux term is estimated by the ocean model itself using the Stefan-Boltzman law:
Qiru=ε.σ.Ts4 (7)
whereεis the ocean emissivity (as given by Bignami et al., 1995) and σ is the Stefan-Boltzman constant respectively andTs is the sea surface temperature (predicted by the ocean
model).
The evaporativeQe and sensibleQh heat flux terms are
calculated by the ocean model using the bulk aerodynamic formulae (Rosati and Miyakoda, 1988; Castellari et al., 1998):
Qe=ρALVCE
W
[eSAT(TS)−reSAT(TA)]
0.622 pA
(8)
Qh=ρAcpCH
W
(TS−TA) (9)
where the atmospheric data of wind speed W
(at 10-m
above sea surface), air temperatureTAand relative humidity r(at 2-m above sea surface) are provided by the atmospheric model at 1-hour intervals. The atmospheric saturation vapour pressureeSAT in Eq. (8) is computed through a polynomial
23 24 25 26 27 39
40 41
Wind Velocity(m/s)
Umax= 9.66(m/s) 5/1/2003 day average − LAM
(a)
23 24 25 26 27
39 40 41
Wind Velocity(m/s)
Umax= 13.88(m/s) 10/1/2003 day average − LAM
(b)
23 24 25 26 27
39 40 41
Wind Velocity(m/s)
Umax= 6.68(m/s) 15/1/2003 day average − LAM
(c)
23 24 25 26 27
39 40 41
Wind Velocity(m/s)
Umax= 10.15(m/s) 20/1/2003 day average − LAM
(d)
23 24 25 26 27
39 40 41
Wind Velocity(m/s)
Umax= 16.45(m/s) 25/1/2003 day average − LAM (e)
23 24 25 26 27
39 40 41
Wind Velocity(m/s)
Umax= 15.27(m/s) 30/1/2003 day average − LAM
(f)
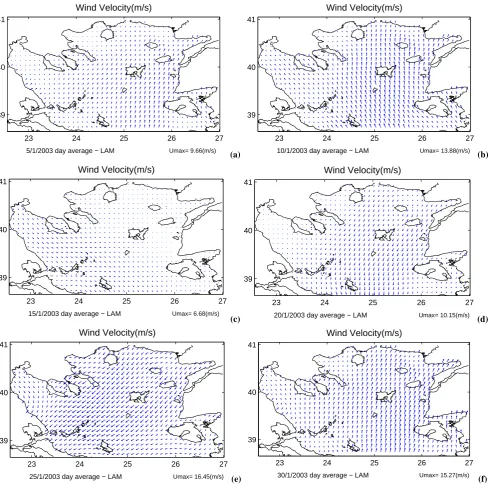
Fig. 4. Horizontal distribution of winds on January 2003 (5 day interval).
The specific heat capacity of aircpand the atmospheric
pres-sure at sea levelpAare considered as constants.
The sea surface temperatureTs is predicted by the
hydro-dynamic model itself; the density of moist airρAis computed
by the model as a function of air temperature and relative hu-midity; and the latent heat of vaporizationLV is calculated
as a function of sea surface temperature (Gill, 1982). The turbulent exchange coefficients CE and CH are
es-timated in terms of air-sea temperature difference and the
wind speed taking into account an atmospheric stability in-dex based on the Kondo parameterisation (Kondo, 1975).
The virtual salt flux (VSF) surface boundary condition due to evaporationEand precipitationP are given by
VSF=(E−P ).S (10)
1-hour intervals while the evaporation rate is calculated from the evaporative heat flux using
E= Qe
LV
(11) The calculation of the wind stress fields is based on the trans-formation of the 1-hour wind velocity data at 10 m above sea surface to x and y components of wind stress following the formula:
−→
τ =ρACD
W
− →
W (12)
whereρAis the density of moist air (computed by the ocean
model as a function of air temperature and relative humid-ity),W is the wind velocity andCD is the drag coefficient.
The drag coefficient is calculated as a function of the wind speed and the air-sea temperature difference through the polynomial approximation given by Hellerman and Rosen-stein (1983).
The initial conditions for Temperature, Salinity and Veloc-ity as well as daily averaged fields along the open boundary were provided by the ALERMO model that was integrated for the same period (initialized from the basin-wide MF-STEP Mediterranean OGCM) using the same atmospheric input fields.
3 Model simulations
The model simulations described below are the first steps to-ward the establishment of a nested modelling system for the north Aegean that can achieve pre-operational capabilities. The purpose is to test if the NAS nested model that covers shelf and coastal areas can perform reliable short term sim-ulations when initialized from the long running larger scale regional ALERMO model simulation that also provides the boundary conditions. In addition, high frequency and high resolution atmospheric forcing was employed to enhance cir-culation features. The limited amount of observational data available during the simulation period did not allow a de-tailed model validation, which was beyond the focus of the present study. No data assimilation techniques were em-ployed, either. We focused on experiments that examined the nesting and initialization procedures and the ability of the nested model to spin up from rest and achieve circulation features present on the long-running larger scale model (with additional details due to the higher grid resolution) after a short (one month) period. The NAS shelf model simulated fields were compared to the ALERMO fields (which were taken as the closest to the “truth”), in order to test the nesting procedure, the air-sea coupling and the response of the higher resolution shelf model to the detailed atmospheric forcing.
The simulation period covered January 2003; the hourly LAM atmospheric forcing is illustrated in Figs. 3 and 4. Al-though the simulation period was short, the forcing was char-acterized by strong variability in the wind fields, both in time
and space. As seen in Fig. 4, winds were strong, typical for the winter season, with the exception of the Northwestern basin of the Thermaikos Gulf, where they tend to be lighter (see also Fig. 3). The wind direction had an extended period of southerlies at the beginning, turning into periods of north-easterlies that alternated with brief calm periods; an episode of southwesterlies occurred toward the end.
We performed a series of sensitivity tests, using the ALERMO fields as our “truth”, i.e. an adequate represen-tation of the true state of our ocean system. We first at-tempted NAS runs that reproduce the basic oceanic features in ALERMO. We examined the impact of vertical resolution, boundary conditions and initial conditions. We evaluated ef-fects of increasing the vertical resolution from 16 to 25 verti-cal layers and employing the ALERMO velocityVinitin the
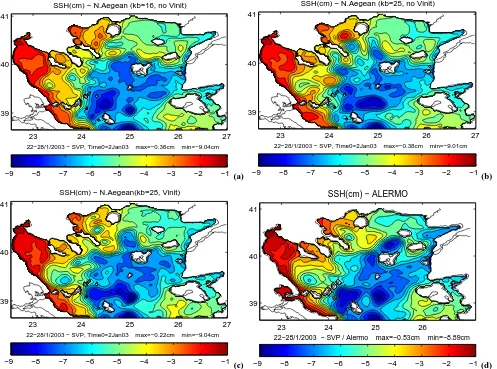
calculation of initial fields (in addition to theT andSfields). We present the weekly averaged Sea Surface Height fields at the end of the integration period for three different sim-ulations (Figs. 5a–c) and the corresponding ALERMO field (Fig. 5d). We also present the sea surface height difference between the two models in Fig. 6. In general, the nesting procedure performed well, as circulation patterns computed by ALERMO and by the NAS shelf model were compatible near the open boundary. Smaller scale features, developed in the shelf model, were absent in ALERMO, as expected, due to the higher shelf model resolution. We first focus on larger scale NAS features, which should appear more simi-lar to the “true” ALERMO fields. Figures 5a and c show the results from two different initialization procedures. Starting from some discrepancies between the two models when ver-tical resolution was lower and noVinit was included (Case
I, Fig. 5a), we achieved better agreement by increasing the number of vertical layers from 16 to 25 (Case II, Fig. 5b). Features that are closer to ALERMO in the Case II simu-lation include a strengthened cyclone in the Sporades basin and the formation of an eddy south of the Lesvos island. The circulation in the deep basins of the shelf model (not shown) also acquires greater similarity to ALERMO, which we attribute to the improvement in the middle and lower level circulation, due to the higher vertical resolution. When the ALERMO velocity fieldsVinit were not used (Figs. 5a,
−9 −8 −7 −6 −5 −4 −3 −2 −1
23 24 25 26 27
39 40 41
SSH(cm) − N.Aegean (kb=16, no Vinit)
max=−0.36cm min=−9.04cm 22−28/1/2003 − SVP, Time0=2Jan03
(a) −9 −8 −7 −6 −5 −4 −3 −2 −1
23 24 25 26 27
39 40 41
SSH(cm) − N.Aegean (kb=25, no Vinit)
max=−0.38cm min=−9.01cm 22−28/1/2003 − SVP, Time0=2Jan03
(b)
−9 −8 −7 −6 −5 −4 −3 −2 −1
23 24 25 26 27
39 40 41
SSH(cm) − N.Aegean(kb=25, Vinit)
max=−0.22cm min=−9.04cm 22−28/1/2003 − SVP, Time0=2Jan03
(c) −9 −8 −7 −6 −5 −4 −3 −2 −1
23 24 25 26
39 40 41
SSH(cm) − ALERMO
max=−0.53cm min=−8.89cm 22−28/1/2003 − SVP / Alermo
(d)
Fig. 5. Sea surface height weekly averaged for 22–28 January 2003 as simulated by (a) the N. Aegean model (kb=16, no Vinit); (b) the
N. Aegean model (kb=25, no Vinit: NAS Case II); (c) the N. Aegean model (kb=25, Vinit: NAS Case III); (d) the ALERMO model.
were minimized in the Sporades basin and reduced in a num-ber of other areas. However, disparities remained to the north and northeast of the Lemnos island, as this is the area mostly affected by the Dardanelles inflow where the salinity fields for the two models are most diverse, as we will discuss be-low.
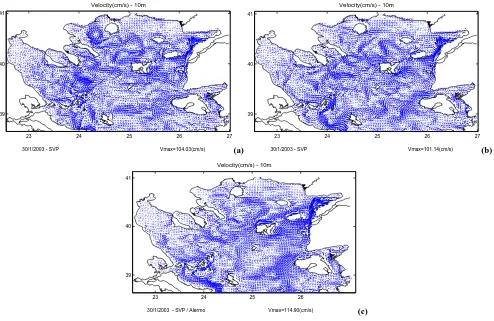
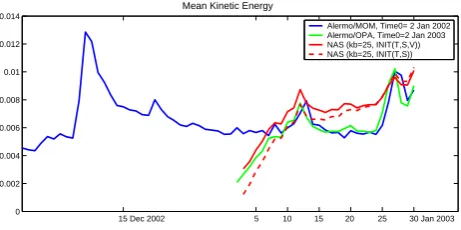
The use of the ALERMO velocity fields for initialization increased the overall eddy kinetic energy in the shelf model. This is largely due to the strengthening of the deep shelf cir-culation, which is influenced not only by the density gradi-ents, but also by the prevailing wind field and the local to-pography. Upper level features were also affected, as shown in Fig. 7 where the daily averaged velocity fields at 10 m are exhibited for the Case I, Case III and ALERMO simulations at the last day of integration (30 January 2003). The best qualitative agreement to ALERMO is for Case III, but both Case I and Case III exhibit overall more active eddy fields.
−3 −2 −1 0 1 2 3
23 24 25 26 27
39 40 41
SSH(NAS) − SSH(ALERMO) (cm) − (kb=25, no Vinit)
max=4.14cm min=−3.08cm 22−28/1/2003 − SVP, Time0=2Jan03
(a) −3 −2 −1 0 1 2 3
23 24 25 26 27
39 40 41
SSH(NAS) −SSH(ALERMO) (cm) − (kb=25, Vinit)
max=4.14cm min=−3.37cm 22−28/1/2003 − SVP, Time0=2Jan03
(b)
Fig. 6. Difference in the simulated sea surface height between the nested (a) NAS model case II (kb=25, no Vinit); (b) NAS model Case III
(kb=25, Vinit) and the outer ALERMO model: SSH(NAS)-SSH(ALERMO), averaged for 22–28 January.
23 24 25 26 27
39 40 41
Velocity(cm/s) - 10m
Vmax=104.03(cm/s)
30/1/2003 - SVP (a)
23 24 25 26 27
39 40 41
Velocity(cm/s) - 10m
Vmax=101.14(cm/s)
30/1/2003 - SVP (b)
23 24 25 26
39 40 41
Velocity(cm/s) - 10m
Vmax=114.90(cm/s)
30/1/2003 - SVP / Alermo (c)
Fig. 7. Velocity fields at 10m calculated from the (a) NAS Case II experiment, (b) the NAS Case III experiment and (c) the ALERMO,
several small eddies that are absent in the coarser ALERMO domain.
4 Discussion of results
We concentrate on the circulation patterns and the distribu-tion of water properties as calculated in the Case III NAS ex-periments, which we will call the “base NAS run”. We will employ the ALERMO results to identify differences in the computed fields between nested and outer models and under-stand what causes them. We will attempt a preliminary as-sessment of possible improvements in the simulations of the higher resolution NAS model versus the coarser ALERMO model. Limited observations were available during the sim-ulation period and are used for model comparisons.
The NAS model simulated surface temperature patterns are quite similar to the ALERMO patterns. As seen in the weekly averaged distribution in Fig. 9, somewhat lower tem-perature values (<0.8◦C difference) are found in the coastal
areas due to the lower NAS minimum coastal depth. As expected for winter, the temperature gradients are mainly North-South, rather than East-West as is common for sum-mer (Kourafalou and Barbopoulos, 2003). The model values in the Thermaikos Gulf northern and western coastal areas (which are influenced by the cooler than ambient riverine wa-ters) ranged from 10.5◦C to 11.5◦C, while the interior Ther-maikos temperatures reached 12◦C to 12.5◦C; these values are consistent with in-situ measurements in other years (see Fig. 5 in Kontoyiannis et al., 2003).
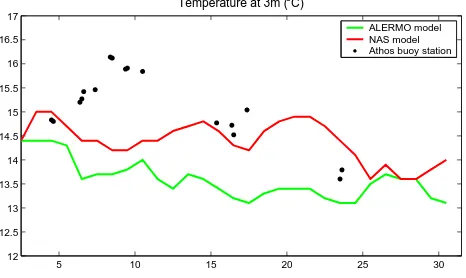
A preliminary validation of model computed temperature in deep areas was attempted by employing the only avail-able in-situ temperature data for the simulation period. As part of the POSEIDON system maintained by the Hellenic Center for Marine Research (Nittis et al., 2002; Nittis et al., 2006; http://www.poseidon.ncmr.gr/), buoy data were avail-able offshore the Athos peninsula (Fig. 9). We note that this is a very difficult position for comparison to model results, as it is found within the seasonal frontal area that separates warmer waters of South Aegean and Levantine basin ori-gin from the cooler North Aegean waters. However, a rea-sonable agreement between the NAS and buoy time series is observed in Fig. 10, with the exception of the warming event centered around the 9 January that can be attributed to a displacement of the frontal area. Interestingly, the NAS fields have an overall better agreement to the buoy data than the ALERMO fields. Further model validation with satellite derived (AVHRR) Sea Surface Temperature (weekly aver-aged SST maps of 1/8◦resolution, produced during MFSPP,
Buongiorno Nardelli et al., 2003) although encouraging, was not conclusive, due to certain limitations in the satellite SST derived fields for this period.
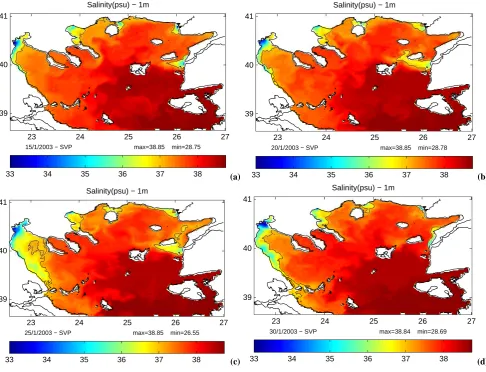
Salinity patterns of the NAS model (Fig. 11) are quite sim-ilar to the ALERMO fields, but with somewhat more pro-nounced coastal features, due to the enhanced coastal
15 Dec 2002 5 10 15 20 25 30 Jan 2003 0
0.002 0.004 0.006 0.008 0.01 0.012 0.014
Mean Kinetic Energy
Alermo/MOM, Time0= 2 Jan 2002 Alermo/OPA, Time0=2 Jan 2003 NAS (kb=25, INIT(T,S,V)) NAS (kb=25, INIT(T,S))
Fig. 8. Kinetic energy of the ALERMO (nested to the basin scale MOM model) Interannual simulation (blue line, start Time0=2/1/2002), the ALERMO (nested to the basin scale OPA model, start Time0=2/1/2003) January 2003 simulation (green line), the N. Aegean model with specified Vinit (red line; NAS Case III) and without (red dash line: NAS Case II).
rents. This is due to the lower coastal depths, the sharper slope near the coast (all factors influencing the wind-driven coastal current component) plus the inclusion of additional rivers (Evros, Pinios and Nestos that are absent in ALERMO, see Fig. 1), a factor that affects the buoyancy-driven compo-nent. The most pronounced changes were found in the path-ways of the waters of Black Sea origin (BSW), which form the Dardanelles buoyant plume. Even though the parame-terization of BSW inflow at the Dardanelles is the same, the inflow velocity field and consequently the simulated buoyant plume can vary, due to subtle topographic details, resulting from differences in resolution and minimum coastal depth.
8 9 10 11 12 13 14 15 16 17
23 24 25 26 27
39 40 41
Temperature (oC) − 1m
max=16.10 min=9.14 17−23/1/2003 − SVP
(a) 8 9 10 11 12 13 14 15 16 17
23 24 25 26
39 40 41
Temperature (oC) − 1m
max=16.14 min=9.99 17−23/1/2003 − SVP / Alermo
(b)
Fig. 9. Sea surface temperature weekly averaged for 17–23 January 2003 as simulated by (a) the N. Aegean model (NAS Case III) and (b)
as simulated by the ALERMO model; the “X” marks the Athos buoy station.
5 10 15 20 25 30
12 12.5 13 13.5 14 14.5 15 15.5 16 16.5 17
Temperature at 3m (oC)
ALERMO model NAS model Athos buoy station
Fig. 10. Near-surface temperature time series of daily averaged
val-ues for the simulation period: ALERMO (green line); NAS Case III (red line); Athos buoy measurements (black dots); see Fig. 9 for buoy location.
Dardanelles Straits by the end of the month (30/1, Fig. 11d), when winds have shifted to southerlies. On the same day, an intrusion of higher salinity Aegean waters is evident in the Thermaikos Gulf.
We sought to examine certain details of the circulation computed by the NAS model in specific areas of the North Aegean Sea. We chose the Sporades basin (Fig. 1), where a strong eddy was present and flows exiting the basin were influenced by certain island passages and straits that are char-acteristic of the complexity in the NAS topography.
Both ALERMO and NAS simulations exhibited a strong cyclone in the Sporades basin, as exhibited from the SSH fields in Fig. 5. The so-called “Sporades eddy” is a known feature in this area, predominantly cyclonic in winter with occasional shifts to anticyclonic rotation in other seasons
33 34 35 36 37 38
23 24 25 26 27
39 40 41
Salinity(psu) − 1m
max=38.85 min=28.75 15/1/2003 − SVP
(a) 33 34 35 36 37 38
23 24 25 26 27
39 40 41
Salinity(psu) − 1m
max=38.85 min=28.78 20/1/2003 − SVP
(b)
33 34 35 36 37 38
23 24 25 26 27
39 40 41
Salinity(psu) − 1m
max=38.85 min=26.55 25/1/2003 − SVP
(c) 33 34 35 36 37 38
23 24 25 26 27
39 40 41
Salinity(psu) − 1m
max=38.84 min=28.69 30/1/2003 − SVP
(d)
Fig. 11. Daily averaged, model simulated near surface salinity from the N. Aegean model (NAS Case III) on (a) 15/1/2003; (b) 20/1/2003; (c) 25/1/2003 and (d) 30/1/2003; the contour line marks the 37 isohaline.
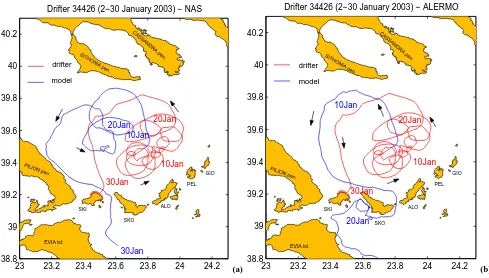
similar to the observed trajectory. The instrument seemed in-fluenced by a more energetic velocity field. Both model and observed trajectories were directed to the passage between the Skiathos and Skopelos islands; the observed drifter was stranded at the Skiathos coast. The average displacement speed was 11 km/day for the model, compared to 18 km/day for the data. The trajectory based on the ALERMO 10 m ve-locity field is shown in Fig. 12b. The prediction is inferior to the one from the NAS run, as no small scale eddies are indi-cated and the simulated drifter exit from the Sporades basin occurs further to the east, between the Skopelos and Alonis-sos islands.
We examine how the resolution of topography can influ-ence the modelled flows. We performed a twin experiment to the NAS base run, where we employed the same coastal depthHminas in ALERMO, i.e.Hmin=26 m (as compared to
Hmin=10 m for the base run). The model computed near
sur-face velocity fields from the two NAS simulations and the
corresponding ALERMO fields are shown as details of the full model field in Fig. 13 for the domain around the Spo-rades islands and in Fig. 14 for the domain around the Lem-nos plateau. The velocities are daily averaged for 30/1/2003 (Fig. 13), when the prevailing winds were from the south and for 25/1/2003 (Fig. 14), when the prevailing winds were from the north.
23 23.2 23.4 23.6 23.8 24 24.2 38.8
39 39.2 39.4 39.6 39.8 40 40.2
Drifter 34426 (2−30 January 2003) − NAS
10Jan 20Jan
30Jan
10Jan 20Jan
drifter
model
SITHONIA pen.
CASSANDRA pen.
PILION pen.
EVIA isl. SKI
SKO
ALO PEL
GIO
30Jan
(a) 23 23.2 23.4 23.6 23.8 24 24.2
38.8 39 39.2 39.4 39.6 39.8 40 40.2
SITHONIA pen.
CASSANDRA pen.
PILION pen.
EVIA isl. SKI
SKO ALO
PEL GIO
10Jan 20Jan
30Jan
10Jan
20Jan
drifter
model
Drifter 34426 (2−30 January 2003) − ALERMO
(b)
Fig. 12. (a) NAS Case III results; (b): ALERMO results. Comparison of model predicted (blue line) and observed (red line) trajectories at
10 m, which is the observed drifter drogue depth. The drifters followed a cyclonic eddy in the Sporades basin, to the north of the Sporades island arc. The 5 main Sporades islands are marked in the left panel: SKI (Skiathos); SKO (Skopelos): ALO (Alonissos); PEL (Pelagonissi, also called Kyra Panagia); GIO (Gioura).
ALERMO. This northward flow continues as a coastal cur-rent along the eastern edge of the Pilion peninsula in the NAS runs only. Differences in the flow between the Skiathos and Skopelos islands are also evident. The ALERMO run re-solves this passage only partially, due to coarser resolution, while a preferred pathway along the deeper part of the pas-sage, near the Skopelos island, is obvious in the ALERMO and NAS runs withHmin=26 m.
The Dardanelles inflow dominates the velocity fields in Fig. 14. The input is near the east part of the presented model detail. The low salinity waters from the Dardanelles fol-low a predominantly westward pathway, influenced by both buoyancy and the northerly wind stress, as was shown in the salinity field of Fig. 11c. The bifurcation of the Dard-anelles induced flow around the Imroz island is obvious in all three model simulations, but the branch south of Imroz is more pronounced in ALERMO, which does not resolve a secondary flow around the Tenedos island. Both resolution and minimum coastal depth seem to play a role in direct-ing the flow toward the eastern part of the passage between the Imroz and Lemnos islands in the ALERMO and NAS Hmin=26 m runs. This has a pronounced effect on the
down-stream flow, which is strongly deflected away from the north coast of the Lemnos island, as compared to the NAS base run.
Consequently, an anticyclonic eddy is observed near the tip of the Athos peninsula in the NAS base run, which is moved further north in the NASHmin=26 m run and is absent in the
ALERMO run.
23.5 24 38.75
39 39.25
30/1/2003 − SVP Vmax=50.3(cm/s) Velocity(cm/s) − 2m (NAS, Hmin=10m)
(a)
23.5 24
38.75 39 39.25
30/1/2003 − SVP Vmax=50.7(cm/s) Velocity(cm/s) − 2m (NAS, Hmin=26m)
(b)
23.5 24
38.75 39 39.25
30/1/2003 − SVP Vmax=60.2(cm/s) Velocity(cm/s) − 2m (ALERMO)
(c)
Fig. 13. Velocity at 2 m around the Sporades islands (see Fig. 12 for island names): (a) NAS Case III,Hmin=10 m; (b) NAS Case III, Hmin=26 m; (c) ALERMO,Hmin=26 m. Velocity fields are daily averaged for 30/1/2003; prevailing winds were from the south. The NAS
fields are plotted every other vector to have the same number of arrows as in the ALERMO plot.
(NAS) and regional (ALERMO) models in areas of high vari-ability as the Aegean Sea might not allow the full develop-ment of circulation features, a problem that does not appear to be overcome by employing high resolution atmospheric fields. This agrees with the findings of Natale et al. (2006) where short simulation periods of a high resolution nested model that were initialized by the coarser outer model did not allow the evolution of surface features that were devel-oped due to the nested model’s high resolution atmospheric forcing.
5 Concluding remarks
The modeling of the entire North Aegean in very fine reso-lution (averaging 1 min or∼1.6 km) and under atmospheric forcing that allows temporal and spatial details (1-hour
forc-ing from an atmospheric Limited Area Model of 1/10 degree or∼9.5 km resolution) has been performed for the first time, in the framework of the MFSTEP project.
vari-24.5 25 25.5 26 40
40.5
25/1/2003 − SVP Vmax=68.7(cm/s) Velocity(cm/s) − 2m (NAS, Hmin=10m)
LEM
IM TEN
(a)
24.5 25 25.5 26
40 40.5
25/1/2003 − SVP Vmax=65.5(cm/s) Velocity(cm/s) − 2m (NAS, Hmin=26m)
LEM
IM TEN
(b)
24.5 25 25.5 26
40 40.5
25/1/2003 − SVP Vmax=65.0(cm/s) Velocity(cm/s) − 2m (ALERMO)
LEM
IM TEN
(c)
Fig. 14. Velocity at 2 m around the Lemnos basin (LEM: Lemnos island, IM: Imroz island; TEN: Tenedos island): (a) NAS Case III,
Hmin=10 m; (b) NAS Case III,Hmin=26 m; (c) ALERMO,Hmin=26 m. Velocity fields are daily averaged for 25/1/2003; prevailing winds
were from the northeast. The NAS fields are plotted every other vector to have the same number of arrows as in the ALERMO plot.
ability in the wind field was also observed, especially for the Gulf of Thermaikos area (Northwest Aegean shelf), where winds were weaker and generally different in their east-west component, as compared to the rest of the domain.
Comparison to the limited observations available dur-ing the simulation period offers cautious encouragement on model skill; simulations over periods that have better data coverage are necessary for model evaluation. A forecast system for the North Aegean will benefit from time se-ries of measurements in island passages and straits. As a prelude to such a system, we focused on comparisons be-tween the nested NAS model predictions to those of the outer ALERMO model that was perceived as adequately rep-resenting the major circulation features. We evaluated ap-proaches in the nesting and initialization procedure to de-termine the preferred NAS basic run. The chosen Case III run has high vertical resolution and employs the velocities along with the T and S fields during the initialization pro-cedure. We also examined the effects of higher resolution and more detailed topography on the predicted circulation patterns. We showed that coastal currents and flows through island passages and straits are influenced by both the higher resolution and the more detailed coastal topography present in the nested model. A comparison of basin-wide energetics showed that the nested model exhibited an overall increased eddy field.
The short period of the experiment is representative of fu-ture pre-operational simulations and forecasts. An interest-ing findinterest-ing for the North Aegean, an area that incorporates both coastal and deep areas, is the need to employ the outer model velocity fields in the nesting procedure, rather than re-lying on the initial field, to allow the development of certain circulation features in the deep areas. This method was found to be equivalent with a longer spin-up period for the nested model which, however, is not practical in pre-operational simulations.
ex-pected in shorter time periods, due to episodic changes in wind forcing. Additional riverine sources and better reso-lution of shallow areas resulted in enhanced coastal currents in the NAS results, especially during northerly winds that en-hanced buoyancy-driven currents due to river discharges. For the Dardanelles plume, the NAS and the ALERMO models exhibited the strongest differences in salinity and velocity patterns. This was attributed to differences in topographic details near the Dardanelles, which, although small, influ-enced the transport rates and pathways of the buoyant wa-ters through the island passages; associated changes in down-stream flows (such as the eddy field in the Athos basin) were also observed. This is an important finding, as details in the initial distribution of the Dardanelles plume may influ-ence the pathways of this strongest lateral buoyant input for the North Aegean, with implications on the general circula-tion in the area and possibly influencing water properties in the entire Aegean Sea. The future development of a North Aegean model for forecast purposes requires details in river discharges and a parameterization of the Dardanelles flow exchange based on comprehensive direct measurements. In addition, data assimilation and model validation exercises are necessary steps and should be undertaken together with the development of a suitable observational framework, which is currently very limited.
Acknowledgements. The study was supported by the EU funded
MFSTEP project (contract EVK3-CT-2002-00075). The drifter data were obtained from a study funded by the U.S. Office of Naval Research (ONR grants N000140110134 and N000140310439), in collaboration with Don Olson and Bill Johns of the University of Miami. We thank Jean Carpenter for graphics assistance. We appreciate the fruitful working relationship with all colleagues in the modeling group of the MFSTEP project.
Edited by: D. Webb
References
Atlas, R.: Atmospheric observations and experiments to assess their usefulness in data assimilation, Journal of the Meteorological So-ciety of Japan, 75(1B), 111–130, 1997.
Balopoulos, E. T., Collins, M. B., and James, A. E.: Residual cir-culation in a coastal embayment of the Eastern Mediterranean Sea (Thermaikos Bay, N.W. Aegean), Thalassographica, 9, 7– 22, 1986.
Bignami, F., Marullo, S., Santoleri, R., and Schiano, M. E.: Long-wave radiation budget in the Mediterranean Sea, J. Geophys. Res., 100(C2), 2501–2514, 1995.
Blumberg, A. F. and Mellor, G. L.: Diagnostic and prognostic nu-merical circulation studies of the South Atlantic Bight, J. Geo-phys. Res., 88(C8), 4579–4592, 1983.
Castellari, S., Pinardi, N., and Leaman, K.: A model study of air-sea interactions in the Mediterranean Sea, J. Mar. Syst., 18, 89–114, 1998.
Demirov, E. and Pinardi, N.: Simulation of the Mediterranean Sea circulation from 1979 to 1993. Part I: The interannual variability, J. Mar. Syst., 33/34, 23–50, 2002.
Flather, R. A.: A tidal model of the northwest European continental shelf, Memoires Societe Royale des Sciences de Liege, Series 6(10), 141–164, 1976.
Gill., A. E. : Atmosphere-Ocean Dynamics, Academic Press, New York, 662 pp., 1982.
Hellermann, S. and Rosenstein, M.: Normal wind stress over the world ocean with error estimates, J. Phys. Oceanogr., 13, 1093– 1104, 1983.
Karageorgis, A. P., Kaberi, H. G., Tengberg, A., Zervakis, V., Hall, P. O. J., and Anagnostou, Ch. L.: Comparison of particulate mat-ter distribution, in relation to hydrography, in the mesotrophic Skagerrak and the oligotrophic northeastern Aegean Sea, Conti-nental Shelf Research, 23, 1787–1809, 2003.
Kondo, J.: Air-sea bulk transfer coefficients in diabatic conditions, Boundary-Layer Meteorol., 9, 91–112, 1975.
Kontoyiannis, H., Kourafalou, V. H., and Papadopoulos, V.: The seasonal characteristics of the hydrology and circulation in the Northwest Aegean Sea (Eastern Mediterranean): ob-servations and modeling, J. Geophys. Res., 108(C9), 3302, doi:10.1029/2001JC001132, 2003.
Korres, G. and Lascaratos, A.: A one-way nested eddy resolving model of the Aegean and Levantine basins: implementation and climatological runs, Ann. Geophys., 21, 205–220, 2003, http://www.ann-geophys.net/21/205/2003/.
Kourafalou, V. H., Oey, L.-Y., Wang, J. D., and Lee, T. N.: The fate of river discharge on the continental shelf. Part I: modelling the river plume and the inner-shelf coastal current, J. Geophys. Res., 101(C2), 3415–3434, 1996.
Kourafalou, V. H. and Barbopoulos, K.: High resolution simula-tions on the North Aegean Sea seasonal circulation, Ann. Geo-phys., 21, 251–265, 2003,
http://www.ann-geophys.net/21/251/2003/.
Kourafalou, V. H., Savvidis, Y. G., Koutitas, C. G., and Krestenitis, Y. N.: Modeling studies on the processes that influence matter transfer on the Gulf of Thermaikos (NW Aegean Sea), Continen-tal Shelf Research, 24, 203–222, 2004.
Lowe, P. R.: An approximating polynomial for the computation of saturation vapor pressure, J. Appl. Meteorol., 16, 100–103, 1977. Mellor, G. L. and Yamada, T.: Development of a turbulence clo-sure model for geophysical fluid problems, Rev. Geophys. Space Phys., 20(4), 851–875, 1982.
Bungiorno Nardelli, B., Larnicol, G., D’Acunzo, E., Santoleri, R., Marullo, S., and Le Traon, P.Y.: Near Real Time SLA and SST products during 2-years of MFS pilot project: processing, analy-sis of the variability and of the coupled patterns, Ann. Geophys., 21, 103–121, 2003,
http://www.ann-geophys.net/21/103/2003/.
Natale, S., Sorgente, R., Gabersek, S., Ribotti, A., and Olita, A.: Central Mediterranean Sea forecast: effects of high-resolution atmospheric forcings, Ocean Sci. Discuss., 3, 637–669, 2006, http://www.ocean-sci-discuss.net/3/637/2006/.
Nittis, K., Perivoliotis, L., Korres, G., Tziavos, C., and Thanos, I.: Operational monitoring and forecasting for marine environmen-tal applications in the Aegean Sea, Environmenenvironmen-tal Modelling and Software, 21, 243–257, 2006.
Olson, D. B., Kourafalou, V. H., Johns, W. H., Samuels, G., and Veneziani, M.: Aegean Surface Circulation from a Satellite-tracked Drifter Array, J. Phys. Oceanogr., in press, 2007. Pinardi, N., Allen, I., Demirov, E., De Mey, P., Korres, G.,
Las-caratos, A., Le Traon, P.-Y., Maillard, C., Manzella G., and Tzi-avos, C.: The Mediterranean Ocean Forecasting System: First phase of implementation (1998–2001), Ann. Geophys., 21, 3– 20, 2003,
http://www.ann-geophys.net/21/3/2003/.
Poulos, S. E., Drakopoulos, P. G., and Collins, M. B.: Seasonal vari-ability in sea surface oceanographic conditions in the Aegean Sea (Eastern Mediterranean): an overview, J. Mar. Syst., 13, 225– 244, 1997.
Rosati, A. and Miyakoda, K.: A general circulation model for upper ocean circulation, J. Phys. Oceanogr., 18, 1601–1626, 1988. Smagorinsky, J.: General circulation experiments with the primitive
equations, I. The basic experiment, Mon. Wea. Rev., 91, 99–164, 1963.
Sofianos, S. S., Skliris, N., Mantziafou, A., Lascaratos, A., Zodi-atis, G., Lardner, R., Hayes, D., and Georgiou, G.: Nesting oper-ational forecasting models in the Eastern Mediterranean: active and slave mode, Ocean Sci. Discuss., 3, 1225–1254, 2006, http://www.ocean-sci-discuss.net/3/1225/2006/.
Therianos, A. D.: Rainfall and geographical distribution of river runoff in Greece, Bull. Geol. Soc. Greece, XI, 28–58 (in Greek), 1974.
Thorpe, S. E., Heywood, K. J., Stevens, D. P., and Brandon, M. A.: Tracking passive drifters in a high resolution ocean model: implications for interannual variability of larval krill transport to South Georgia, Deep-Sea Res. I, 51, 909–920, 2004.
Zervakis, V., Georgopoulos, D., and Drakopoulos, P. G.: The role of the North Aegean in triggering the recent Eastern Meiterranean climate changes, J. Geophys. Res., 105, 26 103–26 116, 2000. Zervakis, V. and Georgopoulos, D.: Hydrology and Circulation
in the North Aegean (eastern Mediterranean) throughout 1997– 1998, Mediterranean Marine Science, 3, 1, 7–21, 2002. Zodiatis, G. and Balopoulos, E.: Structure and characteristics of
fronts in the North Aegean Sea, Boll. Oceanol. Theor. Appl., XI, 113–124, 1993.
Zodiatis, G.: Advection of the Black Sea water in the north Aegean Sea, Global Atmos. Ocean Syst., 2, 41–60, 1994.
Zodiatis, G., Alexandri, S., Pavlakis, P., J¨onnson, L., Kallos, G., Demetropoulos, A., Georgiou, G., Theodorou, A., and Balopou-los, E.: Tentative study of flow patterns in the North Aegean Sea using NOAA-AVHRR images and 2D model simulations, Ann. Geophys., 14, 1221–1231, 1996,
http://www.ann-geophys.net/14/1221/1996/.