www.solid-earth.net/6/903/2015/ doi:10.5194/se-6-903-2015
© Author(s) 2015. CC Attribution 3.0 License.
A Web-based spatial decision supporting system for land
management and soil conservation
F. Terribile1,2, A. Agrillo3, A. Bonfante3, G. Buscemi1, M. Colandrea4, A. D’Antonio5, R. De Mascellis3, C. De
Michele4, G. Langella3, P. Manna3, L. Marotta4, F. A. Mileti1, L. Minieri1, N. Orefice3, S. Valentini1, S. Vingiani1, and A. Basile3
1Department of Agriculture, University of Naples Federico II, Via Università 100, Portici (NA), Italy
2CRISP – Interdepartmental Research Center on the Earth Critical Zone, Via Università 100, Portici (NA), Italy 3CNR – ISAFoM, Via Patacca 85, 80056 Ercolano (NA), Italy
4Ariespace S.r.l., Centro Direzionale, Isola A3, 80143 Naples, Italy 5Campania region, Centro Direzionale Isola A6, 80143 Naples, Italy
Correspondence to: F. Terribile ([email protected])
Received: 20 January 2015 – Published in Solid Earth Discuss.: 12 February 2015 Revised: 29 June 2015 – Accepted: 2 July 2015 – Published: 28 July 2015
Abstract. Today it is evident that there are many contrasting
demands on our landscape (e.g. food security, more sustain-able agriculture, higher income in rural areas, etc.) as well as many land degradation problems.
It has been proved that providing operational answers to these demands and problems is extremely difficult.
Here we aim to demonstrate that a spatial decision support system based on geospatial cyberinfrastructure (GCI) can ad-dress all of the above, so producing a smart system for sup-porting decision making for agriculture, forestry, and urban planning with respect to the landscape.
In this paper, we discuss methods and results of a spe-cial kind of GCI architecture, one that is highly focused on land management and soil conservation. The system allows us to obtain dynamic, multidisciplinary, multiscale, and mul-tifunctional answers to agriculture, forestry, and urban plan-ning issues through the Web. The system has been applied to and tested in an area of about 20 000 ha in the south of Italy, within the framework of a European LIFE+project (SOIL-CONSWEB).
The paper reports – as a case study – results from two different applications dealing with agriculture (olive growth tool) and environmental protection (soil capability to protect groundwater).
Developed with the help of end users, the system is start-ing to be adopted by local communities. The system indi-rectly explores a change of paradigm for soil and landscape
scientists. Indeed, the potential benefit is shown of overcom-ing current disciplinary fragmentation over landscape issues by offering – through a smart Web-based system – truly inte-grated geospatial knowledge that may be directly and freely used by any end user (www.landconsultingweb.eu). This may help bridge the last very important divide between scientists working on the landscape and end users.
1 Introduction
1.1 The land management and soil conservation problem
Land management and soil conservation issues are closely connected to the complexity of our societies. It is evident today that many of the following contrasting pressures co-evolve upon our landscape: increasing pressure from the hu-man population, increasing dehu-mand for a better environment, increasing demand for more sustainable agriculture, increas-ing demand for food security, increasincreas-ing demand for higher income in rural areas, etc.
Moreover, many strategic high-level policy expectations recall these concepts, for instance by emphasizing the need to combine productivity with more sustainable landscape man-agement, such as in (i) FAO new Strategic Objectives, (ii) Horizon 2020, and (iii) the United Nations’ Sustainable De-velopment Goals.
However, this general agreement on the part of policy makers does not always correspond to tools being made available to render this policy goal feasible.
Indeed, there are many problems in making these concepts truly operational since providing an answer to all the above demands together with suitable landscape/farm planning and managing can be very complex. Some examples of these dif-ficulties are as follows:
i. difficulties of farmers, farmer associations, municipali-ties, province, regions or countries in dealing with the multifunctional role of soil and landscape;
ii. the need to provide answers to multi-user/multi-stakeholder communities;
iii. limitation of classic top-down approaches to carrying out soil and landscape management and the subse-quent high expectation in supposedly integrated gov-ernance approaches (including bottom-up contributions by a large spectrum of landscape users and stakehold-ers);
iv. cultural and technical problems due to the great com-plexity of many agricultural, forestry, and environmen-tal challenges (e.g. nitrate leaching);
v. technical problems regarding the lack of both suitable geospatial databases and technical/scientific support to render these databases useful for decision making, in-cluding also data quantity/quality variance in space, which leads to heterogeneous geodatabases that are dif-ficult to update;
vi. difficulties in quantifying the functions and ecosystem services of soils (e.g. food and other biomass produc-tion; storing, filtering, and transformaproduc-tion; habitat and gene pool; physical and cultural environment for hu-mankind; and source of raw materials);
vii. difficulties in quantifying soil threats (erosion, land-slides, floods, soil sealing, diminishing organic matter, etc.);
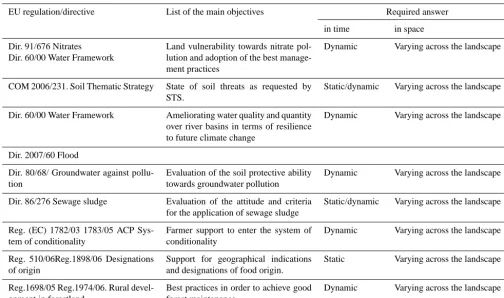
viii. last, but not least, many agriculture and environmen-tal issues require, as a “must”, dynamic answers which vary in time and space (over the landscape). This case is clearly shown in Table 1, which analyses soil and landscape policy requirements, such as those reported in some important EU regulations/directives, together with their dynamic requirements.
In real life, there is an additional problem. Scientific com-munities which are supposed to address and, eventually, solve many of the above problems are not always predis-posed to developing their work within an integrated opera-tional approach. Therefore we claim here that it is essential to do something different.
1.2 The spatial decision support approach to addressing the land management and soil conservation problem
We suggest that advanced “spatial decision support systems” (SDSSs) may be of great help in facing these problems. We also claim that well-diffused visualization tools – such as the standard Web-GIS system – are simply not able to address the above challenges well enough.
SDSSs already have their own short history (Geertmanand Stillwell, 2009), with successes but also many failures, often relating to the development of very complex systems which are both difficult to operate and difficult to modify. There-fore, it is important here to refer to some examples which appear to be best cases for SDSSs operating in the field of agriculture and environment.
In fact, SDSSs (or differently named but very similar sys-tems) have been developed for many different issues, includ-ing (i) accessinclud-ing forest resource data on a variety of scales (McInerney et al., 2012), (ii) a system for the sustainabil-ity of agriculture in a pilot study in Tanzania (Fegraus et al., 2012), (iii) Web service for exploring geospatial crop-land data in United States (Han et al., 2012), (iv) supporting fertilization for farmers in the northeast of China (Xie et al., 2012), (v) land use planning and local forestry development under different scenarios of the carbon credit market (Wang et al., 2010), (vi) scheduling deficit irrigation by using the CropSyst model (Marsaland Stockle, 2012), (vii) simulating stream water quality conditions (nitrate and phosphorous) in different scenarios (Booth et al., 2011), and (viii) regional risk assessment (including socioeconomic data) for contami-nated sites (Agostini et al., 2012).
It is also very important that there are some cases where SDSSs have been produced by incorporating scalable ap-proaches (Stewart and Purucker, 2011; McInerney et al., 2012) and an integrated crop and soil database system (Y. Yang et al., 2011) to enable efficient modelling and the use of multicriteria SDSS analysis (Agostini et al., 2012; Bottero et al., 2013). In other cases, DSS-integrated sys-tems have been developed to assess climate change over land use (Wenkel et al., 2013), but these are not as yet operational for the Web.
In SDSSs, the Web interactive thematic cartography method for public participation is more often found in urban planning (Zeng et al., 2013).
Table 1. Some important EU regulations concerning the management of agricultural/forestry and environmental issues. Abbreviations: Dir.
– Directive; Reg. – Regulation; COM – communication.
EU regulation/directive List of the main objectives Required answer
in time in space
Dir. 91/676 Nitrates Dir. 60/00 Water Framework
Land vulnerability towards nitrate pol-lution and adoption of the best manage-ment practices
Dynamic Varying across the landscape
COM 2006/231. Soil Thematic Strategy State of soil threats as requested by STS.
Static/dynamic Varying across the landscape
Dir. 60/00 Water Framework Ameliorating water quality and quantity over river basins in terms of resilience to future climate change
Dynamic Varying across the landscape
Dir. 2007/60 Flood
Dir. 80/68/ Groundwater against pollu-tion
Evaluation of the soil protective ability towards groundwater pollution
Dynamic Varying across the landscape
Dir. 86/276 Sewage sludge Evaluation of the attitude and criteria for the application of sewage sludge
Static/dynamic Varying across the landscape
Reg. (EC) 1782/03 1783/05 ACP Sys-tem of conditionality
Farmer support to enter the system of conditionality
Dynamic Varying across the landscape
Reg. 510/06Reg.1898/06 Designations of origin
Support for geographical indications and designations of food origin.
Static Varying across the landscape
Reg.1698/05 Reg.1974/06. Rural devel-opment in forestland
Best practices in order to achieve good forest maintenance
Dynamic Varying across the landscape
al., 2011), which take hypothetical changes in the application variables or parameters as an input and estimate its impact on performance.
These papers applying SDSSs in agriculture and envi-ronment clearly show the importance and the rapid, posi-tive progress of this research topic. On the other hand, we must emphasize here that most of the above contributions are somehow sectorial since they focus on a specific topic and, moreover, they do not incorporate the crucial dynamic nature of some environmental data. For instance, this is the case for their climate models, in which the daily climate variation – which is indeed a key issue in many agriculture environmen-tal applications – is simply missing!
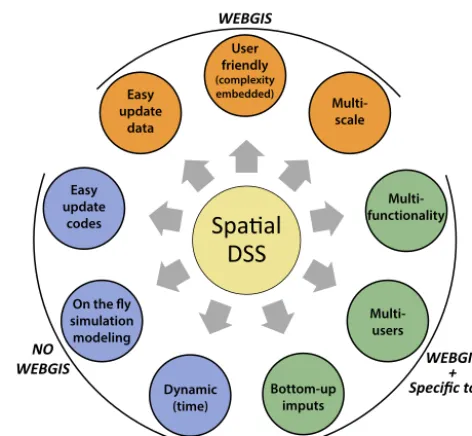
Therefore – considering the actual complexity of many current agricultural and environmental challenges – we claim here that there is the need for a very different, much more in-tegrated and operational approach (through the Web) which will hopefully incorporate all of the features reported in Fig. 1. Is this system feasible however? A proper answer requires addressing those features reported in Fig. 1. It is rather evident that some of them are already available in many standard Web-GIS systems (Web-GIS in Fig. 1) – such as user-friendly interface, multiscale, and easy updating of databases – while other features require adding specific new components (then codes) to standard Web-GIS (e.g.
multi-functionality, multi-user, bottom-up contributions); this may be a problem in terms of factual implementation. But the real issue relies on the evidence that the above-claimed opera-tional and integrated approach requires some extra key fea-tures, which are well above the domain of Web-GIS systems (No Web-GIS in Fig. 1). Most importantly, they relate to the need for dynamic databases (e.g. daily/hourly update of cli-mate maps) and the need for on-the-fly simulation modelling as required by most dynamic applications in agriculture and environment domains (e.g. crop growth or nitrate leaching). Moreover, the required approach requires an easy update of computing codes; this is a key issue to ensure the needed sys-tem modularity and flexibility, but again this is rather difficult to be implemented in standard Web-GIS systems.).
Despite these difficulties, here we claim that recent sci-entific and technological progress, the great improvement in databases, and most importantly new perspective about the role of soil scientists (Bouma, 2015) as well as the awareness about soil multidisciplinarity (Keesstra et al., 2012; Brevik et al., 2015) make it possible to move down a new road.
simula-tion modelling of the SPA (soil–plant–atmosphere) system, and progress in land management studies (García-Orenes et al., 2009; Gao et al., 2014; Leh et al., 2013; Zornoza et al., 2015); (iii) open-source Web-GIS; and (iv) high-performance computing and, especially, GPU processing. Moreover, (v) recent developments in Web-based “geospa-tial cyberinfrastructure” (GCI) platforms promise to produce efficient and high-performing SDSSs. Indeed, the GCI plat-form can support the acquisition, storage management, and integration of both advanced and dynamic data (e.g. pedo-logical, daily climatic, and land use), data mining and data visualization, and computer on-the-fly applications in order to perform simulation modelling (e.g. soil–water balance and crop growth), all potentially accessible via the Web, and (vi) new understanding about the key issues of trandisciplinarity and the role of multiple stakeholders (Thomson Klein et al., 2001).
1.3 The aim of this research
Thus, the general aim of this contribution is to demon-strate that GCI-SDSSs – strongly rooted in soil – can pro-duce smart, multidisciplinary integrated geospatial knowl-edge system (as depicted in Fig. 1) to support decision making in many different domains, including agriculture, forestry, and urban planning. All of this is potentially adapt-able to any other geographical region; thus this paper seek to promote interest at an international scale.
In order to show the system in operation, this paper also aims to illustrate – as case studies – two very different spe-cific applications, namely olive growth and groundwater pro-tection.
All the above has been achieved within the framework of the EU LIFE+SOILCONSWEB project.
2 Materials and methods
In this section, we report – along with study site information – also methodological/technological details about GCI archi-tecture, data, models, and graphical interface (dashboard) be-hind our GCI system. This choice has been made to enable the reader to easily separate (and then find) details and tech-nicalities about data (e.g. resolution), computing libraries (JavaScript), open-source software, etc. from the main result, which is the actual implementation of the CGI system – and then how all the above data, libraries, models, etc. are imple-mented together (sometimes writing new codes, new proce-dures, etc.) to produce the required applications.
2.1 The study site
The work was performed in the “Valle Telesina” site in south-ern Italy (Fig. 2). The area is of about 20 000 ha; it is close to the city of Benevento and encompasses 13 municipalities.
Spatial
DSS
Multi-functionality
Multi-scale
Multi-users
Bottom-up imputs Dynamic
(time) On the fly
simulation modeling Easy update
codes Easy update
data
User friendly (complexity embedded)
WEBGIS
WEBGIS + Specific tools NO
WEBGIS
Figure 1. Features to be expected of a spatial DSS system in
or-der to address current complexity of agriculture and environmental challenges.
It is a very complex landscape with a high soil and climate spatial variability.
Valle Telesina has a composite geomorphology and an east–west elongated graben where the Calore River lies. Five different landscape systems are present (Fig. 2): (i) limestone mountains, with volcanic ash deposits at the surface; (ii) hills, comprised of marl arenaceous flysch; (iii) pediment plain, comprised of colluvium material from the slope fan of the limestone reliefs; (iv) ancient alluvial terraces; and (v) the actual alluvial plain. Such complexity is echoed in the 60 soil typological units, aggregated into 47 soil mapping units. The study area is traditionally suited to the production of high-quality wine (Bonfante et al., 2011) and olive oil in the hilly areas, while beech and chestnut forests are present in the mountain system, where there is a natural park. It is also im-portant to emphasize the fact that, over the last decade, Valle Telesina has experienced a large amount of soil consumption as a result of land use change due to new urbanization. These changes in land use have caused conflicting interests – be-tween agriculture, forestry, and urbanization – and ideas of how the land should be used.
2.2 Methodological and technological issues behind the architecture design of the SOILCONSWEB-GCI
Valle Telesina (BN)
12 Km 6 Km 0 Km
N
ITALY
(I) (II)
(III) (IV)
(V)
Figure 2. Map of Valle Telesina and its main landscape systems:
(I) mountains, (II) hills, (III) pediment plain, (IV) ancient fluvial terraces, (V) alluvial plain.
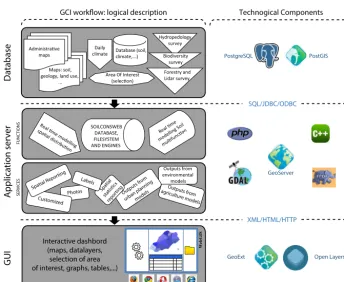
the Web. As to “how” these methodological and technologi-cal components work together to implement a coherent oper-ational GCI system is described in the Results section.
The chosen logical architecture has three tiers. It is a client–server architecture in which the presentation, the ap-plication processing, and the data management are logically separate processes. The presentation tier displays informa-tion relating to the services; the business logic tier controls the application’s functionality by performing detailed pro-cessing; and, finally, the data tier consists of a database where information is stored and retrieved in such a way as to keep data neutral and independent of application servers or busi-ness logic. The main advantages in the use of the three-tier architecture are that (i) complex rules are easy to implement in application servers; (ii) business logic is off-loaded from database servers and clients, which improves performance; (iii) changes to business logic are enforced automatically by servers – changes only require new application server software to be installed; and (iv) application server logic is portable to other database server platforms by virtue of the application software.
Technological details are shown in Fig. 3 (further explana-tions are given in the Results section). Fundamentally, client– server communication is based on AJAX (asynchronous JavaScript and XML) technology, and most of the data are transferred from the server to the client in JSON format. The graphs are presented in the user interface using YAHOO Charts as a part of the ExtJS library. AJAX can deliver effec-tive results in terms of user experience and opens up oppor-tunities for further developments.
According to three-tier architecture and AJAX technolo-gies, the presentation tier and a fraction of the business logic tier developed using the JavaScript library have been imple-mented in the Web clients. The main frameworks used to dis-play and inquire into the geodata were Open Layers and Ex-tJsandGeoExt. OpenLayers is an open-source (provided un-der a modified BSD license) JavaScript library for displaying map data on Web browsers which provides APIs (application program interfaces) for building rich Web-based geographic
applications. SenchaExtJs is one of the fastest JavaScript li-braries that allows Web-building applications with a rich set of user widget and data structures. GeoExtis is an extension of ExtJs and links ExtJs and OpenLayers, adding new wid-gets. In addition, a layer of custom code, which uses the listed frameworks and implements the user interface and a part of the business logic, has been written in JavaScript.
On the server side, the system uses the following exten-sive technologies: PHP, Apache Web Server, PostgreSQL+ PostGIS, and GeoServer, as well as some more specialized technologies such as FPDF (PHP class which allows the gen-eration of PDF files with pure PHP). In order to meet project and user demands, the development of the system required the implementation of new functionalities. In particular, on the basis of the current state of art of the vector data elabo-ration, PostGISfunctions was used to conduct the innovative vector analysis. Indeed, PostGIS shows interesting charac-teristics for data extraction from one or more vector layers (such as intersections and overlaps) and massive processing of statistical raster data. Besides PostGIS, a very new ap-proach was used to process raster data by combining orig-inal C++code raster algebra and PostGIS functionality. Ac-cessing raster data (reading and writing) was carried out by GDAL library, which abstracted the access data in various formats, while accessing vector data was carried out by the pqxx (a C++library for accessing PostgreSQL databases). A notable example is a massive, fast zonal attribute oper-ation on a large layer stack of raster data (mean statistical values extraction/variance/minimum/maximum/pixel count). This allows the analysis of a large number of a raster files with a polygon shape file masking (both optional), where the pixel positioning (inside or outside the polygon) is carried out by PostGIS functions. In other words, via PostGIS, the system decides what the segments (and thus the pixels) of a raster line which belongs to a selected polygon are. The zonal attribute is a recurrent algorithm which is used to extract sta-tistical data from raster data in order to run many tools within our system. Another unique characteristic is a module that uses a port of the SWAP software (Soil – Water – Atmo-sphere – Plant, originally written by Alterra and Wageningen University; Kroes et al., 2008) for Linux to perform real-time simulations on water balance in the soil–plant–atmosphere continuum.
SQL/JDBC/ODBC
XML/HTML/HTTP
D
at
abase
Ap
pli
ca
tio
n server
G
UI
PostgreSQL PostGIS
GeoServer
GeoExt Open Layers
Hydropedology survey Daily
climate Biodiversity
survey
Administrative
maps
Forestry and Lidar survey
SOILCONSWEB DATABASE, FILESYSTEM AND ENGINES
FUNC
TIO
NS
SE
RVIC
ES
Interactive dashbord (maps, datalayers,
selection of area of interest, graphs, tables,...)
Maps: soil, geology, land use,
...
Database (soil, climate,...)
Area Of Interest
(selection)
Outputs from environmental models Outputs fr
om agricultur
e models Outputs fr
om
urban planningmodels Spatial R
eporting
Customized Photos Labels
Spatial statistics
repor ting
Real time
modelling Soil
multifunction
Real time modelling spatial distribution
GCI workflow: logical description Technogical Components
W
ebGIS
Cross platform
Figure 3. Simplified diagram describing SOILCONSWEB geospatial cyberinfrastructure architecture and its main technological
compo-nents. Abbreviation: GUI – graphical user interface.
2.2.1 Data set
The data set included data and metadata from many differ-ent sources – given in Table 2. Data are an essdiffer-ential compo-nent of the system, and some data are parameters for feeding many GCI models. The main types of georeferenced data in-clude the following: (i) static data (e.g. thematic databases) dealing with agriculture and environment, (ii) static data ob-tained from measurements obob-tained by field-specific survey activities (e.g. soil hydrology), (iii) dynamic data obtained by automated climate stations, and (iv) measurements obtained by remote sensing (e.g. forestry ground biomass stock).
Mapping data (fulfilling the INSPIRE directive) varied in many technical features, and this required a special effort in data harmonization in order to make the whole GSI-SDSS work. The main problems encountered were the following: (i) data resolution of different thematic layers varying greatly in both spatial and temporal domains; (ii) large heterogeneity of data type (for geology, population, soil, water storage, bio-diversity, etc.), (iii) data quality heterogeneity (gaps in data were rather common in thematic information), (iv) legal re-strictions regarding data to be displayed on the Web (e.g. variations between different data), and (v) structure of data varying greatly (text files, .shp, .grid, qualitative information, etc.);
In general terms, the following preprocessing was required to incorporate data into our SOILCONSWEB-GCI. All of
the spatial data, namely vector and raster layers (i.e. pre-existing thematic maps, remote-sensing data, etc.), at land-scape level were re-projected into the local UTM zone 33, datum WGS84. They were checked for anomalies and sub-jected to up-scaling procedures where required (for instance this was required for high-resolution data for specific appli-cations). Vector data were verified for the information they contained, and redundant data were eliminated (i.e. land-scape system maps may have contained information about soils which was already present in the soil maps). Land use maps which referred to different projects or different periods were harmonized if required for specific applications (e.g. land cover; Touring 1954 and Corine 2006 had different clas-sification structures).
Point data, such as those from soil sampling campaigns and forest stand surveys, were checked for anomalies (i.e. spatial coordinates, missing data, etc.). A unique ID was as-signed for each type of data (i.e. the codes of soil horizons had to match those of corresponding hydraulic properties).
All data except for those subsequently used for the spatial interpolation procedures (see later) were clipped within the study area.
Table 2. Main databases employed in SOILCONSWEB-GCI: description of data type and examples of their use/importance in modelling.
Theme Data: category and description Data used in modelling
Source database and (spa-tial/time) resolution
Type of file
Data Parameters (obtained by data set)
Applied model Example of model out-puts
Administrative units
Municipalities, macro-area; other bodies (mountain admin-istrative offices, etc.)
Polygon Administrative bound-aries
Area of municipality Urban sprawl, urban statistics
Rural integrity, urban environment statistic report
Legal restric-tion to land use
Natura 2000; hydrogeology re-striction
Polygon Legal boundaries Limit and type of re-striction
Presence/absence of restriction
Surfaces under restric-tion
DEM 20×20 (contour level); 5×5 (resampled lidar);
Grid Mean height Spatial coordinates and height
Fuzzy landform segmentation
Estimate of soil erosion
Agro-meteorology
Raw data from weather stations of the regional meteorological network; daily and hourly data; 1 station per 2000 ha
Point Checked data on rain-fall, temperature, rel. humidity, etc.
Cumulative rainfall, max/min/average tem-perature, cumulative evapotranspiration, etc.
SPA modelling Soil hydrological properties (water content/storage, etc.)
WeatherProg internal database
(checked time series at gauged locations); daily and hourly data; 1 station per 2000 ha
Grid Digital climate maps of rainfall, temperature, etc.
Cumulative rainfall, max/min/average tem-perature, cumulative evapotranspiration, etc.
SPA modelling Soil hydrological properties (water content/storage, etc.) Geology Geological map/1:100 000 Polygon Geological units Description of setting None Landscape awareness
Geomorphological map/1:
50 000
Geomorphological units
Viticulture zoning Hydrogeology map/1:250 000 Hydrogeology units Lower-boundary
set-tings for modelling
Water balance modelling
Water storage and water fluxes in the HCZ Soil Soil mapping databases/1:
50 000
Polygon Main soil morphologi-cal, chemimorphologi-cal, physical parameters, STU
SOM, clay content, soil depth
SPA modelling Quantification of soil ecosystem services and land suitability maps Soil survey campaign Soil hydrology
parame-ters
Water retention curves, Hydraulic conductivity curves
SPA modelling Soil–water balances and storage
Soil fauna classification Soil biodiversity indexes
None Maps of soil biodiver-sity
Land use Corine Polygon Land use mapping units Description of setting Erosion (RUSLE)
Estimate of soil erosion Land use map/1:50 000 (1954
TCI, 2001 Campania region, 2011 new survey using remote sensing)
Landscape awareness
Forestry Forestry map (1:5000) Polygon Forest map units Description of setting None Maps of forest types Lidar/5 points/m2 (calibrated
with field measurements)
Grid Map of 5 echoes Height of stands C stock; grow-ing stock; above-ground biomass
Maps of quantified stands’ parameters
series data covered the wet and dry seasons of 2012. Train-ing data were collected from WorldView-2 scenes, and the MODIS time series was classified by using a decision tree.
The architecture provides a service that relies on metadata which are specific to the shared resources. It is an essential component that helps in both resource dissemination and re-source locating. One of the advantages of such a service is undoubtedly its ability to link the need to highlight these in-herent data to the producers and the final users, who access system resources at their location. According to this vision, all metadata comply with INSPIRE (Commission Regulation
(EC) No. 1205/2008 of 3 December 2008 implementing Di-rective 2007/2/EC of the European Parliament and of the Eu-ropean Council as regards metadata).
Qual-ity control assessments were required in order to ensure that database accurately reflected data types, field survey data, etc. This was done to ensure that data contained as few co-herency, integrity, and quality issues as possible. Lastly, geo-referenced photographs and associated metadata, from field surveys, were also stored on the file system according to the sampling location and associated field description (e.g. site and soil profile morphology).
2.2.2 Models: basic methodological issues
The complexity of the SOILCONSWEB-GCI system is due to the need to assess and analyse the multifunctional role of soils and landscape. This requires the use of a set of models that is capable of evaluating ecosystem services and func-tions; thus, we had to use different models depending on the type of issue to be tackled, state of the art, data availability, calculating and processing capacity, degree of testing (and acceptance) by the scientific community, and availability of source code.
Consequently, it should be no surprise that, in the SOILCONSWEB-GCI system, we employed all the follow-ing: physically based models, empirical models, and other in-between models.
The implementation of models in the GCI sometimes con-sisted of writing a few lines of program code (e.g Table 3). On the other hand, in other cases it consisted of writing large programs ex novo (such as WeatherProg and cvSISE) or struggling to recompile pre-existing programs on differ-ent platforms from those which they were built and tested for (e.g. SWAP).
In general terms, models in the SOILCONSWEB-GSI sys-tem were selected bearing in mind future development in new areas. This meant the formulating of problems with a high level of generalization while keeping local empirical approaches as low as possible. In this framework, we se-lected models which use the following criteria: (i) where possible, attempting to privilege physically based core en-gines; (ii) coherence with available databases (Terribile et al., 2011); (iii) coherence with the modular structure; (iv) eas-ily interchangeable routines at own convenience (e.g. evapo-transpiration, water balance); (v) propensity to include new routines; (vi) possibility to switch the different modules on or off, in accordance with the requirements of the wrapping application; (vii) potential facilities for extensive validation (on the ground or through remote sensing) and potential as-similation of new remote-sensing data; (viii) ease of creat-ing/managing different scenarios (what-if modelling); (ix) real-time or quasi-real-time spatial inference modelling; and (x) compliancy with the Open Geospatial Consortium (OGC) specifications.
2.2.3 Dashboards: basic methodological issues
The need to address a number of online applications required the development of a decision support dashboard for every type of user because each user has different knowledge. This is a very important methodological issue allowing engage-ment of stakeholders.
Indeed, a single dashboard for all users with many very different tools would create confusion.
The dashboard design had to include graphical tools, pro-cedures to combine spatial data (analysis and visualization), and the production of tables and maps. Moreover, the dash-board also had to enable the activation of algorithms based on different programming languages, databases, graphics pack-ages, architectures, etc. However, all this diversity and com-plexity of information and processing, even though well doc-umented for the user (full documentation is supplied), had to be hidden in its practical use (transparent to the user). In-deed, the dashboard had to enable easy and intuitive naviga-tion, and, above all, it had to make the user happy to operate it and, possibly, had to remind the user of something that he already knew (visualization, procedures, etc.). The impor-tance of this caution in dashboard planning was a real must and should not be minimized. Indeed, it is evident that this specific feature traces the border between a system that has potential success and a similar one with definite failure.
In the scientific literature, there are many examples of dashboards in different contexts which have been imple-mented for a very large number of different areas (Sjobergh and Tanaka, 2014; Kijewski-Correa et al., 2014), includ-ing sustainable development, tourism, public health, hospi-tal management, etc. Their analysis can be very useful, but any dedicated dashboard has to be calibrated and adapted to a certain type of user (and his own level of knowledge).
Our final result had to be a unique, intuitive, easy-to-understand/follow dashboard which allowed the user to ob-tain support for his decisions about the landscape, soil, and environment. To achieve this objective, specific meetings were organized for each type of end user/stakeholder (two– three meetings/groups); they included farmers associations (e.g. Confagricoltura, Coldiretti), Assoenologi, 4 Cantine so-ciali, ordini Professionali, uff. Regionali SIRCA, etc. These meetings aimed to identify which modules and sub-modules might be the most important and which would be the best for outlining and architecture menu.
3 Results
phys-Table 3. Modelling details in SOILCONSWEB-GCI. “A” stands for “available”; “NA” stands for “not available”.
Modelling Theme of Model Main functionalities Availability Required activity Examples of input Examples of output On-the-fly What-if
chain Model of source to implement parameters in the SDSS simulation model
codes in SOILCONSWEB
1st
le
v
el
Zonal statistics
General model used in Statistic in each zone A Direct Any raster variable Reporting of the area of A
open GIS environment data set based on implementation interest
values from another of functions
data set
Climate
WeatherProg (gauged Several agriculture NA Writing new codes Raw data from Checked and harmonized A
data are retrieved, and environment weather stations time series at gauged
decoded, checked, applications locations;
infilled, and mapped) digital climate maps
Selecting centroids in Climate trends NA Writing new codes Spatialized weather Graphs of climate trends A
drawn areas data (i.e rain, temperatures)
Combining raster Bioclimatic indicators NA Writing new codes Spatialized weather Maps of bioclimatic A A
data set data indicators (i.e. Winkler
(including climate index, Branas index, etc.) change scenario)
Soil
cvSISE (Spatial Inference Spatial inference of NA Writing new codes Measurements of Digital soil maps of A
Selector Engine with pedological properties pedological properties specific pedological
cross validation) at soil survey locations properties at the required
(e.g. clay content or level of pedological
organic matter) support
2nd
le
v
el
W
ater
balance
Combining raster data set Evapotranspiration A Writing new codes Spatialized Graph of potential A
temperature data evapotranspiration vs. time
Interactive real-time Soil–water content A Adapting the codes Plant parameters, Vector and tabled data of A A
SWAP data from soil and actual soil–water content
climate database
Offline SWAP Loss of soil NA Direct Plant parameters, data Tabled data related to the A
hydrological functions implementation from soil and climate loss of soil capacity in database (including groundwater recharging climate change
scenario)
3rd
le
v
el
Land
management
Interactive real-time Rate of soil erosion NA Direct Land cover type, data from Raster mapping of potential A A
RUSLE implementation soil database, type of anti- and interactive soil erosion
erosion management
Interactive real-time Soil protective A New compilation Plant parameters, data Vector mapping of interactive A A
SWAP capacity under UNIY after from soil and climate soil protective capacity
modification of database FORTRAN source code
Matching data set Land use change NA Writing new codes Raster and vector data Tabled data and statistics
matrices related to land use at relating to land use change
different times over time
Soil sealing NA Writing new codes Raster and vector data Tabled data, statistics and related to soil sealing at maps related to soil sealing different time evolution over time
Item counts in areas Landscape NA Writing new codes Raster and vector data Raster maps of rural A A
with variable extent fragmentation related to soil sealing fragmentation and indicators
of urban interest
Agricultural
management
Empirical model Trends of quality NA Writing new codes Spatial climate data Graphs of quality parameters A A
based on climate parameters (temperatures) values (i.e. briY degree,
data acidity)
Interactive real-time Supplementary A New compilation Plant parameters, data Graphs of plant water stress A A
SWAP irrigation based under UNIY after from soil and climate value provisions (i.e. vine)
on soil–plant water modification of database
stress FORTRAN source
code
Simplified Spatiotemporal plant A Writing new codes Digital climate maps Graphs of the risk level of
Plasmopara viticola pathogen simulation (temperature, rainfall, infection by grapevine downy
model (Rossi et al., relative humidity) mildew
2008)
Data
reporting
Models constructing Statistical and NA Writing new codes Potentially all data stored Downloadable reports and A
reports informative reports in the project database table (.PDF, .Yls, .tYt)
ical landscape. We aimed to achieve this general objective through approaches which are transparent to the end user. The system is freely accessible at www.landconsultingweb. eu.
We report the main findings of the SOILCONSWEB-GCI in two separate sections. The first section describes the im-plementation of the complex GCI architecture that allows the multifunctional applications of the system; the second sec-tion describes the applicasec-tion of the system for (i) olive
3.1 The implementation of the SOILCONSWEB-GCI
3.1.1 Implementation logic
The end-to-end GCI architecture and operating mode of SOILCONSWEB project is presented in Fig. 3 (CGI core workflow). Here the interaction between the three tiers and the workflow between system components can be observed. A core workflow is where different types of databases (project data) feed the application server by activating differ-ent server functions (e.g. models). This in turn produces a set of applied and basic server services (e.g. output of models) that lastly can be accessed by the end user dashboard (GUI). One key and interesting point is the spatial selection of database (in the database box) which is performed by the AOI (area of interest) drawing tool by which the user (e.g. farmer) can delimit the region of interest (e.g. the farm) within which he can run any implemented tool. In the system, there is a menu enabling the user to explore several possibilities of AOI data input. Indeed, applications typically activate algorithm processing for the polygon (closed arc), which is free-drawn online by the users (by clicking on geographical points) or selected by using pre-existing polygons (e.g. municipalities, cadastral registry land inventory). The AOI may also consist of a number of polygons. Moreover, the AOI might be (i) re-edited/deleted, (ii) stored in a personal space, or (iii) made public for general use. All of this is visualized by automat-ically displaying the arc defined by users on a map. Once drawn, the AOI represents key data stored in a database and linked to the user.
In order to perform the highly complex multifunctional ap-plications on the AOI, it is mandatory that SOILCONSWEB-GCI integrates raw data, data management, data analysis capabilities, and graphical display capacities into a system that is perceived as “easy to use”. All of these issues, along with the spatial nature of the data, led us to develop the SOILCONSWEB-GCI platform by using Google Maps as a basic background visualization layer, because of its large use by local communities. On this basis, SOILCONSWEB-GCI incorporated the state-of-the-art optimization algorithms.
3.1.2 Functions
The complex multifunctional and multi-stakeholder tasks re-quired by the SOILCONSWEB-GCI system demanded the use of a set of functions (Fig. 3 – Functions) and, espe-cially, models that are capable of evaluating ecosystem ser-vices over the AOI. In accordance with the specific questions to be answered, these multifunctional models range from the physically based to merely empirical similarly to the range of models identified by Bouma (1999) varying from mecha-nistic holistic (level K4) to qualitative expressions of expert knowledge (level K2).
In general terms, implemented models consist of cus-tom processing routines that have been developed within
GeoServer, custom low-level programming language codes (such as C, C++or FORTRAN), and processing scripts in the R statistical language or MATLAB. These analytical ef-forts were required to address answers to the ecosystem ser-vices/function given in Table 1.
All the models used in the SOILCONSWEB system are part of a modelling chain, and the principle features of each of the main models are given in Table 3. The modelling chain includes
– first-level models referring to basic geospatial functions
such as spatial inference and zonal statistics of basic en-vironmental variables (e.g. soil, climate);
– second-level models, which require first-level models
as an input and refer to the basic functioning of the soil–plant–atmosphere system such as soil–water bal-ance models;
– third-level models which refer to applications. These
typically require first- and/or second-level models as in-puts.
The main components of first-, second-, and third-level models were tested and validated as part of different projects (e.g. Basile and Terribile, 2008; Manna et al., 2009; Bonfante et al., 2010).
Below a brief overview of selected implemented models is given in order to clarify how SOILCONSWEB functions.
First-level models (basic geospatial models)
These include core engines, newly written programs, for the spatial inference of basic environmental attributes, in this case climatic variables and soil properties. These fully cus-tomized programs provide the spatial and dynamic compo-nents to our GCI and populate the second and third modelling levels.
Digital climatic mapping
1. Retrieve. At every eventt in time, a secure file trans-fer protocol (SFTP) synchronization retrieves the cur-rent report of climatic data to be processed.
2. Split. This report is split to create a table for each cli-matic parameter.
3. Decode. Each record is placed in the database according to its climatic parameter and to its space–time position (i.e. precipitation at dayt for stations).
4. Check. Time series checking to demarcate measured from missing and anomalous data. Anomalies are ab-normal measured data and are detected by using a set of differently combined checks, including logical, clima-tological, spatial, temporal, and persistence checks. 5. Infill. Gaps due to missing and anomalous data – already
flagged as missing – are infilled by using two (or more) competitive interpolation techniques: (i) a determinis-tic method (e.g. simple moving average with growing kernel and average value for that station and that Julian day) or (ii) statistical method (e.g. multilinear regres-sion using data from other gauges after an optimization procedure).
6. Map. Spatial inference and delivery of digital maps. The output is a multitemporal stack of spatial maps of one or more required climatic parameter. The spatial infer-ence is based on alternative/competitive methods from amongst inverse distance weighting, (multivariate) krig-ing, and a daily-adapted PRISM-like approach (Daly et al., 2008).
Each step represents a programming node, which can be turned on or off according to the kind of WeatherProg run that is performed. The most commonly used runs can pro-cess the daily records and produce the digital climatic maps for that day (the so-called “daily call”) or process past miss-ing data that were not available before, for instance due to connection problems (the so-called “integration call”). The result of performing a set of automatic runs of WeatherProg is the availability of a complete set of records for point sta-tions and a complete temporal stack of digital maps of all the required climatic variables (such as minimum and maxi-mum air temperature, precipitation, relative humidity, refer-ence evapotranspiration, and solar radiation).
Digital soil mapping
This engine – called cvSISE, Spatial Inference Selector En-gine with Cross Validation – performs the spatial inference of pedological properties (Langella et al., 2012). cvSISE was designed, implemented, and deployed to support the rou-tine query by users about the GCI which needs digital soil maps to be available to run attribute space inference sys-tems and give an exhaustive Web-integrated response. In
or-der to accomplish this goal, a set of models of spatial ference should be calibrated periodically (within 1-year in-tervals) to make up-to-date prediction maps. More specif-ically, at any scheduled time step, the cvSISE engine will only start if modifications of sample points and/or of covari-ates have occurred. Otherwise the most accurate digital map for any soil attribute which was accounted during the previ-ous step is retained. This checking node enables the detection of new soil records or new/better-defined auxiliary covariates and their automatic inclusion in the spatial modelling of soil properties. When a novel feature becomes available, cvSISE runs and calibrates different types of spatial models, each of which uses a jackknife leave-one-out cross-validation proce-dure. Finally, the model making the least-noisy proxy for the soil attribute of interest is selected to build the digital map. Different models of spatial interpolation are developed, in-cluding the representations given by the reference soil map-ping units, inverse distance weighting, ordinary least-squares regression, and different kinds of kriging.
Second-level models: (basic soil–plant–atmosphere models)
Among these are physically based SPA hydrological models (Richards based), empirical hydrological models (bucket), and models to obtain bioclimatic indicators (e.g. Winkler).
Some of these models can be very complex, and pro-cessing can be demanding. One of these cases is the SWAP model, which is applied to find the soil–water bal-ance in the SPA continuum on a daily basis. In this case the model belongs to the physically based family. In the SOILCONSWEB-GCI, the model is applied in both “offline” and on-the-fly mode (see later). SWAP is designed to simu-late the soil–water–atmosphere–plant processes with a highly detailed structure for the soil–water module. It is actually a 1-D hydrologic model in which the soil–water balances are based on the Richards equation (Kroes et al., 2006).
This model is usually applied after calibration procedures (see above) that require the monitoring of upper- and lower-boundary conditions (e.g. climate, water table depth) and soil–water status (e.g. soil–water content, soil pressure head). To run, it needs such data inputs as (i) soil data (thick-ness, horizon sequences, physical and chemical character-istics, soil hydraulic properties, etc.); (ii) climate data with daily time step (rain, temperatures); (iii) plant data (roots depth, LAI, etc.); and (iv) lower-boundary conditions (e.g. dynamics of water table depth, impeding layer, etc.). In SOILCONSWEB-GCI, SWAP runs thanks to the georefer-enced data input stored in the project database; this allows the application of the model throughout the study area.
spatialized procedures developed for SOILCONSWEB-GCI enable the production of maps of the SWAP outputs.
Third-level models (models of applications)
Among these are models for the estimation of erosion (RUSLE); statistical models for the production of reports (mean, max, min, standard deviation, etc.); empirical mod-els to obtain indicators of urban planning (sprawl index) and environmental, agricultural interests; or more complex mod-els such as those for spatiotemporal simulation of the risk of infection by the Plasmopara viticola grapevine fungus.
The complexity in the actual implementation of the mod-elling engines in the SOILCONSWEB-GCI system varies enormously in accordance with the need to implement on-the-fly simulations and “what-if” modelling engines.
As shown in Table 3, all models employed into the SOILCONSWEB-GCI can be further classified into (i) mod-els not enabling on-the-fly simulation and (ii) modmod-els en-abling on-the-fly simulation. This classification is important because some models may be used with an offline procedure; in this case pre-processing is required and the output is up-loaded onto the server. This applies for many non-dynamic applications (e.g. maps of annual bioclimatic indices) or dy-namic applications with a long timescale (e.g. maps of land use change over 2 years).
On the other hand, the need to deliver feedback to daily land and soil management and planning requires SOILCONSWEB-GCI to provide dynamic responses, for in-stance by taking into account the specific climatic condi-tions of the current crop year and, therefore, of daily, or even hourly, trends too. This requires the implementation of dy-namic models; in other words models “must” operate in real time, so permitting on-the-fly processing over the Internet.
To make the modelling challenges even more complex, we must recall here that real life application in the field of agri-culture and environment often requires the inclusion – for some models – of the so-called “what-if” modelling engines. It is evident that the SOILCONSWEB-GCI system cannot in-clude very local scale data/information in its platform, such as those dependent on a specific farmer’s management (crop of that year, fertilization, date of sowing, etc.). Thus, we had to develop models which enabled the end user to apply – on the fly – his own parameters, which would then be used in model processing and produce output adapted to specific lo-cal conditions.
These what-if models implemented within the SOILCONSWEB-GCI system refer, for instance, to (i) the “soil–water balance” under a specific crop; (ii) “protec-tive capacity of the soil-crop system in terms of groundwater protection”, and (iii) the “urban planning options” in terms of their impact on soil ecosystem services. In all these examples, it is essential that the end user inserts some local parameters (crop, sowing date, areas of new urbanization,
etc.) in order to make the SOILCONSWEB-GCI models run properly.
Table 3 shows the main models employed by the SOILCONSWEB-GCI and where on-the-fly and what-if modelling engines were implemented.
In most applications, basic statistics of the model output (e.g. mean, min, max, standard deviation) were produced by specific modelling engines.
3.1.3 Server services
The server provides a set of services (some examples are in Fig. 3 – Services) which are implemented by using various technologies and standard formats for data exchange. These services achieve not only technical interoperability but also contextual interoperability, as it mediates between the script-ing environment and various client applications. In short, on the basis of data set, models, and modelling output, the sys-tem provides services which are accessed by users using var-ious dashboards. These are the following (grouped in the ser-vices box in Fig. 3):
Map service: the implemented map services are the
Web Map Service (WMS) and the Web Feature Service (WFS) both provided by an “instance of” GeoServer.
Model service: this is implemented with a mix of PHP
scripts and C/C++/Fortran programs. PHP scripts over-see and control all the mechanisms for exchanging in-formation between different modelling scripts (writ-ten in C/C++/Fortran), their operations, and execution. They, also, format the responses and send the results to the client, following the standard interchange protocol.
Spatial statistic service: based on the same architecture
as model service, this specializes in performing statisti-cal statisti-calculations on multiple data sets, such as statisti- calculat-ing means and variances in multiple layer stacks. The service summarizes the values of a raster within the zones of another data set (either raster or vector) and presents the results as a table.
Reporting service: based on the server-side PHP library
“FPDF”, which is expanded with an ad hoc code for data extraction and builds PDF documents from texts, tabular data, and photos under program control.
3.1.4 Dashboards
Hence, the planning, management and update of dash-boards are an essential result of the system (Fig. 3 – Dash-boards). Moreover, dashboards must be perceived as “very useful” to be successfully employed, and, therefore, they must incorporate tools and processes that are chosen by end users and which help them with their specific soil/land man-agement problems.
On the other hand, dashboards should also be perceived as easy to use. This was obtained by involving end users (e.g. farmer associations as mentioned in the Materials and meth-ods section) in dashboard planning and incorporating in the menu some items that may recall something that a user al-ready knows (images, his farm, etc.). The design (and, there-fore, attached functionalities) of these dashboards were the result of a series of interactions with communities of end users/stakeholders. Indeed, some users required the incorpo-ration of complex system facilities such as the following:
Remote Internet GIS processing: e.g. to overcome
ad-ministrative limitations in using GIS desktop software (request by public offices of land planners at PTCP Ben-evento and forest managers at Regione Campania);
On-the-fly graphics: e.g. visual analysis of rainfall and
temperature over the last few days in a freely selected area (request by viticulture experts and farmers);
On-the-fly simulations: e.g. soil–plant–water stress
eval-uation to estimate the growing season (request by viti-culture experts);
What-if algorithm: Evaluation of potential pollution by
nitrate towards groundwater (request by regional offices dealing with nitrate directive).
Basically, regardless of the contexts, all dashboards allow land planning and land management through Web-mapping applications, simulation modelling, spatial data reporting, data graphing, photos, etc. Basically, all of these features allow the user to access/explore/visualize both the existing spatial data (geology, soils, etc.) and new data (e.g. plant wa-ter stress) obtained by offline and online processing for the whole Valle Telesina landscape.
All dashboards have the same core and multiple adapta-tions in accordance with specific applicaadapta-tions, so the user explores applications, on the basis of his needs, by activat-ing sequential pop-ups which populate all of the dashboard components.
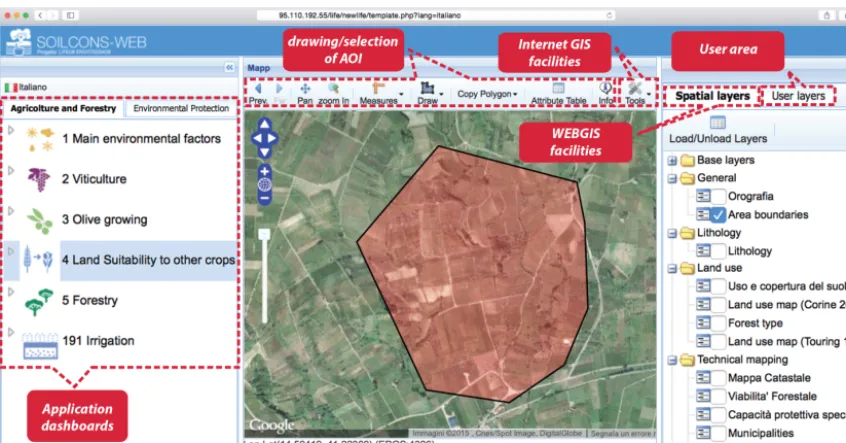
Figure 4 shows the general outline of the dashboard design. Fundamentally, all dashboards have a basic core made up of five different sections (red boxes in Fig. 4) and one section dealing with the required application. From right to left around the central display of Google Maps, there are (i) a user area, where all of the process-ing/information/data/graphs/maps/statistics requested by the user are recorded and activated upon new request; (ii)
Web-GIS facilities, which enable the user to navigate between
spa-tial data layers (geology, soil, land use, etc.) for the whole Valle Telesina; (iii) Internet GIS facilities, which enable queries, map services, and other requests to be made by the user as typically occurs in a desktop GIS (without any user need for a software license); (iv) drawing/selection of the
area of interest, where the user can interact with the system
by drawing his AOI or by selecting pre-existing AOI (e.g. municipalities, land registry inventory ID, etc.); and (v)
ap-plication dashboards. This last section refers to the specific
application chosen by the user, and, therefore, it changes in accordance with the type of user.
During the login, the user is able to activate (click) all or just one of the applications according to his personal inter-ests. In general terms, the dashboard allows navigation that is adapted to multiple geographical levels, and this reflects the need for the user to make decisions on different spatial scales.
The complex user interface of the presentation layer goes far beyond the concept of a lightweight client; it was devel-oped writing a lot of custom codes on the client side on the top of the huge frameworks used.
3.2 Applications of SOILCONSWEB-GCI
The GCI system has two broad areas of application: agri-culture and forestry, and environmental protection (which include landscape and urban planning). Each of these two applications (and sub-applications) is explored through spe-cific dashboards. Below, we provide a schematic description of two examples of applications. It must be clear from the beginning that these applications represent practical support towards decision making as they cannot and do not intend to substitute technical experts (e.g. soil scientists, olive grove experts,), but they can support these experts to better perform their job. These systems are therefore not in competition with experts since – for instance – many practical issues (e.g. plant disease, water stress, soil local variability, nitrate soil–water content) indeed require very local analysis which can only be performed – for instance – at the scale of a single plant or set of plants. This indicates that the SOILCONSWEG GCI acts as a modern intermediary tool between users of soil infor-mation and experts, requiring action by both groups to cre-ate synergy. Modern users, particularly the young ones, have grown up with computer games, and this tool is therefore quite suitable to engage them.
3.2.1 Agriculture and forestry (agriculture and forestry Dashboard)
appli-Figure 4. Dashboard design. The user can navigate – in accordance with his needs – by using the five different sections (in red). The
individual dashboard tools are written in Italian since the system is, for the moment, aimed toward local Italian communities of users.
cations/tools to be applied in the AOI: (i) description of main environmental factors (soil, climate, etc.); (ii) high-quality viticulture; (iii) olive growing; (iv) land suitability for other crops; and (v) forestry.
Here we do not aim to describe all these tools and func-tionalities; rather we aim to show some operational aspect in using the SOILCONSWEB system in order to provide an insight into the potentiality of the system. This will be per-formed by showing selected examples of the “olive growing” for a couple of practical applications. Still, the reader can have a broad overview of all functionalities for diverse end users of the olive growing tool in the Supplement.
Application for olive growing: the background and the problem
Olive tree cultivation in Valle Telesina has a very long tra-dition. In the 1950s it was the dominant agriculture land use (e.g. in 1954 olive groves: 11.1 %; vineyards: 6.7 %), while in last decades it has been overwhelmed by vineyards (e.g. in 2009 olive groves: 15.9 %; vineyards: 33.2 %). Part of this vineyard performance relies on the evidence that wines (and indirectly vineyards) of Valle Telesina are protected by spe-cific designation of origin (DOC, DOCG such as Solopaca, Guardiense), while olive oil is not yet protected. Thus, olive grove farmers are seeking support in their effort to obtain a proper designation of origin labels for their olive oil.
This appears feasible considering that there is a specific ministry decree (D.M. 350/99) aiming to preserve high-quality oil (Olio extravergine di Oliva Sannio Caudino Telesino; further info (in Italian) at http://www.agricoltura. regione.campania.it/Tipici/prodotti_tradizionali.htm) and
the attested high quality of local oil production (e.g. national prizes have been received by local producers Ercole Olivario and Orciolo D’oro). An additional difficulty – for olive growing farmers – is the evidence that local farmers receive very limited – if any – technical assistance to proper olive growing planning (e.g. choice of varieties) and management (e.g. pest control). In fact, due to severe budget cuts, the Department of Regione Campania for Assistance in Agri-culture (SeSIRCA) is no longer in the position to provide the required standard technical assistance to olive growing farmers.
In this specific scenario, we address the following two spe-cific issues to show SOILCONSWEB in operation:
Issue A: farmers aiming to evaluate whether their farm is suitable to grow the olive tree variety “Ortolana”, which
is required to produce the desired high-quality oil “Olio ex-travergine di Oliva Sannio Caudino Telesino” (as designed by Ministry Decree D.M. 350/99; see above).
This issue is of interest also for the agriculture department of Regione Campania, which aims to evaluate the length of the olive growing season in order to plan and control specific measures related to the Rural Development Plan (RDP)
Issue B: farmers seeking help for pest management control
Discover your landscape
Analysis of environmental and landscape features
e.g.:
•Soils(chemistry and physic)
•Landscape (elevation, slope,
aspect)
•Climate (rainfall, temperature)
•Soil water stress
•Legal restrictions
•
-AOI not suitable
Su
ita
ble
-s
te
p
2
Support to the knowledge of your olive-growing farm
Analysis of the main bioclimatic indexes
e.g.:
•Length of the growing season
•Daily temperature range
•Thermal summation
•Solar radiation
•
-Step 1
Step 2
AOI not suitable
Su
ita
ble
-s
te
p
3
AOI suitable Draw your Area of
Interest
The user draws an area of interest
Step 3
Support to the management of your olive-growing farm
The analysis of current climatic trend:
•Rainfall
•Temperatures
•Solar radiation
Are the climatic conditions
favourable to the fly attack?
Issue A Issue B
Intrinsic soil protective capability
The user gets a classification of
intrinsic soil protective
capability based on soil water
balances estimated over
several years.
Interactive soil protective capability
The user gets a classification of
current soil protective
capability based on soil water
balances estimated over
user-defined period.
Step 1
Step 2 Draw your Area of
Interest Step 3
Issue C Issue D
The user draws an area of interest
AOI protective
AOI not protective
Apply derogation (sewage sludge)
Olive growing
10 Soil protective capability toward groundwater pollution
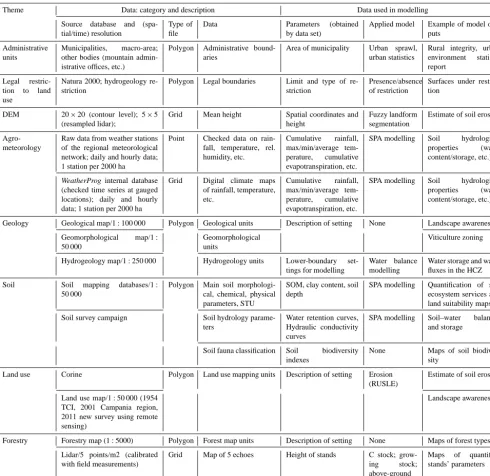
Figure 5. Flow diagram illustrating the steps to be undertaken for addressing issues A–D.
The SOILCONSWEB solution
The case study of issue-A farmers
Farmer 1. On the basis of issue A, farmer 1 aims to know if
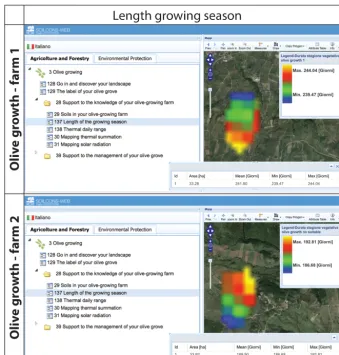
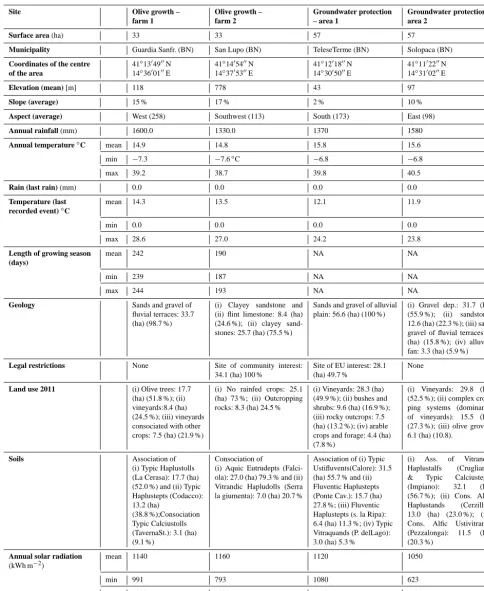
his farm is suitable to grow the olive tree variety Ortolana. The farmer applies the SOILCONSWEB-CGI dashboard and uses the steps depicted in Fig. 5. He starts selecting (or drawing directly through the Web) the boundaries of his farm (step 1), then considers the general environmental and land-scape features of his farm (step 2), and then evaluates bio-climatic indexes of his farm (step 3). Using this procedure, farmer 1 obtained data and maps of his farm as respectively given in Table 4 and Fig. 6 (farm1). Basically, farm 1 yielded good results in both step 2 (suitable soils and suitable en-vironment) and in step 3 (bioclimatic indexes). In fact, the visual examination of Fig. 6 (top) shows an adequate grow-ing season for farm 1 with rather limited spatial variation ranging from 239 to 244 growing days. The mean growing day value of 242 is coherent with the suggested minimum level for olive growing in southern Italy (www.sias.regione. sicilia.it/pdf/manuale_agrofenologia.pdf) of about 242 grow-ing days. As complementary information, spatial variability of soils and solar radiation for farmer 1 is provided in the
Supplement. Thus, as a final result, farm 1 may be considered suitable for high-quality olive growing conditions as required by the Ortolana variety.
Farmer 2. On the basis of issue A, farmer 2 also aims to
know if his farm is suitable to grow the olive tree variety Ortolana. For the sake of this example, farm 2 has the same shape and the same extension (about 34 ha) of farm 1 but it is located in a different part of the landscape. Farmer 2 follows the same three steps of Fig. 5, obtaining data and maps respectively given in Table 4 and Fig. 6 (farm 2).
Basically, farm 2 performs poorly in step 2 (unsuit-able soils) because most soils exhibit hydromorphic fea-tures (Aquic Eutrudepts), which strongly inhibit olive grow-ing (http://www.agricoltura.regione.campania.it/disciplinari/ 2015/olivo.pdf).
Figure 6. Output examples from the support for the olive growth tool: length of the growing season.
Case study of issue B: farmers
Farmer 1 and 2 seek data to avoid the potential attack of the
olive fly (Bactrocera oleae), which causes extensive dam-age. This can be done indirectly by monitoring the daily temperature at the farm scale. In fact the biology of this insect is strongly related to the temperature gradient (9◦C is the biological baseline); thus when a specific location reaches a critical thermal sum (accumulation of specific amount of thermal units), the insect can complete its biolog-ical cycle and the fly attack begin. This critbiolog-ical thermal sum for olive fly is about 379◦(http://www.agrometeorologia.it/ documenti/Aiam2000/21_DiLena.pdf).
In Fig. 7 we report a composite figure showing how farm 1 and farm 2 can be monitored by their farmers to know “in real time through the Web” and in any to-be-investigated periods the min and max daily temperatures (daily rainfall is also supplied as a Supplement).
Each farmer can thus evaluate whether his farm reaches a critical threshold for fly attack and can act accordingly.
3.2.2 Environmental protection (environmental dashboard)
Applications for environmental protection allow multidisci-plinary, multi-stakeholder land planning and land manage-ment for a series of issues relevant to Valle Telesina. In comparison with the agriculture tool, the potential multiscale component of the system is less important here because of the specific type of user. To explain this issue, here we must highlight that in Italy the theme of environmental protection (with the exception of floods and landslides) is typically ad-dressed by (i) one specific category of end user, namely pub-lic regional bodies (e.g. Campania region, river basin author-ity, Comunità Montana), and (ii) by analysing rather coarse spatial scales (often from 1:50 000 to coarser). This is be-cause they typically try to produce aggregated planning and management solutions.