EFFECT OF TEMPERATURE ON THE
DEVELOPMENT OF THE WHEAT GRAIN
BY P. N. WATTAL
Division of Botany, Indian Agricultural Research Institute, New Delhi
ONE of the chief reasons for the low yield of wheat crop in India is the limit imposed by the shortness of the growing season· which is largely conditioned by temperature. Howard (1924) pointed out that 'Wheat growing in India is a gamble in temperature'. 'After the monsoon, the sowing of wheat is regulated by the point reached in the gradual cooling of the seed-bed. Towards harvest, the crop has to ripen under a rapidly ascending temperature when hot dry winds are frequent. At both ends, therefore, the growth period is temperature-limited, a fact which not only restricts the choice of varieties to early-maturing types which grow rapidly, but also influences the geographical distribution of the crop.' It is, therefore, obvious that a physiological analysis of the effect of temperature on the growth and development of the wheat plant would lead to a better understanding of the adapta-tion of the wheat crop to the varied temperature condiadapta-tions and to means for improving production.
Chinoy (1947) experimentally confirmed the observation made by Howard (1924), when he showed that in late-flowering varieties grain developed at progressively increasing temperature and decreasing humi-dity and consequently both 1,000 grain weight and grain yield per plant diminished. Chinoy and Sharma (1958, 1959) measured the length, breadth and thickness of the developing grain of varieties different in regard to time of flowering and concluded that the final values of all the three dimensions were apparently dependent upon the length of growing period and that external conditions, such as temperature and humidity, are mainly responsible for under-developed and empty grain.
Sharma (1946) studied the relation between the entry of reserve materials into the grains and cell division by taking the ratio of dry weight to the length of the grain on successive occasions. He found that the course of grain filling is relatively more gradual in early varieties due to prevailing relatively lower temperature and consequently greater amount of reserve carbohydrates are laid per cell as compared to late varieties which are compelled to develop their grains in a high range of temperature.
146
weight by 11 · 9 and 15 · 9 per cent. respectively ( cf Asana and Williams, 1965). Asana and Williams (1965), working at the controlled Environ-ment Research Laboratory, Canberra, found a mean reduction in yield of 16·4 per cent. for 6° C. rise in 'day' temperature, between the limits 25 to 31 o C., but the five cultivars did not differ significantly in their response to these temperatures.
A study of the effect of temperature on grain development in a few other varieties was considered desirable. Varieties N.P. 823 and Ridley (Australian) were chosen for the purpose. The choice of these two varieties was based on an observation made in an agronomic trial at Delhi (cf Wheat Workers' Seminar, I.A.R.I., 1961). It was found that Ridley yielded higher than N.P. 823 when sown early and lower than the latter when sown late. However, the average yield of Ridley, over two sowings, was equal to that of N.P. 823 (Table I, personal communication). Since Ridley comes to ear about a fortnight later than N.P. 823 and its grain obviously develops under relatively higher temperature levels, it was of interest to find out whether Ridley had a better tolerance of high temperatures. In the present experiment the relation between temperature and grain development in these two wheat varieties was investigated by altering the time of sowing, and also synchronizing their time of earing.
TABLE I
Grain yield per acre in maund
Date of sowing i 2.5-10-1960 i 25-ll-1960 1
- - - - ---~~-Variety :
N.P. 823 Ridley
Mean of sowing
(l Maund=82·2 lb.)
-'
.. I
..
24·66 28·55 26•61
MATERIAL AND METHODS
22·69 18·46 20·58
Mean of vmiety
23•68 23·51
The experiments were carried out on two wheat varieties
(T. aestivum), N.P. 823 and Ridley (Australian), under natural outdoor
Main shoots in all the pots were tagged after the emergence of the flag leaf and the dates of anthesis in their ears were carefully noted. Only four leaves on each main shoot were retained, as the lower leaves were more or less yellow by that time; these lower leaves were removed along with the leaf-sheaths. This was done in order to obtain as far as possible a uniform photosynthetic surface of leaves and stem to begin with. All the pots were watered regularly in order to keep the soil moisture as near field capacity as possible.
Six main shoots of each pot constituted one replicate. The pots were grouped beforehand for different samples, care being taken to see that the average date of anthesis in these groups was more or less similar. Sampling was done in the morning at about 9 · 00 A.M. The shoots were cut just at the soil level. Leaf-blades, ears (cut at the junction of lowermost spikelet and the peduncle) and stem along with leaf-sheaths of six mother shoots of each replicate were cut separately. The material was dried in an oven at 80° C., weighed and stored in air-tight tins for further work.
Percentage of ear greenness was estimated visually after spreading them on a sheet of white paper. The length of green portion of stem was measured and then expressed as percentage of total stem length. While counting the number of green leaves, more than half-green leaves were taken as fully green and less than half-green as fully yellow. In this way percentage of leaf greenness was calculated.
The effect of temperature on grain development was studied by sowing the two varieties on two different dates. Since Ridley is a comparatively late variety as compared to N.P. 823, the second sowing was so adjusted as to synchronize the anthesis of early-sown Ridley with late-sown N.P. 823. As such the grain development was studied under the same as well as different temperature regimes. These details are given in Table II.
TABLE II
Time of sowing and anthesis*
Sowing Variety
I
Date of
I
Date of 150% sowing anthe~isEarly (D1) N.P. 823 115-ll-1961 18-2-1962
Ridley
I
,, 6·-3-19(i2 Late (D2 ) .. I N.P. 823 7-12-1961 4-3-1962
Ridley
I
16-3-19(~
Five samples (excluding the final sample at maturity) were taken during the course of grain development as shown in Table III. Each sample consisted of five replicates, but the final sample at maturity had 15 pots for each treatment.
Sample Time of sowing
Late (D2 )
TABLE III
Particulars about samples
- - -
---~---Variety
N.P. 823
Ridley
N.P. 823
Ridley
8 8 8 8
Days after anthesis
17 17 17 17
26 23
25
!3 33
29
29
27
38
34
34
31
Calculation of the functional period of different organs of the shoot.-The values of percentage greenness of leaves, stem and ear from the different samples were plotted against time (days after anthesis). The area within the curve was measured in each case and was regarded as the functional period of each organ. The functional periods for the other three treatments were further calculated as percentage of the treatment combination N.P. 823 (D1), which gave the highest grain
weight.
The means of maximum and minimum temperatures during the intervals between different samples were calculated from the records maintained at the Meteorological Observatory of the Institute. Sugars were extracted by the method described by A sana and Saini (1962) and estimated according to the method of Somogyi (1945).
EXPERIMENTAL RESULTS
Increase in dry weight of shoot.-As the total shoot weight increased from S1 to S2, the effect of temperature and variety on increase in dry
matter (net assimilation) was determined. Pooled analysis of the data on shoot weight (including ear) showed that [Table IV (a)] :
(i) the mean shoot weights of the two varieties did not differ significantly;
(ii) the mean shoot weight was significantly less in D2 than in D1;
(iii) the mean shoot weight at s2 was greater than at sl;
149
in the first sowing only, and the absence of this difference in D2 may be attributed to much higher temperature io which Ridley was exposed in the second sowing (D2) [refer Table
IV (e)];
(v) since the variety x sample (V X S) interaction was not significant, the increase in shoot weight from
sl
tos2
was similar in both the varieties;(vi) the interaction, sowing date X sampling occasion, (S X D) was not significant and as such the increase in shoot weight from S1 to S2 was similar in both the sowings. Since the
temperature conditions were quite high in D2 , it appeared
that net assimilation during the period
sl
tos2
was not affected by temperature.It may be concluded that (i) the shoot weight increased significantly between 8 and 17 days from anthesis; (ii) the mean shoot weight in D2 was less than that in D1 probably because of the higher temperature in D2 (the mean maximum/minimum temperatures for D1 and D2 were
TABLE IV
Comparison of the data of samples S1 and S2
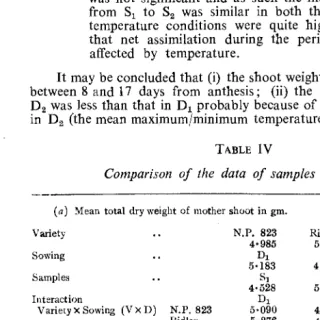
(a) Mean total dry weight of mother shoot in gm. Variety
Sowing Samples Interaction
VarietyXSowing (VxD) N.P. 823
Ridley
N.P. 823 4•985 D1 5·183 SJ 4·528 D1 5·090 5·276
(b) Mean dry weight of grains per ear in gm.
Variety N.P. 823
0•548
Sowing D1
0·540
Samples s1
0·244
Interaction s1
Variety X Sample ( V X S) N.P. 823 0·216
Ridley 0·272
Interaction 01
Variety X sowing ( V X D) N.P. 823 0·490
Ridley 0•590
Interaction D1
Sowing X Sample ( S X D) s1 0·205
s2 0•876
Ridley 5·003 D2 4•805 s2 5·461 D2 4•880 4·731 Ridley 0·6911 Dt 0·707 s2 1·003 s2 0•880 1·126 D2 0·606 0·808 D2 0·283 1•130
C.D. @5% P
N.S.
0·141
0·141
0·199
C.D.@ 5% P
TABLE IV-Contd.
(c) Mean dry weight of stem of mother shoot in ~:m.
Variety Sowing Interaction
Variety X Sowing (Vx DJ N.P. 823 Ridley
N,T'. 823 3·128 Dt 3·331 Dt 3·290 3·371
(d) Mean dry weight of chaff of ear in ~:m. Variety
Sowing Samples Interaction
VatietyXSowing (VxDJ N.P. 823 1\idley
N.P. 823 0·789 Dt 0·722 s1 0·664 Dt 0·824 0·620
(t) Mean maximum and minimum temperature
°
C.Ridley 3•022 Dz 2•820 Dt 2·9G6 2•Gt:'l Ridley 0·627 D" 0·694 s2 0·752 D2 0·754 0•634 Variety Sowing
N.P. 823 26·5* (ll·1)t
Dt Samples
* Maximum temperature.
t Minimum temperature.
N.P. S23 Dt
D2
Ridley Dt
D2
N.P. 823 Ridley N.P. 823 1\.idley
26·5 (11·2) St 26·4 (10·7)
St 24·5 (10·9) 25·4 ( 9·1) 25·5 ( 9·5) 30·3 (13·3)
S1
25•0 (10·0) 27·9 (11·')
D1
25·1 (11·1) 27·9 (11·4)
D1
25·0 (10·2) 27·9 (12•2)
C.D.@ i5% P 0·101 0·101
0·143
C.D. (ri), 5 'fr P 0•019 0•019 0·019
0•027
Ridley 29·7 (12·7)
D2
29·7 \12·6)
s2
29·6 (13·1)
s2
25·6 (11·2) 30·1 03·2) 30·2 (13·2) 32·6 (14·7)
s2
27·9 (l2•2) 31·4 (14·0)
D2
27·8 (ll·2) 31·5 (14·0)
D2
27·9 (ll·2) 31·4 (14·0)
151
Dry weight of grains per ear.-The pooled analysis of the data [Table IV (b)] indicated that :
(i) the mean grain weight of Ridley was significantly higher than that of N.P. 823;
(ii) the mean grain weight in D2 was significantly higher than that
in D1 probably due to higher temperature conditions under D 2
[Table IV (e)];
(iii) the mean grain weight at S2 was significantly more than at
S1 ; and
(iv) the effects of interactions variety x sampling occasion (V x S), variety x sowing date (V X D) and sampling occasion X sowing date (S x D) on grain weight were significant.
The relatively larger difference between the grain weights of the two varieties at S2 (than at S1) may be associated with the relatively
larger difference between temperatures at S2 [Table IV (e)]. Since the shoot weights were not similarly affected, it may be inferred that temperature differences had perhaps more direct effect on grain development.
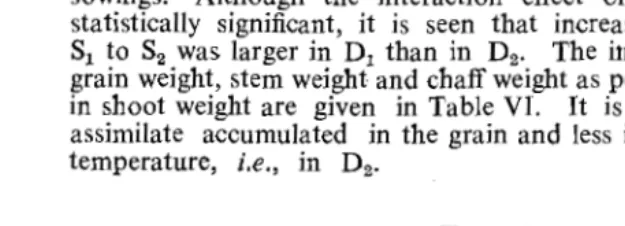
Although the interaction effects on stem and chaff weights were not statistically significant, it is seen that increase in both stem and chaff weights was relatively less from S1 to S2 for variety Ridley (Table V).
This would mean that more of assimilate produced during the period S1 to S2 was diverted to the grains of Ridley.
TABLE V
Increase in dry weight in gm. of grains, stem, etc., from S1 to S2 as percentage of increase in shoot weight (Mean of both sowings)
Variety Grain weight Stem weight Chaff weight
N.P. 823
74·0
15·8
12·0
Ridley
87•9
5·0
7·0
The difference between grain weights of the two varieties was larger m D2 than in D1 (V X D interaction).
The V X D interaction on dry weights of stem and chaff were statistically significant [Table IV (c) and (d)] and showed the following effects:
(ii) N.P. 823 had less chaff weight in D2 than in D1o while Ridley had the same chaff weight under both sowings.
The shoot weight was much less in D2 than in D1 • The difference
between the shoot weights in D1 and D2 was much larger for Ridley
than for N.P. 823.
The much larger grain weight for Ridley in D2 may be ascribed to the higher temperature to which it was exposed as compared to N.P. 823. The higher temperature in the case of Ridley in D2 evidently led to much smaller growth of the stem as compared to N.P. 823, and relatively more material was diverted towards its grain development.
The increase in grain weight from S1 to S2 was greater in D2 than
in D1 (S X D interaction).
The increase in shoot weight from S1 to S2 was equal under both
sowings. Although the interaction effect on stem weight was not statistically significant, it is seen that increase in stem weight from S1 to S2 was larger in D1 than in D2• The i11creases from S1 to S2 in
grain weight, stem weight and chaff weight as percentages of the increase in shoot weight are given in Table VI. It is seen that more of the assimilate accumulated in the grain and less in the stem at the higher temperature, i.e., in D2•
TABLE VI
Increase in dry weight of grains, stem, etc., from S1 to S2 as percentage
of increase in shoot weight (Mean of both varieties)
Sowing Grain weight Stem weight Chaff weight
74·8
Hi·2
10·0
87·4
4·6
8·8
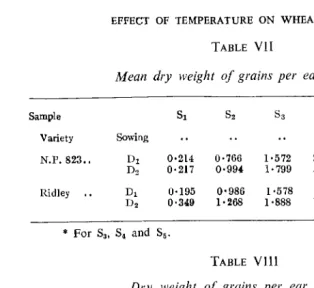
The course of grain development.-The data on dry weight of
grains on various sampling occasions are presented in Table VII.
In order to find out the time at which grain development was com-pleted in each case, the data of the last three samples were statistically analysed. It will be seen that grain weight continued to increase until S5, i.e., upto 38 days from anthesis in N.P. 823 (D1) only; in N.P. 823
(D2) and Ridley (D1) there was no increase after S4 , i.e., after 29 days, and in Ridley (D2) after S3, i.e., 23 days after anthesis. The final grain
TABLE VII
Mean dry weight of grains per ear in gm.
Sample s1
s2
Sas4
s5
C.D.*
5% p Variety Sowing
N.P. 823 .. lh 0•214 0·766 1·572 2·182 2·304 0·108 Dz 0·217 0·994 1· 799 2·028 2·012 0•160
Ridley D1 0·195 0·986 1·578 2·075 2•168 0•215 D2 0·349 1·268 1·888 1·8!4 1·973 N.S.
* For S3 , S4 and S5 •
TABLE Vlll
Dry weight of grains per ear in gm.
Variety Sowing Sample Final harvest
N.P. 823 D1 (So) 2·304 2•263
D2 (S4) 2·028 2·059
Ridley D1 (S4) 2·075 2·055
D2 (Sa) 1•888 1·893
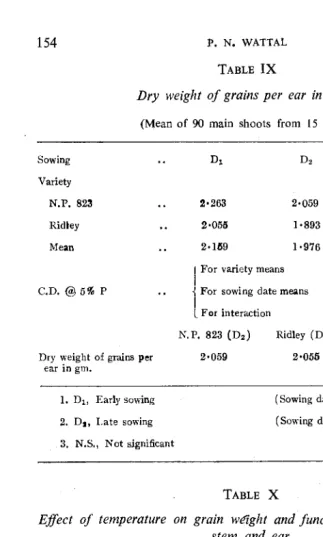
Final grain waight.-The data on final grain weight per ear of the
mother shoots (final harvest pots) at maturity are presented in Table IX. The mean grain weight per ear in the earlier sowing was signifi-cantly higher than that under late sowing. N.P. 823 yielded signi-ficantly more than Ridley. The grain weights of N.P. 823 (D2) and Ridley (D1) were the same apparently because grain development in
these two cases occurred under similar temperature conditions (Table X).
Relation between the final grain weight, temperature and functional
period (photosynthetic sw:face) during the post-anthesis
period.-Taking grain weight and functional period for N.P. 823 (D1) as 100
the relation is shown in Table X. It will be seen that the grain weight in N.P. 823 (D1) was the highest apparently due to the greater length
154
TABLE IX
Dry weight of grains per ear in gm.
(Mean of 90 main shoots from 15 pots)
Sowing Variety
N.P. 823
Ridley Mean
C.D.@ 5% P
Dry weight of grains per ear in gm.
1. D1, Early sowing 2. D1 , Late sowing 3. N.S., Not significant
2•263
2·055
2·159
2·059
1·893
1·976
I
For variety means1 For sowing date means
I
l For interaction N.P. 823 (D2)
2•059
Ridley (Dt!
2•055
Mean
2·161
1·974
0•070
0·070
N.S. C.D.@ 5% P
N.s.
(Sowing date : 15-ll-1961)
(Sowing date : 7-12-1961)
TABLE X
Effect of temperature on grain wt!ight and functional period of leaves, stem and ear
Mean temperature Functional penod
during grain development
Grain period °C. Variety Sowing weight
I Stem Ear Leaves Total
Max.
I Min.
27•6 12·0 N,P. 823 D1 100·0 100·0 100·0 100·0 100·0
29·7 12·6 Dz 90·9 78·1 90·8 89·2 86·0
29·9 12·9 Ridley D1 90·8 78·9 89·4 106·3 91·5
155
DISCUSSION
Relation between increase in dry weight of· the whole shoot (net assimialation) and that of the grains per ear between 8 and 17 days from anthesis.-Since the whole shoot increased in weight during the first fortnight from anthesis, this increase in dry weight may be regarded as a measure· of net assimilation per shoot. In view of the fact that all the photosynthetic organs of the shoot were equally green during 8 to 17 days from anthesis under the temperature regimes in D1 and
D2 (27·9/12·2 and 31·4/14·0° C.) and with the general experience that
Q10 of photosynthetic rate does not d~viate_ materially fro11;1 unity
between 20 and 30° C. at the carbon dioxide concentration of normal air (cf Thomas, 1955) it is likely that the rate of photosynthesis was more or less similar in D1 and D2 • This suggestion is borne out by
the fact that the increase in dry weight of the whole shoot between 8 and 17 days from anthesis was similar in both the sowings [Table 4 (a),
interaction sampling occasion X sowing date, not significant)]. The increase in grain weight, on the other hand, was greater in D2 than in
D1 [Table 4 (h), interaction sampling occasion X sowing date, S
x
D,significant)] which indicates that temperature directly influenced the processes of grain development. The higher temperature conditions in D2 probably increased the rate of cell division and other
develop-mental processes in the grain, and therefore greater movement of assimi-lates to the developing grains, as indicated by the fact that there was relatively less increase in the weight of stem and chaff in D2 than in
D1 (Table VI).
Influence. of temperature on final grain weight.-When the two varieties were sown together at the normal time (D1), anthesis occurred
later in Ridley than in N.P. 823 and its grain developed at relatively higher temperatures. The mean max.fmin. temperatures during the period of grain development for Ridley and N.P. 823 were 29 ·9/12 ·9 and 27·6/12·0° C. respectively. When the sowing was done 22 days later (D2) anthesis of late-sown N.P. 823 almost synchronized with that of early-sown (D1) Ridley, and, therefore, grain development in
both the varieties occmred under almost the same temperature con-ditions (29·7/12·6 and 29·9/12·9° C. respectively). However, anthe-sis occurred still later in the second sowing (D2) of Ridley and its grain developed at still higher mean max.jmin. temperatures (32 · 3/15 ·5° C). The efleds of these different temperatures during the grain development period were reflected in the final grain weights. The mean final grain weight of N.P. 823 (over two sowings) was more than that of Ridley and that of the first sowing (D1) was more than that of the second
(DJ (Table IX). Further the final grain weights of N.P. 823 (D2)
and Ridley (D1) were similar apparently because their grains develpped
under similar temperature conditions; it appears therefore that these _ two varieties would respond similarly to_ variation in temperature, although observatipns on grain development in Ridley at a lower tem-perature and on that of N.P. 823 at a higher temtem-perature would be required to establish this conclEsion finally.
Our observations on the effect of temperature during the ripening period on grain yield are in general conformity with those reported by Waldron (1931) and Chinoy (1947) under natural conditions, and. of Asana and Williams (1965) under' controlled conditions. 1he present investigation under natural condi1ions showed that the two varieties responded similarly to temperature; and further that since the varia-tion in mean minimum temperature was much smaller than that in mean maximum temperature, 'day' temperatures were perhaps largely involved in this effect. Asana and Williams (1965) also found no significant effect of 'night' temperature on grain weight.
On the assumption that the two varieties respond alike to tem-perature, four values for mean maximum temperature and grain weight were available for calculating the regression of grain weight on tem-perature (Table X, Fig; 1). This showed a mean reduction in grain yield of 17 · 3% for a rise of 5° C. in the mean maximum temperature. Asana and Williams (1965) reported that a rise of 5° C. in mean maximum temperature (between the limits 24·2 and 32·3° C.) decreased the 1,000 grain weight by 11·9 and 15·9% respectively in Pb.C. 281 and N.P. 720, under outdoor conditions at Delhi. Under controlled conditions, at Canberra, they found a mean reduction in yield of 16 ·4 %for 3 60 oc~
rise in 'day' temperature.
-tOO-"'
-
Y : 194 • 8 6 - 3 • 46 Xu
0 95
~.c)
0 N.P. 823
( o,,
:z:·
~~
•
N.P, 8 23 ( 02)1&1
RID LEV
( o,)
-~ ~ 90 ~
zo
•
RIDLEY (02)<(O
o:-(.!)_,
65
<( ~eo
28 29 30 31 32 33
_;: . 0
TEMPERATURE
C
' J ' i
FJG. 1. -Effect of mean maximum temrerature on grain weight (100 for 27 ·6o C.).
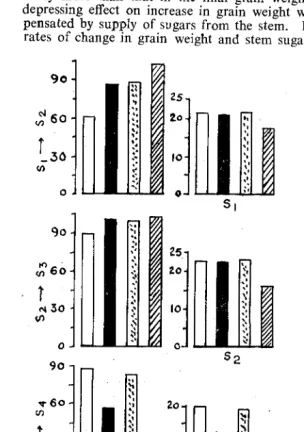
Thedata on senescence perhaps provid~ a partial explanation of the ~ffe.ct ()f temperature stress on grain yield (Table X). A fairly close
157
in temperature to 32 · 3° C. the decrease in functional period was rela-tively more than that in the final grain weight. It is likely that the depressing effect on increase in grain weight was perhaps partly com-pensated by supply of sugars from the stem. In Fig. 2 are shown the rates of change in grain weight and stem sugars. It will be seen that
90 ~60 0 9o 0 90 'f'60 fJ)
t
30 to f/)0
'ii
..
..
..
r-
..
.,..
~·
..
:! ·: ;. •:..
..
... ~ r- .,..
:· ,
.
.
,•·
..
•' •' ~~..
.•
..
·"
~.
..
.....
~ •'I
~
~
~
25 to ro 0 Z5 %0 10 0.
.
2o.,
..
~·..
..
'..
~· •',
.
..
•!CHANGE OF GRAIN WEIGHT
PER OAY
10 0
.--
r;;:·
.
', '•..
~· •' ... ... ~!..
s,
r- r.-,.
•' •'
I
•' .;:·
•! '..
:: ..:....
S.f PERCENT SUGARCONTENT STEM
0
NP 623o,
•
"'Pa
2.302
8
RIDLEYo,
~ RIDLEY 02
N ~
0
•
[;;::!m
t:
1
-15
CHANGE OF STEM SUGAR
CONTfNT PER p.-.y
FIG. 2. Relation between rates ofchanges in grain weight. and stem ~ugan; in mg/day.
158
the rate of decrease in stem sugars was the highest for Ridley (D
2-32·30 C.) between S2 and S3 • There is also a good correspondence
between the rates of increase in grain weight and of decrease in stem sugars for N.P. 823 (D1), N.P. 823 (D2) and Ridley (D1) between S3
and S4 •
AcKNOWLEDGEMENT
The data incorporated in this article formed a part of the thesis approved in partial fulfilment of the requirements for the M.Sc. degree of I.A.R.J., New Delhi. I wish to express my deep sense of gratitude to Professor R. D. Asana, Professor of Botany, for guidance during the progress of this investigation and in the preparation of the paper and to Dr. M.S. Swaminathan, Head ofthe Division of Botany, I.A.R.I., for continued inspiration and interest in the progress of this investi-gation.
SuMMARY
The effect of temperature on grain development in two wheat varieties, Ridley (Australian) and N.P. 823 (Indian) was studied by suitable alterations in the time of sowing. The two varieties responded similarly to variation in temperature and with 5° C. rise in mean maximum temperature, during the whole period of grain development, the grain weight decreased by 17·3% (between 27·6 and 32·3°C.).
During the first fortnight from anthesis the increase in total dry weight of the shoot was not affected by temperature, whereas the grain weight increased with increase in temperature (from 27 ·9 to 31 ·4° C.). Temperature had apparently more direct influence on the processes of grain development.
Increase in temperature appeared to hasten yellowing of leaves, stem and ear and, therefore, to reduce photosynthetic activity much more than the rate of grain development. It is suggested that grain development was compensated by supply of sugars from the stem, particularly during the later stage.
REFERENCES
ASANA, R. D. AND SAINI, A. D. (1962). Studies in physiological analysis of yield. V. Grain development in wheat in relation to temperature, soil moisture and changes with age in the sugar content of the stem and in the photosynthetic surface. Indian J. Plant Physiol., 5, 128-71.
- - AND JosEPH, C. M. (1964). Studies in physiological analysis of yield. VII • Effect of temperature and light on the development of the grain of two varieties of wheat. Ibid., 1, 86-101.
•
CHINOY, J. J. (1947). Correlation between yield of wheat and temperature during ripening of grain. Nature, 159, 442-44.
- - AND SHARMA, S. N. (1957). The development of grain in cereals. Varietal differences in the growth of wheat grains in three dimensions and the influence of external conditions. Agrobiology (Russian), No. 3, 32-41. Pit. Breeding Abst., 28, Item 1526 (1958).
- - - . (1958). Development of the kernel in cereals. II. Varietal diffe-rences in the process of grain filling and desiccation as affected by temperature. Ibid., No. 2, 53-65. Pit. Breeding Abst. 29, Item 1396 (1959).
HOWARD, A. (1924). Crop-Production in India : A Critical Survey of Its Problems. Oxford University Press, Humphrey, Milford.
SHARMA, S. N. (1946). Effect of temperature on the development of wheat grain . Thesis Assoc. l.A.R.I. (1944-46).
SOMOGYI, M. (1945). A new reagent for the determination of sugars. J. Bioi. Chern., 160, 61-68.
THOMAS, M. D. (1955). Effect of ecological factors on photosynthesis. Ann. Rev' .Plant Physiol., 6, 135-56.
WALDRON, L. R. (1931). Frost injury to spring wheat with a consideration of drought resistance. Jour. Amer. Soc. Agron., 23, 625-37.