www.atmos-meas-tech.net/10/979/2017/ doi:10.5194/amt-10-979-2017
© Author(s) 2017. CC Attribution 3.0 License.
Plume propagation direction determination with SO
2
cameras
Angelika Klein, Peter Lübcke, Nicole Bobrowski, Jonas Kuhn, and Ulrich Platt
Institute of Environmental Physics, University of Heidelberg, Heidelberg, Germany
Correspondence to:Angelika Klein ([email protected]) Received: 18 August 2016 – Discussion started: 28 October 2016
Revised: 3 February 2017 – Accepted: 6 February 2017 – Published: 10 March 2017
Abstract.SO2cameras are becoming an established tool for
measuring sulfur dioxide (SO2) fluxes in volcanic plumes
with good precision and high temporal resolution. The pri-mary result of SO2 camera measurements are time series
of two-dimensional SO2 column density distributions (i.e.
SO2column density images). However, it is frequently
over-looked that, in order to determine the correct SO2 fluxes,
not only the SO2 column density, but also the distance
be-tween the camera and the volcanic plume, has to be precisely known. This is because cameras only measure angular ex-tents of objects while flux measurements require knowledge of the spatial plume extent. The distance to the plume may vary within the image array (i.e. the field of view of the SO2
camera) since the plume propagation direction (i.e. the wind direction) might not be parallel to the image plane of the SO2
camera. If the wind direction and thus the camera–plume dis-tance are not well known, this error propagates into the de-termined SO2 fluxes and can cause errors exceeding 50 %.
This is a source of error which is independent of the fre-quently quoted (approximate) compensation of apparently higher SO2 column densities and apparently lower plume
propagation velocities at non-perpendicular plume observa-tion angles.
Here, we propose a new method to estimate the propaga-tion direcpropaga-tion of the volcanic plume directly from SO2
cam-era image time series by analysing apparent flux gradients along the image plane. From the plume propagation direc-tion and the known locadirec-tion of the SO2source (i.e. volcanic
vent) and camera position, the camera–plume distance can be determined. Besides being able to determine the plume prop-agation direction and thus the wind direction in the plume region directly from SO2 camera images, we additionally
found that it is possible to detect changes of the propaga-tion direcpropaga-tion at a time resolupropaga-tion of the order of minutes. In addition to theoretical studies we applied our method to
SO2flux measurements at Mt Etna and demonstrate that we
obtain considerably more precise (up to a factor of 2 error reduction) SO2fluxes. We conclude that studies on SO2flux
variability become more reliable by excluding the possible influences of propagation direction variations.
1 Introduction
Prediction and monitoring of volcanic events is highly sirable. Besides conventional methods, like seismicity or de-formation measurements, continuous monitoring of volcanic gas emissions is a still relatively new method for predicting volcanic eruptions. The four most common changes in vol-canic behaviour preceding an eruption are earthquakes, de-formation, thermal anomalies and an increase in degassing of the volcano. Moreover, not only can an increase in degassing behaviour be an indicator of an imminent eruption, but so can a change in the composition of the volcano’s degassing (see e.g. Bobrowski et al., 2015).
For short-term as well as long-term monitoring of vol-canic degassing behaviour, in situ and remote-sensing tech-niques have been developed. While in situ techtech-niques, such as alkaline traps and MultiGAS (Noguchi and Kamiya, 1963; Aiuppa et al., 2007) have been successfully applied, remote-sensing techniques have the particular advantage that they can be applied from a safe distance. Remote sensing started with the correlation spectrometer (COSPEC, Moffat and Mil-lan, 1971 and Stoiber et al., 1983) but more recently the dif-ferential optical absorption spectroscopy (DOAS) technique (Platt and Stutz, 2008) is applied to volcanoes. Long-term remote-sensing monitoring of the SO2flux (e.g. by the
from the normal activity can be used to predict eruptions. More recently, the SO2camera (e.g. Mori and Burton, 2006)
that can record two dimensional SO2column density
distri-butions allowed unprecedented insight into chemical and dy-namic processes in volcanic plumes.
The SO2camera is a UV sensitive camera utilizing one or
more band-pass interference filters to measure the extinction optical density (OD) of SO2. One of those interference filters
has a central transmission wavelength at about 310–315 nm. This filter is used to determine the light extinction mainly due to SO2and aerosols. The light extinction due to aerosol
exhibits a broadband structure when compared to the nar-rowband structure caused by the light attenuation due to SO2.
Therefore, a second filter is applied with a central wavelength of approximately 330 nm, where the SO2absorption is
negli-gible, but which is close enough to cause only small changes in light extinction by aerosol (Lübcke et al., 2013). From the logarithm of the (suitably normalized) pixel-per-pixel ratio of two images taken through either filter, images of the SO2
OD can be calculated. The SO2OD in turn is proportional to
the SO2column density along the line of sight.
The propagation velocity of the plume and the distance between the plume and the camera are two important vari-ables used to determine the SO2flux from volcanoes using
imaging data. Usually the apparent propagation velocity (i.e. the angular velocity) of the plume can be derived directly from the camera image series. For that purpose, one corre-lates two integrated transects of the trace gas slant column density images of the moving plume and determines the time lag between the two signals (McGonigle et al., 2005). One can determine the velocity of the plume from the time lag, the angular distance between the two image columns and the distance of the plume. While this method is simple to imple-ment, it only provides a spatial and temporal mean propaga-tion velocity that neglects, for example, turbulence or prop-agation velocity variations over the extent of the plume. A more detailed plume velocity determination can be achieved using optical flow algorithms (Kern et al., 2015b). These al-gorithms determine the displacement of image intensity val-ues for each pixel from one frame to the next frame, thus giv-ing a detailed spatial and temporal plume velocity estimation if the direction of the plume is known.
In any case, an important prerequisite for the determina-tion of absolute trace gas flux values is the precise knowledge of the distance between the plume and observing instrument (usually the SO2camera).
This distance is usually more difficult to (precisely) deter-mine than it is generally assumed: while the geographic lo-cations of the volcanic gas source (i.e. usually the crater) and the position of the instrument are almost always precisely known, the plume propagation direction (like the plume ve-locity) is not. It is advantageous to know the propagation direction of the plume to achieve a good estimation of the plume distance. This usually requires additional measure-ments, which are often hard to make at volcanoes due to
the limited infrastructure. This paper is about the possibility of determining the plume propagation direction itself from a time series of SO2camera images of a volcanic plume.
2 Theory
The trace gas flux8is approximated from 2-D imaging data following the equation
8=v·X i
hi·Si. (1)
here,vis the propagation velocity of the plume perpendicu-lar to the viewing direction,hiis a side length of a pixel at the distance of the plume andSi denotes the SO2column
densi-ties of each respective pixel. The summation of the length of every pixel in the plume transect gives the overall diameter of the plume. The summation over every column density of these pixels gives the column density of the complete tran-sect.
If the volcanic SO2plume moves within the image plane,
the camera captures a scaled image of the field of view (FOV) of the camera image, with a scaling factor that is dependent on the plume distance. Thus, the diameter of the plume and its propagation velocity can be easily calculated once the plume distance is known. In a simplified approach which ne-glects radiation transport issues (as described e.g. by Kern et al., 2010) the column densitiesSi depend linearly on the length of the light path through the plume. For a cylindri-cally symmetric plume moving parallel to the object plane, the detector pixels at the centre of the plume capture column densities corresponding to the SO2concentration integrated
along the plume diameter, while the detector pixels towards the border of the plume capture the light path along secants of the plume (see Fig. 1). Since the secants are not exactly parallel to the radius this causes an overestimation of the measured SO2column densities towards the edges of the
de-tector. Furthermore, if the plume is inclined (by the angleα, see Fig. 1) with respect to the image plane, deviations in the SO2flux determination of the plume will occur even in the
centre of the image plane. In the following sections different approaches to take the geometry into account during the cal-culation of SO2fluxes will be discussed. The angle between
the image plane and the tilted plume will be referred to as inclination angleα. The inclination of the plume changes all the measured variables in Eq. (1).
2.1 Small FOV angle approach
In a first simplified approach for a small FOV angle of a few degrees, the inclination deviations are negligible (below 10 % change in SO2flux atαsmaller than 2◦). Figure 1 shows a
schematic sketch of the geometry of the set-up of an inclined plume. The actual plume extent inx directionxR of a tilted plume imaged with the SO2camera is longer than the
2
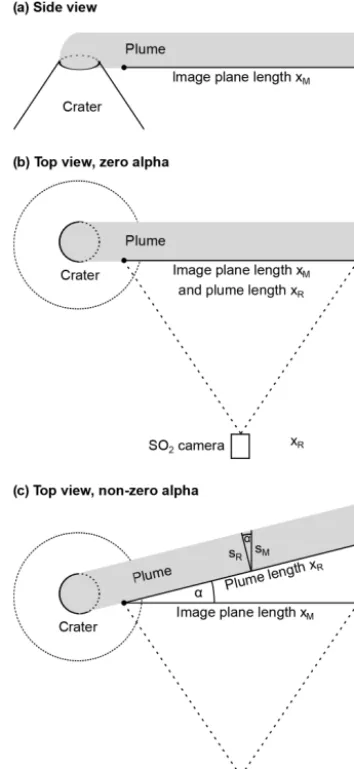
Figure 1.Schematic view on the influence of the inclination of the plume on the measured variables for the SO2 flux determination
for an SO2camera with a small FOV angle.(a)Side view of the
volcanic plume and(b)top view of a volcanic plume parallel to the image plane,(c)top view of a plume inclined with respect to the image plane.
calculated as xR= xM
cosα. (2)
The true plume velocityvR(inxdirection) depends linearly on the plume extent (vR=xR
t = xM cos(α)t =
vM cos(α)).
In contrast to the apparent underestimation of the plume velocity, the measured column densitiesSM for an inclined SO2plume are larger than the perpendicular column
densi-tiesSR. The column density correction follows the equation
SR=SM·cosα. (3)
The column densities depend linearly on the light path s through the plume in a first order approximation for a
ho-mogeneous plume with an SO2 concentration c(S=c·s).
Therefore, Eq. (3) can be rewritten as
sR=sM·cosα. (4)
In this first assumption (FOV≤2◦) the deviations in the ve-locity and in the column density would cancel each other out in the flux calculation (see Eq. 1) as already noted by Mori and Burton (2006). Only the apparent plume diameter hM (i.e. the vertical extent of the plume in the direction of they axis) would be affected and thus deviate from the true plume diameterhR, since the actual distance of the plume differs from the assumed distance, which causes a wrong scaling of the plume diameter on the image plane.
hR=hM+1
2·xM·tanα (5)
It should be noted that thexR andsR over- and underesti-mations nearly cancel each other out for SO2cameras with
a small FOV angle but also for a chosen small FOV angle within the large FOV angle of an SO2camera. However, the
distance of the plume still needs to be known to determine the correct plume diameter and thus also the information about the propagation direction of the plume is a necessary prereq-uisite even in this approach.
2.1.1 Large FOV angle approach
Usually, SO2 cameras have a relatively large FOV angleγ
(typically several 10◦, Fig. 2). Therefore, a more realistic ap-proach includes the angular aperture of the FOV in the deter-mination of the variation of the variables in Eq. (1).
For FOV angles of the SO2camera larger than 2◦, the
ap-parent plume extent inx direction and column densities are affected in a way that is different from the previous approach, when the plume is tilted with respect to the image plane (i.e. at non-zero alpha).
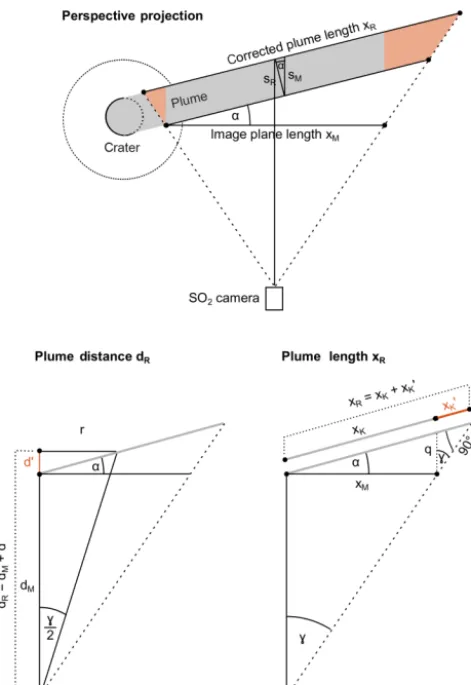
The plume length deviation equation (Eq. 2) changes if the FOV projection is taken into account. Additionally to the de-viationsxK of an orthographic projection (every distance is projected with the same magnification factor, see grey sec-tion in plume lengthxRin Fig. 2), the perspective projection leads to an addition of a lengthxK0 (see red section in plume lengthxR in Fig. 2) for a plume moving away from the ob-server (α >0) and subtraction ofxK0 (i.e.xK0 becoming neg-ative) if the plume moves towards the observer (α <0). The additional lengthxK0 can be calculated with the law of sines. xK=
xM
cosα (6)
xK0 sinγ =
q
sin(90◦−α−γ )=
xM·tanα
sin(90◦−α−γ ) (7) →xK0 = xM·sinγtanα
sin(90◦−α−γ ) (8)
xR= xM cosα·
1+ sinγsinα sin(90◦−α−γ )
Figure 2.Schematic sketch of the influence of a large FOV angle on the deviation of the plume lengthxRfrom the assumed plume length xMand on the plume distancedRfrom the assumed plume distance
dM. The additional distance the plume travels in comparison to the
case of a plume moving away from the camera (α=0) is marked in red. Here, only the case of a plume moving away from the camera (α >0) is shown.
Equation (9) can be rewritten as Eq. (10). Besides the scaling with cosαfrom the small FOV angle approach (see Eq. 2), an additional term describes the influence of the FOV angle γ onxR.
xR= xM cosα
1− tan(γ )tan(α) 1+tan(γ )tan(α)
(10) Additionally, the length of the slant beam through the plume is not only dependent on the tilt angleαbut also on the FOV angleγof the respective pixel following equation
sR=sM·cos
α+γ
2
. (11)
The distance of the plume also changes for every FOV angle in dependence of the inclination of the plume.
dR= r
tan γ2=tanα·r+dM (12)
r=tan
γ
2
tanα·r+tan
γ
2
·dM (13)
r·1−tanγ 2
tanα=tanγ 2
·dM (14)
r= tan γ 2
·dM
1−tan γ2
tanα (15)
dR=
tan γ2
·dM
tan γ2·
1−tan γ2
tanα (16)
dR=
dM 1−tan γ2
tanα (17)
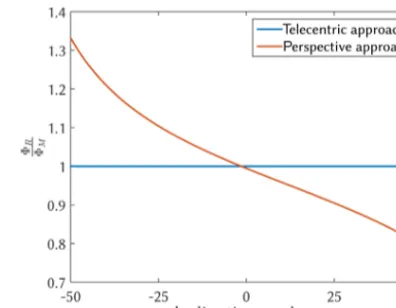
Figure 3 shows the deviations of the tilt-corrected values of the variables (with indexR) from the measured values of the variables (indicated by the indexM) as a function of the in-clination angleα. The distance of the plume in the midst of the FOV is known but since the direction of the plume is not known, the distances in other positions of the image are also not known. The camera’s FOV angle is chosen as 24◦ which is in the range of commonly used SO2 camera FOV
today (Kern et al., 2015a). The graphs show the deviations for half of the image plane from its centre to an angleγ /2 of 12◦where half of the image plane is assumed to be a sin-gle detector pixel. An orthographic projection (produced by a telecentric optical set-up; e.g. Jähne, 2005) leads to the blue lines in Fig. 3. Its characteristic is that an object is projected to be the same size independent of its distance to the cam-era. The red lines in Fig. 3 represent the deviations due to a perspective projection that is used in SO2camera
measure-ment set-ups. The projected size of an object is dependent on the distance for a perspective projection. Figure 4 shows the combined deviations that would influence the flux determi-nation.
These calculations cover half of the actual FOV angle of the camera. If the plume is inclined with the angleαtowards the image plane, it is tilted by a negative angle−αfor the respective other half of the FOV. Therefore the over- and un-derestimations of the actual SO2flux differ on both sides of
the field of view.
Usually the SO2camera detectors consist of several
hun-dred pixels. Equation (18) represents the deviations in the plume length and therefore in the plume propagation veloc-ity if the FOV angle is divided in a finite absolute number of pixelspfor every pixeliinp.
xR(i, xM)= xM cosα
1+i2 tanγtanα p−itanγtanα −(i−1)2 tanγtanα
p−(i−1)tanγtanα
(18) Equation (19) represents the deviations in the measured col-umn densities if the FOV angle is divided in a finite absolute number of pixelspfor every pixeliinp.
sR(i, sM)=sM·cos
α+tan−1
i−1 p tanγ
2
Figure 3.Mean deviations of the plume extent in thexdirection (xR), plume distance (dR) and column density (sR), used in the flux
determination for the right half of the image plane of an SO2camera
with an FOV angle of 24◦(for the left half of the detector the incli-nation deviations would be vice versa). The blue lines show the ratio between the ground truth (i.e. the geometric accurate) variables and the measured variables for a telecentric (an orthographic projection where the apparent size does not depend on the distance) approach. The red lines show the same ratio for a perspective approach.
−1 2·tan
−1
i ptanγ
(19) Equation (20) represents the deviations in the measured dis-tance for every pixelifor a tilted plume.
dR(i, dM)=
dM
1−tanαtanhtan−1i−1 p tanγ
−1
2·tan
−1i ptanγ
i (20)
If we want to determine the plume propagation direction, we can measure the SO2flux for a given distance at different
po-sitions of the plume. If the apparent SO2flux is the same at
different positions in the plume, the plume lies within the im-age plane. Otherwise we observe an apparent gradient in the measured flux across the image, which, however, contains in-formation on the plume propagation direction. Dividing the measured fluxes by the respective deviations for the investi-gated pixel columns for every possible tilt angleαand min-imizing the observed gradient yields the information about the mean plume propagation direction during the time period needed for the parcel to move across the field of view. The assumption that the SO2flux is conserved can be made since
the mean lifetime of SO2in the troposphere is usually of the
Figure 4.Combined deviations of the three variables of the flux determination for the right half of the image of an SO2camera with
an FOV angle of 24◦.
order of several days (e.g. Eisinger and Burrows, 1998) while the typical time for the plume to cross the field of view of the camera is of the order of a few minutes. Note that the SO2
flux originating from the volcano should vary for our method to work. The second necessary prerequisite is that the ad-vective transport is larger than the turbulent transport of the plume parcel. Kern (2009) showed that usually the turbulent transport only contributes to about 0.2 % of the gas transport in the plume.
Figure 5 shows the deviation in each measurement vari-able separately for an SO2camera, again with a typical FOV
of 24◦, while Fig. 6 shows the combined deviation of the flux measurement due to the perspective influence on the three variables. For an SO2camera with a typical FOV of 24◦the
deviations in the ratioxMxR easily exceed 50 % at plume direc-tion tilts of>30◦. As a consequence, the SO2flux deviation
already exceeds 10 % in parts of the SO2camera images for
a plume tilt angle larger than 15◦.
Equations (18), (19) and (20) are defined for the case that the best known distance between the observer and the plume is in the centre of the FOV. If the best known distance is not in the centre of the FOV, the equations can be adjusted since the distance correctiondRand the inclination velocity correction xRchange (see also Fig. 7).
With n as the number of pixels, the known position is shifted to the side of the FOV, we can derive the new dis-tance of the centre of the FOV as
dM0 =dM+dP (21)
dP =n·xM·tanα= n
p·dM·tanγtanα (22) dM0 =dM·
1+n
ptanαtanγ
Figure 5.Ratio of the real variables to the measured variables of the velocity (upper panel), plume distance or diameter (middle panel) and column densities (lower panel) for an SO2camera with an FOV
angle of 24◦. The relative deviations of distance are the same as for the diameter (hhR
M = dR
dM). Relative deviations larger than 0.5 from
the measured data are shaded white.
Accordingly the new measured lengths of the pixelsxM0 can be calculated as
xM0 =xM·
1+n
ptanαtanγ
. (24)
3 Application
We used the considerations developed in Sect. 2 (together with the usually well-justified assumption of a constant SO2
flux) to design an algorithm which allows us to determine the wind direction directly from SO2camera plume images
without the need for further data or assumptions. The new algorithm has been applied to an SO2camera measurement
data set taken at Mt Etna, Sicily on 9 July 2014. Not only the possibility of the inclination angle estimation, but also the possibility of observation of a wind direction change, was investigated. Figure 8 shows the geometry of the data set. 3.1 Plume propagation direction determination
Figure 9 shows the SO2fluxes at three different positions in
the FOV of the SO2camera for a measurement data set taken
at Mt Etna. The upper panel shows the SO2flux for each of
Figure 6.Deviation of the total true flux from the measured flux (with no inclination assumed) as a function of the FOV angle of the SO2camera and the inclination angleα. A perspective imaging of a
plume with unknown inclination can lead to wrong flux estimations. Deviations larger than 0.5 from the measured data are shaded white. White stripes show the 0.1 steps of the deviations.
Figure 7.Schematic drawing of the shift of the best known dis-tance towards the border of the image array. The equations for the perspective correction can be adapted to the respective position of the best known distance.
these positions not corrected for inclination. The lower panel shows the fluxes corrected for the inclination. During the measurement campaign, in addition to the SO2camera
mea-surements, measurements were taken by a car-based DOAS instrument pointing to the zenith and traversing the plume (see e.g. McGonigle et al., 2002; Galle et al., 2003). The centre of the plume can be found by evaluating the SO2
col-umn density and determining the location with the maximum values. Thus, the wind direction could be estimated, giving an inclination of the plume of about 38◦. This information was then used to verify the applicability of the developed al-gorithm to the SO2 camera data sets. Figure 10 shows the
fluxes at seven different positions in the camera image from the data set taken at Etna on 9 July 2014. The SO2flux was
calculated assuming different plume inclination angles. Fig-ure 10 shows that the SO2fluxes are nearly the same if the
2
Figure 8.Map of the geometrical set-up of the measurement data set. The inclination of the plume is 38◦with respect to the image plane. The positions in the FOV used for the flux determination are coloured.
Figure 9.Deviations of the SO2fluxes of three different cross sec-tions through the plume. These apparent deviasec-tions are caused by the unknown inclination of the plume with respect to the image plane. This measurement set was taken at Mt Etna on the 9 July 2014.
3.2 Real-time tracking of changes in the wind direction
If there are changes in the propagation direction of the plume during SO2 camera measurements, it is possible to detect
these changes on timescale of minutes. Figure 11 shows a change in the ratio between the apparent SO2 flux
deter-mined in two different positions of the plume within the FOV of the camera. During 2 h of measurements between 11:32 and 13:23 UTC, on 9 July 2014, the wind direction was sta-ble for about 1 h (A). For this period the ratio between the two flux measurement positions was mostly constant, except for slight fluctuations. Then the inclination angle changed by about 20◦, which we attribute to a change of the wind direc-tion (B). In this phase of the observadirec-tion the ratio between the two flux measurements is decreasing. Later, the new wind
Figure 10.Mean fluxes of seven different cross sections of the mea-surement data set as a function of the angle correction. Each cross section is plotted in a different colour. The SO2flux should be the same in each cross section if it is a conservative tracer. The plume inclination can be estimated to 40◦with an uncertainty of 5◦. Along with knowing the orientation of the camera set-up, this information can be used to determine the plume propagation direction.
Figure 11.Observation of a wind direction change using the appar-ent flux ratios of two differappar-ent cross sections of the plume which were corrected for the perspective. Depending on the propagation velocity, it is possible to determine direction changes on a timescale of minutes. For every inclination towards the image plane, the ra-tio of the fluxes is unique. On this data set, there occurred a di-rection change after phase A at 12:26 UTC. The wind didi-rection in phase A was 281±5◦. The direction change of about 20◦in phase B took approximately 23 min. A new stable propagation direction of 301±5◦established in phase C at 12:49 UTC.
direction stabilizes in (C), with a new constant ratio between the two flux measurements. The SO2plume also exhibits a
4 Conclusions
We showed that an inclined plume causes apparent spatial flux gradients in the SO2camera measurement images. The
frequently implicitly (e.g. Smekens et al., 2015) or explic-itly (e.g. Mori and Burton, 2006) assumed compensation ef-fect only occurs at very small inclination angles (<15◦) or small FOV (<2◦). For an SO2camera with an FOV angle of
24◦ a tilt angle of 15◦ already causes flux deviations larger than 10 % in parts of the SO2 camera’s images for
evalu-ations relying on the compensation effect. However, these gradients are unambiguous for every possible inclination an-gle of the volcanic plume with respect to the image plane of the SO2 camera. Therefore, they can not only be corrected
but can also be used to determine the direction of the plume (i.e. the wind direction at the location of the plume). On longer timescales that exceed the travel time of the plume parcel across the FOV (several minutes), even the change in the mean wind direction can be observed. On the other hand, if these errors in plume inclination are ignored they can give rise to erroneous observations of fluxes, in particu-lar fake flux changes with plume age or over time can occur. If these changes in flux are attributed to chemical processes in plumes (e.g. SO2oxidation) or of volcanic degassing
pat-terns, the wrong conclusions with respect to chemical pro-cesses in volcanic plumes or wrong interpretation on de-gassing behaviour may be drawn.
While the proposed algorithm is applicable to straight and bent plumes (i.e. plumes where the wind direction changes within the field of view), so far the combined effects of this study and radiative transfer issues have not yet been ad-dressed. Additionally, if several plumes are masking each other, the proposed algorithm may not work.
Recent improvements in the velocity determination of vol-canic plumes using image processing methods like optical flow algorithms can be combined with the proposed perspec-tive correction method for a robust SO2flux determination.
5 Data availability
The raw measurement data (spectra and images, more than 1 GB in size) of the SO2camera can be obtained on request
from the authors.
Competing interests. The authors declare that they have no conflict of interest.
Acknowledgements. We acknowledge the work of Sebastian Illing and Marco Huwe on the SO2camera prototype that was used for
the Mt Etna measurements.
Further, the authors thank for the financial support from the DFG project “DFG BO 3611/1-2”.
We acknowledge the financial support of the Deutsche Forschungsgemeinschaft and Ruprecht-Karls-Universität Heidel-berg within the funding programme Open Access Publishing.
Edited by: T. von Clarmann
Reviewed by: three anonymous referees
References
Aiuppa, A., Moretti, R., Federico, C., Giudice, G., Gurrieri, S., Li-uzzo, M., Papale, P., Shinohara, H., and Valenza, M.: Forecasting Etna eruptions by real-time observation of volcanic gas compo-sition, Geology, 35, 1115–1118, doi:10.1130/G24149A.1, 2007. Bobrowski, N., von Glasow, R., Giuffrida, G. B., Tedesco, D., Aiuppa, A., Yalire, M., Arellano, S., Johansson, M., and Galle, B.: Gas emission strength and evolution of the mo-lar ratio of BrO/SO2 in the plume of Nyiragongo in
com-parison to Etna, J. Geophys. Res.-Atmos., 120, 277–291, doi:10.1002/2013JD021069, 2015.
Eisinger, M. and Burrows, J. P.: Tropospheric sulfur dioxide ob-served by the ERS-2 GOME instrument, Geophys. Res. Lett., 25, 4177–4180, doi:10.1029/1998GL900128, 1998.
Galle, B., Oppenheimer, C., Geyer, A., McGonigle, A. J., Ed-monds, M., and Horrocks, L.: A miniaturised ultraviolet spec-trometer for remote sensing of SO2 fluxes: a new tool for volcano surveillance, J. Volcanol. Geoth. Res., 119, 241–254, doi:10.1016/S0377-0273(02)00356-6, 2003.
Galle, B., Johansson, M., Rivera, C., Zhang, Y., Kihlman, M., Kern, C., Lehmann, T., Platt, U., Arellano, S., and Hidalgo, S.: Network for Observation of Volcanic and Atmospheric Change (NOVAC) – A global network for volcanic gas monitoring: Network lay-out and instrument description, J. Geophys. Res.-Atmos., 115, D05304, doi:10.1029/2009JD011823, 2010.
Jähne, B.: Digital Image Processing, 6th edition, Springer Berlin Heidelberg, Germany, 2005.
Kern, C.: Spectroscopic measurements of volcanic gas emissions in the ultra-violet wavelength region, Dissertation, Institute of Environmental Physics, The Faculty of Physics and Astronomy, University Heidelberg, doi:10.11588/heidok.00009574, 2009. Kern, C., Kick, F., Lübcke, P., Vogel, L., Wöhrbach, M., and Platt,
U.: Theoretical description of functionality, applications, and limitations of SO2 cameras for the remote sensing of volcanic
plumes, Atmos. Meas. Tech., 3, 733–749, doi:10.5194/amt-3-733-2010, 2010.
Kern, C., Lübcke, P., Bobrowski, N., Campion, R., Mori, T., Smekens, J.-F., Stebel, K., Tamburello, G., Burton, M., Platt, U., and Prata, F.: Intercomparison of SO2camera systems for
imag-ing volcanic gas plumes, J. Volcanol. Geoth. Res., 300, 22–36, doi:10.1016/j.jvolgeores.2014.08.026, 2015a.
Kern, C., Sutton, J., Elias, T., Lee, L., Kamibayashi, K., Antolik, L., and Werner, C.: An automated SO2camera system for
con-tinuous, real-time monitoring of gas emissions from Klauea Vol-cano’s summit Overlook Crater, J. Volcanol. Geoth. Res., 300, 81–94, doi:10.1016/j.jvolgeores.2014.12.004, 2015b.
2
McGonigle, A. J. S., Oppenheimer, C., Galle, B., Mather, T. A., and Pyle, D. M.: Walking traverse and scanning DOAS measure-ments of volcanic gas emission rates, Geophys. Res. Lett., 29, 46–1–46–4, doi:10.1029/2002GL015827, 2002.
McGonigle, A. J. S., Hilton, D. R., Fischer, T. P., and Op-penheimer, C.: Plume velocity determination for volcanic SO2 flux measurements, Geophys. Res. Lett., 32, L11302,
doi:10.1029/2005GL022470, 2005.
Moffat, A. J. and Millan, M. M.: The applications of optical cor-relation techniques to the remote sensing of SO2 plumes
us-ing sky light, Atmos. Environ., 5, 677–690, doi:10.1016/0004-6981(71)90125-9, 1971.
Mori, T. and Burton, M.: The SO2camera: A simple, fast and cheap
method for ground-based imaging of SO2 in volcanic plumes,
Geophys. Res. Lett., 33, L24804, doi:10.1029/2006GL027916, 2006.
Noguchi, K. and Kamiya, H.: Prediction of volcanic eruption by measuring the chemical composition and amounts of gases, Bull. Volcanol., 26, 367–378, doi:10.1007/BF02597298, 1963. Platt, U. and Stutz, J.: Differential Absorption Spectroscopy, in:
Dif-ferential Optical Absorption Spectroscopy: Principles and Ap-plications, 135–174, Springer Berlin Heidelberg, Berlin, Heidel-berg, doi:10.1007/978-3-540-75776-4_6, 2008.
Smekens, J.-F., Burton, M. R., and Clarke, A. B.: Validation of the SO2camera for high temporal and spatial resolution
moni-toring of SO2emissions, J. Volcanol. Geoth. Res., 300, 37–47,
doi:10.1016/j.jvolgeores.2014.10.014, 2015.