https://doi.org/10.5194/esd-8-419-2017
© Author(s) 2017. This work is distributed under the Creative Commons Attribution 3.0 License.
Intensity of geodynamic processes in the Lithuanian part
of the Curonian Spit
Algimantas ˇCesnuleviˇcius1, Regina Mork ¯unait˙e2, Art ¯uras Bautr˙enas1, Linas Bevainis1, and Donatas Ovodas1
1Department of Cartography and Geoinformatics, Faculty of Chemistry and Geosciences, Vilnius University, 03101, Vilnius, Lithuania
2Laboratory of Quaternary Research, Institute of Geology and Geography, Nature Research Centre, 08412, Vilnius, Lithuania
Correspondence to:Algimantas ˇCesnuleviˇcius ([email protected])
Received: 5 January 2017 – Discussion started: 9 January 2017 Revised: 4 May 2017 – Accepted: 10 May 2017 – Published: 28 June 2017
Abstract. The paper considers conditions and intensity of aeolian and dune slope transformation processes occurring in the wind-blown sand strips of the dunes of the Curonian Spit. An assessment of the intensity of aeolian processes was made based on the analysis of climatic factors and in situ observations. Transformations in aeolian relief forms were investigated based on the comparison of geodetic measurements and measurements of aerial photographs. Changes in micro-terraces of dune slopes were investigated through comparison of the results of repeated levelling and measurements of aerial photographs. The periods of weak, medium, and strong winds were distinguished, and sand moisture fluctuations affecting the beginning of aeolian processes were investigated. The wind-blown sand movements were found to start when sand moisture decreased by 2 % in the surface sand layer and by up to 5 % at a depth of 10 cm. In 2004–2016, the wind-blown sand movements affected the size of reference deflation relief forms: scarp length by 8 %, scarp width by 35 %, pothole length by 80 %, pothole width by 80 %, roll length by 17 %, roll width by 18 %, hollow length by 17 %, and hollow width by 39 %. The elementary relief forms in the leeward eastern slopes of the dunes experienced the strongest transformations. During a period of 5 months, the height of micro-terraces of the eastern slope of the Parnidis Dune changed from 0.05 to 0.64 cm. The change was related to fluctuations in precipitation intensity: in July– August 2016 the amount of precipitation increased 1.6-fold compared with the multiannual average, thus causing the change in the position of terrace ledges by 21 %.
1 Introduction
The formation of the core of the Curonian Spit started 6– 8 thousand years ago and is related to the end of the third transgression of the Littorina (L3, III bl) Sea. The further de-velopment of the spit took place during the Post-Littorina L 4 (IV PL) period (Bitinas et al., 2001; Bitinas and Damušyt˙e, 2004). Southward transportation of sand formed a shallow littoral zone on the south-eastern coast of the Baltic Sea. In the zone, fine- and medium-grained sand was drifted against glacigenic hills and onto emerged sand, grain, and pebble
shallows of marine origin (Bitinas and Damušyt˙e, 2004; Biti-nas et al., 2005) (Fig. 1).
420 A. ˇCesnuleviˇcius et al.: Intensity of geodynamic processes
Figure 1.Cross section in the northern part of the Curonian Spit (Vingiakop˙e environment) (by Bitinas et al., 2002; Badyukova et al., 2007).
Figure 2.Curonian Spit evolution phases:(a)beginning of the third stage of Littorina Sea transgression (4 kyr BC),(b)end of Littorina Sea transgression (3 kyr BC),(c)Mya Sea transgression (2 kyr BC), and(d)contemporary Baltic Sea and Curonian Lagoon (Karte des Deutschen Reiches, 1911; Gudelis, 1998; Kabailiene, 1967; Kunskas, 1970).
ago, it reached the continental coast (stage IV) (Gudelis, 1979, 1998; Kabailiene, 1967; Kunskas, 1970; Kliewe and Janke, 1982; Mojski, 1988; Müller, 2004; Starkel, 1977) (Fig. 2).
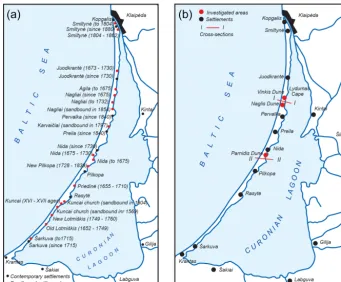
Wind-blown sand movement is the main geomorpholog-ical geodynamic process that currently occurs in the Curo-nian Spit. Since the 16th century, 14 villages have been en-tirely buried under the sand, and dwellers of other villages had to move from one place to another to escape wind-blown sand (Fig. 3). The first efforts to slow down wind-blown sand movement go back to the first half of the 19th century, when dunes started to be overgrown with vegetation, which stabi-lized strong movement of sand throughout the 19th century. The first scientific research into aeolodynamic processes in
pur-Figure 3.Contemporary and extinct settlements(a)and investigated areas(b). Places of cross sections: I–I – Vingiakop˙e environment (Fig. 1); II–II – Parnidis environment (Fig. 4).
sued in the Lithuanian part of the Curonian Spit, which en-ables identifying regularities of changes in aeolian deflation and accumulation processes (Mork¯unait˙e and ˇCesnuleviˇcius, 2005; ˇCesnuleviˇcius et al., 2016).
Currently, specific tectonic subsidence phenomena related to deformations of marl accumulated in the freshwater basin are taking place south of Nida settlement (Fig. 4). For this reason, marl squeeze formed on the coast of the Curonian Lagoon. Before the Second World War, Vladas Viliamas de-scribed the phenomena and pointed out a rather wide dis-tribution of the phenomena south of Juodkrant˙e settlement (Viliamas, 1932). In 1985, marl squeeze was still observed south of Juodkrant˙e (Kabailien˙e, 1997). To date, marl can only be detected south of Nida. The pressure of a sand layer on the plastic marl layers causes deformations on the surface of dunes and gives rise to the formation of stepwise micro-terraces. Such geological–geomorphological formations can also be found in other areas of the Baltic Sea (Lampe et al., 2011; Sergeev et al., 2016).
The purpose of this article is to assess quantitative changes of aeolian relief forms induced by alterations of climate com-ponents in the wind-blown areas of the Curonian Spit.
Figure 4.Lagoon marl layer deformation model in the investigated area (by Sergeev et al., 2016.).
2 Methods
422 A. ˇCesnuleviˇcius et al.: Intensity of geodynamic processes
2016. Investigations were carried out in the Lithuanian part of the Curonian Spit: Parnidis, Naglis, and Vinkis dunes (Fig. 3b), where a repeated precise levelling of wind-blown sand strips of the ridge was performed. The levelling was done with the help of an ELTA 500 electronic tacheometer and Trimble GeoXT 6000 GPS with an accuracy of 5 arcsec for measuring angles and 1 mm for measuring elevations of points. A comparison of repeated levelling profile data en-abled quantitative assessment of changes in the main dune ridge relief forms. The mapping of the surface of dunes was done using an unmanned aerial vehicle (DJI Inspire).
An analysis of aeolian microform variations (depressions, hummocks, gullies, ridges) was carried out in a wind-blown sand strip of Naglis and Vinkis dunes. Quantitative changes of microforms that occurred in the period of 1999–2016 were compared. The morphometric microform indices were obtained by performing route measurements from natural benchmarks and using a GPS receiver and a ±1 mm accu-racy distance measurer (Leica Disto D510).
An assessment of dune surface changes was made based on meteorological factors: the beginning and end of strong wind periods and the moisture of the surface sand layer. An analysis of sand samples taken from the surface sand layer and at a depth of 0.15 m in windward and leeward dune slopes enabled determining the beginning of local and massive wind-blown sand movements. Sand moisture and groundwater level in the dunes were estimated using geo-radar scanning data (Dobrotin et al., 2013).
To specify in greater detail the periodicity and intensity of wind-blown sand movements, an analysis of climatic pa-rameters (wind speed, wind direction, air temperature, and precipitation) from meteorological stations of Klaip˙eda, Nida and Šilut˙e for the period 1991–2015 was performed: in addi-tion, the data from a temporary meteorological station estab-lished on the seacoast of Nida for the summer of 2016 were used. The assessment of climatic parameters was necessary for the purpose of forecasting possible meteorological situ-ations. Unfavourable weather conditions (wind, rain, snow) made a direct impact on the flight of an unmanned aerial ve-hicle and the quality of aerial photographs.
To measure the local wind regime in the coastal area of the Baltic Sea, a temporary mobile meteorological station was established. It operated only in the summer of 2016. The data about wind speed, wind direction, air temperature, and precipitation taken by self-recorders of the station were compared with the data from the Nida meteorological sta-tion, and correlation indices were determined. Occasional wind speed measurements were also taken by an unmanned aerial vehicle. A comparison of short-term and occasional measurements of wind speed and direction with the data of meteorological stations allows stating that the wind regime recorded at the Klaip˙eda meteorological station was closest to the wind regime recorded in the dune ridge of the Curo-nian Spit. The correlation coefficient was equal tor=0.988 for wind speed andr=0.998 for wind direction.
3 Climatic factors
An analysis of 30-year data of climatic factors from meteoro-logical stations of Nida, Klaip˙eda, and Šilut˙e enabled distin-guishing the greatest periods of aeolian processes. In partic-ular, three main factors that made a direct impact on aeolian processes, i.e. wind regime, precipitation, and air tempera-ture, were analysed.
Compared with the remaining territory of Lithuania, the Curonian Spit distinguishes by a specific climate with mild and often snowless winters, frequent strong winds and storms, a longer period of above-zero temperatures. We de-scribed the climate of the northern part of the Curonian Spit based on the data from the Klaip˙eda meteorological station and the climate of the central part of the spit based on the data from Nida and Šilut˙e meteorological stations.
Air temperature was an important factor affecting aeolian processes. In the cold season of the year, aeolian processes were very slow and occurred only with storm winds. Due to low temperature, the surface of moist sand got frozen and the crust formed, which protected sand from being blown by wind. The cold season of the year lasted from 18 (1991– 1992) to 114 (1995–1996) days. Cold seasons were often ac-companied by thaw periods when the frozen sand crust lost its stiffness and aeolian processes revived. The thawing of the sand crust required longer (4–16 days) periods of temper-atures above zero (1–4◦C). Such situations were recorded in 1986–1987, 1989–1990, 1992–1993, 1999–2000, and 2008– 2009. In 1991–1992, when temperatures above zero pre-vailed, no sand crust formed and aeolian processes could take place all year round.
The amount and temporal distribution of precipitation were other important factors affecting aeolian processes, in particular, the number and duration of periods without pre-cipitation. An analysis of 30-year data of precipitation from Nida, Klaip˙eda, and Šilut˙e meteorological stations showed that dry periods were distributed rather evenly throughout a year. Dry periods without precipitation lasted for, on average, 15 days in spring (March–May), 13 days in summer (June– August), and 10 days in autumn (September–November). However, dry periods differed between years. For example, the period without precipitation lasted 30 days (entire May month) in the spring of 1992, 25 days (nearly all the month of May) in the spring of 2000, and 26 days (nearly all the month of April) in 2009. In spring, the minimum duration of the period without precipitation was 6 days, and the maxi-mum 30 days. In summer, the longest period without precip-itation lasted 29 days (July 1994), and the shortest 5 days. In autumn, the longest periods without precipitation were recorded in 1998 (21 days in September–October) and 2005 (19 days in October).
meteorolog-Figure 5. Multiannual average wind speed registered at meteorological stations in Nida, Šilut˙e and Klaip˙eda: (a)December–February (Nida);(b)March–May (Nida);(c)June–August (Nida);(d)September–November (Nida);(e)multiannual maximum wind speed (Šilut˙e); (f)multiannual maximum wind speed (Klaip˙eda).
ical station showed that the Curonian Lagoon made a great impact on wind dynamics. E–SE–S winds with an average speed of 5–6 m s−1prevailed in all years. According to the data from the Nida station, the maximum speed of winds lasting 3 h and longer reached 16 m s−1 in spring, 16 m s−1 in summer, 22 m s−1in autumn, and 21 m s−1in winter. Ac-cording to the data from the Klaip˙eda seacoast meteorolog-ical station, SW–W–NW winds with an average speed of 5.0 m s−1prevailed. The maximum speed of 3 h winds taken at the Klaip˙eda hydrometeorological station was consider-ably greater: 20 m s−1in spring (2000), 18 m s−1in summer (1981 and 2002), 26 m s−1in autumn (1981), and 26 m s−1 in winter (1982). Among maximum wind speeds, N (51 % of cases), SW (38 %), and SE (11 %) winds prevailed. The max-imum wind speeds of other directions constituted less than 1 %. According to the data from the Šilut˙e meteorological station, the maximum wind speed reached 17 m s−1in spring,
13 m s−1 in summer, 21 m s−1 in autumn, and 18 m s−1 in winter.
The strong wind due large dune surface changes. The num-ber of days with higher than 15 m s−1wind speed was 55. The last decade was “softer” than the period 1993–2002, when there were 63 such days, or the period 1981–1990, when there were 75 such days. The most obvious change of dunes surface was after a strong storm winds. Over the last 30 years the most powerful hurricanes were in 1993 (wind speed reached 34 m s−1), 1999 (hurricane Anatoly, 40 m s−1), 2005 (hurricane Ervin, 34 m s−1), and 2011 (hur-ricane Joachim, 28 m s−1).
(Dai-424 A. ˇCesnuleviˇcius et al.: Intensity of geodynamic processes
Table 1.Wind speed and number of cases in March–October 2016 year (data from the Nida meteorological station).
Total wind Wind over 6 m s−1speed
Wind cases % cases % Maximum speed Duration, in
direction in gust, m s−1 hours
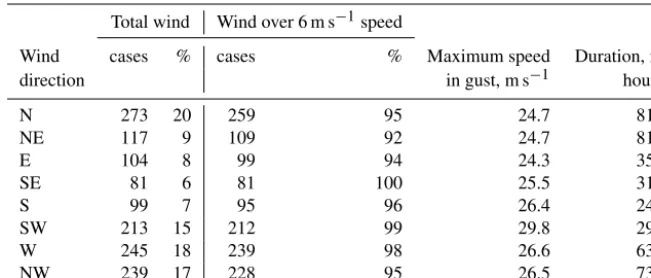
N 273 20 259 95 24.7 819
NE 117 9 109 92 24.7 819
E 104 8 99 94 24.3 354
SE 81 6 81 100 25.5 315
S 99 7 95 96 26.4 243
SW 213 15 212 99 29.8 297
W 245 18 239 98 26.6 639
NW 239 17 228 95 26.5 735
lidiené et al., 2006; Jarmalaviˇcius et al., 2014, 2016). The raised water washed the foot and of the dunes and destabi-lized middle part of slopes.
The recorded differences in wind regime were due to the location of meteorological stations: the Klaip˙eda and Šilut˙e meteorological stations were exposed to the winds of all di-rections, whereas the Nida meteorological station was lo-cated at the foot of the dune ridge of the Curonian Spit, and the dune ridge blocked EW–W–NW winds.
4 Results and discussion
Our analysis was based on the data of wind speeds exceeding 6 m s−1as recorded at Nida, Klaip˙eda and Šilut˙e meteorolog-ical stations in the warm periods (March–October) of 1984– 2015. During the investigation period, W–NW (16.8 %), W (14.0 %), S (3.7 %), and E (2.7 %) winds prevailed among wind speeds over 6 m s−1, which constituted 13.7 % of all cases. The Klaip˙eda meteorological station recorded a total of 55 cases of very strong winds (over 15 m s−1) in 2006– 2015 (a shorter period of strong winds), 75 cases of very strong winds in 1984–1994 (a long period of very strong winds), and 63 cases in 1995–2005 (a medium-duration pe-riod of very strong winds). In 2006–2015, 60 cases of very strong winds were recorded at the Nida station and 43 cases at the Šilut˙e station. The warm period of 2016 in the Curo-nian Spit was particularly windy. According to the data from the Nida meteorological station (wind speed and direction were measured every 6 h), winds were recorded to blow for a total of 4221 h, and winds stronger than 6 m s−1were recorded to blow for 3966 h during the warm season (Ta-ble 1).
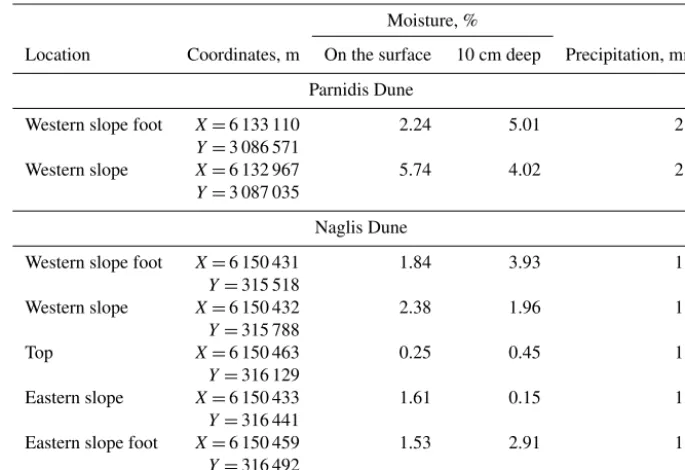
Permanent strong winds caused fast sand drying and inten-sified deflation processes. Our measurements showed that 1 h after rain the surface sand layer was about 50 % drier com-pared with sand at a depth of 10 cm (Table 2).
Sand moisture was measured by the method of weighing dishes in different dune profile areas, and a comparison was made between sand moisture in the Parnidis Dune environs
of 16 June 2016 (amount of precipitation: 2.3 mm) and in the Vinkis Dune environs of 18 June of the same year (amount of precipitation: 1.5 mm) (Table 2). In the western part of the Vinkis Dune, sand moisture reached 1.91–2.74 % on the surface and 1.83–2.39 % at a depth of 10 cm. In the nature trail, sand moisture was 0.22 % on the surface and 0.065 at a depth of 10 cm. Such inverse distribution could be due to human trampling. In May 2014, no moisture distribution in-version was detected on sand surface or in deeper layers: on 12 May (amount of precipitation: 2.1 mm) sand mois-ture reached 3.41 % on the surface and 5.04 % at a depth of 15 cm near the nature trail up the Nagliai Dune (fewer vis-itors). The sand moisture measurement data obtained near the Parnidis Dune on 27 June 2015 (amount of precipitation: 1.9 mm) were more consistent, because in the western part of the slope there was a tussock area where sand contained more moisture (by 1–2 %) compared to the sand near the top. Because of an constant stream of visitors, the crest of the southern segment of the dune ridge of the Lithuanian part of the Curonian Spit (Parnidis and Slandytojai dunes) is com-pletely trampled. Small natural deflation hollows have sur-vived only in the distal slope facing the Curonian Lagoon. Such hollows are most severely affected by S–SE winds pre-vailing in spring (May) and winter (December–February). S– SE winds in the summers of 2004–2016 markedly changed the form and depth of deflation hollows. The changes consti-tuted up to 0.05–0.20 m day−1.
Table 2.Distribution of sand moisture on the surface and at a depth of 10 cm in the environs of Parnidis and Naglis dunes.
Moisture, %
Location Coordinates, m On the surface 10 cm deep Precipitation, mm
Parnidis Dune
Western slope foot X=6 133 110 2.24 5.01 2.3 Y=3 086 571
Western slope X=6 132 967 5.74 4.02 2.3
Y=3 087 035
Naglis Dune
Western slope foot X=6 150 431 1.84 3.93 1.5 Y=315 518
Western slope X=6 150 432 2.38 1.96 1.5
Y=315 788
Top X=6 150 463 0.25 0.45 1.5
Y=316 129
Eastern slope X=6 150 433 1.61 0.15 1.5
Y=316 441
Eastern slope foot X=6 150 459 1.53 2.91 1.5 Y=316 492
Deflation hollows formed in each seaward or lagoon-ward relief depression in the Lydumo ragas–Vinkis Dune segment. We compared the measurements of 1999–2016 and found that the length and width of deflation hollows were the most variable parameters. Moreover, the length and width of pas-sages connecting the hollows were also very dynamic. They could change by some to several dozens of metres per year (Table 3). In the Juodkrant˙e–Pervalka segment, the blowing of sand away from hollows was due not only to frequent strong winds but also to the position of hollows in dune slopes. The strongest deflation processes took place in the hollows located in the leeward eastern slopes of the dune ridge. The hollows in the crest of the dune ridge were blown out to a lower degree, and the hollows in the windward west-ern slope of the dune ridge suffered the lowest degree of de-flation. The degree of deflation also depended on whether hollows were open or closed. The hollows with W–E defla-tion passages opening thereto suffered the fastest transforma-tions. The wind quickly transformed such hollows into defla-tion gullies.
Further to the south, the Parnidis Dune sand layer is press-ing a freshwater marl layer beneath and formpress-ing an up to 2 m high squeezed scrap on the coast of the Curonian La-goon. The pressure causes the formation of micro-terraces on the slope of the dune. The development of micro-terraces is closely related to infiltration of precipitation into the sand layer. The pressure of the sand layer increases in spring, when snow is melting, and in summer and autumn, when precipitation is abundant. This causes changes in morpho-metric parameters of micro-terraces on a stable slope of the dune ridge south of the Parnidis Dune. In April and
Table 3.Transformation of aeolian deflation relief forms in 1999– 2015.
Length/width, m
Aeolian form 1999 2001 2003 2016
Scarp 6.6/2.0 7.1/2.4 6.6/1.7 6.8/1.8 Hollow 30.3/13.2 34.6/16.4 28.7/14.8 35.6/18.3 Passage 30.0/4.0 42.0/7.6 34.0/6.3 47.0/11.8 Roll 29.0/5.0 30.5/5.5 31.0/4.8 34.0/5.9 Ledge 15.4/8.5 17.2/7.6 19.6/9.4 22.6/11.4 Pothole 25.6/8.2 39.3/11.2 42.0/13.8 46.2/15.6
September 2015–2016, the slope was photographed four times from an unmanned aerial vehicle. Upon creation of a three-dimensional surface model, the relief microforms were measured. The measurements were taken in the photographs of different periods where the spatial position of the same points was precisely identified (Fig. 6).
The measurements showed that the position of micro-terraces changed during a 5-month period. A comparison of the measurement results of aerial photographs between April and September 2016 revealed a decline in the height of ter-race ledges by 0.50–0.64 cm. An increase in the height of the terrace ledge in the middle part of the slope was due to a sand slide made by numerous visitors to the dunes.
426 A. ˇCesnuleviˇcius et al.: Intensity of geodynamic processes
Figure 6.Investigation areas (left) and changes in micro-terrace parameters (right).
Figure 7.Comparison of multiannual and annual (2016 year) sum-mer precipitation (from Nida meteorological data).
height of the coastal marl scrap increased by 0.5 m during the spring–summer period of 2016.
Rather sharp changes in micro-terraces of eastern slopes were related to the amount of precipitation exceeding the average. In April–September 2016, precipitation amount ex-ceeded the multiannual average by 110 %. Still greater differ-ences were observed in July–August 2016, when the amount of precipitation exceeded the multiannual average by 160 % (Fig. 7).
We can state that in the end of summer the pressure of moist sand on the marl layer increased 1.6-fold, which condi-tioned a particularly marked change in the position of micro-terraces. Somewhat smaller changes took place after the win-ter of 2015–2016, when infiltration of thawed snow wawin-ter into sand sharply increased at the beginning of March. Since the autumn of 2015, the changes in the vertical position of terrace ledges have constituted 0.12–0.56 m on average.
5 Conclusions
1. The deflation processers in the northern part of the Curonian Spit were mostly affected by frequent strong SW–W–NW winds of the maximum speed of 18– 26 m s−1, while the deflation processes in the middle part of the spit were mostly due to E–SE–S winds of 16–22 m s−1 maximum speed. Aeolian processes were largely influenced by long-lasting winds of the average speed exceeding 6 m s−1. The duration of such winds reached 4000 h in Nida in the March–October 2016. Strong permanent winds induced fast sand drying and activated deflation processes, which were further accel-erated by a constant stream of visitors to the dunes.
3. The measurements of repeated aerial photographs showed that the change in morphometric parameters of micro-terraces was related to fluctuations in precip-itation intensity. A greater infiltration of precipprecip-itation sharply increased the weight of the sand layer and its pressure on the marl layer. In the summer (July–August) of 2016, the amount of precipitation increased 1.6-fold compared with the multiannual average, which gave rise to changes in micro-terraces and in the scrap of the coastal marl. The sinking of terrace ledges reached 21 %, and marl scrap height increased by 25 % in some places.
4. An investigation of geodynamic processes revealed the regularities and reasons of transformations of aeolian macro- (e.g. hollows), meso- (rolls) and micro-forms (e.g. micro-terraces). Changes in relief forms and their measurements confirm the “sensitivity” of aeolian sands of the Curonian Spit and the need for regulation of their protection. The abundance of visitors and their curiosity and activity make such regulation even more relevant. Such problematic places include Parnidis Dune, where visiting is unlimited, and Naglis Dune, where visiting is restricted and a fee must be payed. In other drifting dune areas, visiting is completely banned.
Data availability. The measurement of aeolian relief forms in Curonian Spit has been carried out by the authors since 1995. The dune shape changes data were collected by the authors (Regina Mork¯unait˙e, Algimantas Cesnuleviˇcius,ˇ Art¯uras Bautr˙enas), who are happy to provide data on re-quest ([email protected], [email protected], [email protected]). Some articles are based on this data analysis: Mork¯unait˙e et al. (2002, 2011, 2016), ˇCesnuleviˇcius and Mork¯unait˙e (1997), Mork¯unait˙e and ˇCesnuleviˇcius (1998, 2001, 2005), and ˇCesnuleviˇcius et al. (2006). Analysis of cli-mate indicators analysis was performed using the data freely accessible from the Klaipeda, Nida and Šilute meteorologi-cal stations (Lithuanian Hydrometeorologimeteorologi-cal Service), and meteorological data from the stations are available on re-quest (http://www.meteo.lt/en/web/guest/applications). For the overview of historical dune changes, freely accessible archival maps were used (http://old.meteo.lt/stebejimu_tinklas.php). Metadata of the climatic parameters set can be found at http://www.meteo.lt/documents/20181/141122/Informacines_ rinkmenos/10b3be00-d496-4a5b-9938-0a4e80031879.
Competing interests. The authors declare that they have no con-flict of interest.
Acknowledgements. The authors acknowledge the Lithuanian Hydrometeorological Service, which kindly allowed us to use the Klaipeda, Nida and Šilute meteorological station data.
Edited by: M. Reckermann
Reviewed by: two anonymous referees
References
Badyukova, E. N., Zhindarev, L. A., Lukyanova, S. A., and Soloveva, G. D.: Geological Structure of the Curonian Spit (of the Baltic Sea) and Its Evolution History (Revised), Oceanology, 47, 554–563, 2007.
Berendt G.: Geologie des Kurishen Haffes und seiner Umgebung, Albertina Universität, Königsberg, 1869.
Bitinas, A. and Damušyt˙e, A.: The Littorina Sea at the Lithuanian maritime region, Polish Geological Institute Special Papers, 11, 37–46, 2004.
Bitinas, A., Damušyt˙e, A., Hütt, G., Jaek, I., and Kabailien˙e, M.: Application of the OSL dating for stratigraphic correlation of Late Weichselian and Holocene sediments in the Lithuanian Mar-itime Region, Quaternary Sci. Rev., 20, 767–772, 2001. Bitinas, A., Damušyt˙e, A., Stanˇcikait˙e, M., and Aleksa, P.:
Geologi-cal development of the Nemunas River Delta and adjacent areas, West Lithuania, Geol. Q., 46, 375–389, 2002.
Bitinas, A., Žaromskis, R., Gulbinskas, S., Damušyt˙e, A., Žilinskas, G., and Jarmalavièius, D.: The results of integrated investigations of the Lithuanian coast of the Baltic Sea: geology, geomorphol-ogy, dynamics and human impact, Geol. Q., 49, 355–362, 2005. ˇ
Cesnuleviˇcius, A. and Mork¯unait˙e, R.: Morphometrical, lithological and mineralogical traits of eolian formations in the Lithuanian coastal zone of the Baltic Sea, Baltica, 10, 53–58, 1997. ˇ
Cesnuleviˇcius, A., Izmailow, B., and Mork¯unait˙e, R.: Dynamics of deflation hollows in Main Dune Ridge of Curonian Spit, Geog-raphy, 42, 21–28, 2006.
ˇ
Cesnuleviˇcius, A., Bautr˙enas, A., Mork¯unait˙e, R., and Kavoliut˙e, F.: Intensity of aeolian processes on Curonian Spit (the end of the XX century – begining the XXI century), Selected issues of ae-olian geomorphology, Jagiellonian University, Cracow, Poland, 111–130, 2016.
Dailidien˙e, I., Davulien˙e, L., Tilickis, B., Stankeviˇcius, A., and Myrberg, K.: Sea level variability at the Lithuania coast of the Baltic Sea, Boreal Environ. Res., 11, 109–121, 2006.
Dobrotin, N., Bitinas, A., Micheleviˇcius, D., Damušyt˙e, A., and Mažeika, J.: Reconstruction of the Dead (Grey) Dune evolution along the Curonian Spit, Southeastern Baltic, Bull. Geol. Soc. Finl., 85, 53–64, 2013.
Gaigalas, A. and Pazdur, A.: Chronology of buried soils, forest fires and extreme migration of dunes on the Kuršiu˛ nerija spit (Lithua-nian coast), Landform Analysis, 9, 187–191, 2008.
Gudelis, V.: The Quaternary History of the Baltic, Acta Universi-tatis Upsaliensis, 1, 159–173, 1979.
Gudelis, V.: The Lithuanian offshore and coast of the Baltic Sea, Academia, Vilnius, Lithuania, 1998.
Jarmalaviˇcius, D., Pupienis, D., and Žilinskas, G.: Sea level fluc-tation and shoreline evolution on decadal time scale, Lithuanian Baltic Sea coast, J. Coast. Res., 70, 164–169, 2014.
Jarmalaviˇcius, D., Šmatas, V., Stank¯unaviˇcius, G., Žilinskas, G., and Pupienis, D.: Factors controlling coastal erosion during storms events, J. Coast. Res., 75, 1112–1116, 2016.
428 A. ˇCesnuleviˇcius et al.: Intensity of geodynamic processes
Karte des Deutschen Reiches: 1 : 100 000, K 3 II L 62, Blattnum-mer: 3, 8, 15, 16, 29, R. Eisenschmidt Verlags-Buhhandlung, Königsberg, 1911.
Kliewe, H. and Janke, W.: Der Holozane Wasserspiegelanstieg der Ostsee im Nordostlichen Kustengebiet der DDR, Petermanns Geographische Mitteilungen, 2, 62–74, 1982.
Kunskas, R.: On the evolution of Curonian Lagoon, Nemunas Delta and coastal marshes, History of Lakes, Vilnus, Lithuania, 391– 411, 1970.
Lampe, R., Naumann, M., Meyer, H., Janke, W., and Ziekur, R.: Holocene evolution of the Southern Baltic Sea coast and inter-play of sea-level variation, isostasy, accommodation and sed-iment supply, in: The Baltic Sea Basin, edited by: Harff, J., Björck, S., and Hoth, P., 233–251, Spinger, Berlin, 2011. Mardosien˙e, D.: Dynamics of High Dunes in the Curonian Spit, The
Geographical Yearbook, 24, 114–119, 1988.
Michaliukait˙e, E.: Dynamics of Curonian Spit shores and dune by last 100 years, The Geographical Yearbook, 8, 97–115, 1967. Minkeviˇcius, V.: Eolic relief of the Baltic Sea cost, The
Geographi-cal Yearbook, 20, 156–160, 1982.
Minkeviˇcius, V., Žilinskas, G., and Jarmalaviˇcius, D.: Morphody-namic evaluation of protecting dune of Kuronian Spit, The Geo-graphical Yearbook, 29, 63–74, 1996.
Mojski, E.: Development of the Vistula River Delta and evolution of the Baltic Sea: An attempt at chronological correlation, Geo-logical Survey of Finland, 6, 39–51, 1988.
Mork¯unait˙e, R. and ˇCesnuleviˇcius, A.: Some aspectsof comparative characteristics of old and new generation of Curonian Spit dune, The Geographical Yearbook, 31, 200–211, 1998.
Mork¯unait˙e, R. and ˇCesnuleviˇcius, A.: Comparative characteristics of old and new generations of Curonian Spit dunes, Coastal dune management, Southport, 41–47, 2001.
Mork¯unait˙e, R. and ˇCesnuleviˇcius, A.: Changes in blowout seg-ments of the Main Ridge in the Curonian Spit in 1999–2003, Acta Zoologica Lituanica, 15, 145–150, 2005.
Mork¯unait˙e, R., Šinkunas, P., Paškauskaite, J., and Cesnulevicius, A.: Wydmy i cechy granulometriczne piasków eolicznych ob-szaru Kazlu Ruda (poludniowo-zachodnia czesc Litwy), Utwory i formy eoliczne, Poznan, 16–24, 2002.
Mork¯unait˙e, R., Baužiene, I., and ˇCesnuleviˇcius, A.: Parabolic dunes and soils of the Curonian Spit, south-eastern Baltic Sea cost, Baltica, 24, 95–106, 2011.
Mork¯unait˙e, R., Radžiuniene, J., Navickas, K., and Bautrenas, A.: Assessment of degradation of white and grey dune habitats in the Curonian Spit: A case study of Parnidis Dune (Nida environs, Lithuania), Zeitschrift für Geomorphologie, 60, 75–87, 2016. Müller, A.: Late and Postglacial Sea-Level Change and
Paleoenvi-ronments in the Oder Estuary, Southern Baltic Sea, Quaternary Res., 55, 86–96, 2004.
Sergeev, A. Y., Zhamoida, V. A., Ryabchuk, D. V., Buynevich, I. V., Sivkov, V. V., Dorokhov, D. V., Bitinas, A., and Pupienis, D.: Genesis, distribution and dynamics of lagoon marl extrusions along the Curonian Spit, southeast Baltic Coast, Boreas, 46, 69– 82, 2016.
Starkel, L.: Holocene palaeogeography, PWN, Warsaw, Poland, 1977.