1473
Volume 64 163 Number 5, 2016
http://dx.doi.org/10.11118/actaun201664051473
DYNAMIC IMAGE OF CHANGE OF SOLUBILITY
IN BINARY EQUILIBRIUM SYSTEM
Petr Dostál
1, Josef Filípek
1, Michal Černý
1, Jaroslav Začal
11 Department of Technology and Automobile Transport, Faculty of AgriSciences, Mendel University in Brno,
Zemědělská1, 61300 Brno, Czech Republic
Abstract
DOSTÁL PETR, FILÍPEK JOSEF, ČERNÝ MICHAL, ZAČAL JAROSLAV. 2016. Dynamic Image of Change of Solubility in Binary Equilibrium System. Acta Universitatis Agriculturae et Silviculturae Mendelianae Brunensis, 64(5): 1473–1482.
Change of solubility in solid state complicates relations in constitution diagrams. The authors have made an animation in which all implications are clearly and unambiguously depicted by means of constitution diagrams and instruments for their interpretation, using phase, structural and complex description.
Keywords: metal alloys, constitution diagrams, solubility change, phase changes, animation
INTRODUCTION
Basic binary constitution diagrams (R I to R Va) illustrate transition from liquid state into solid state with phase changes in solid state (Ptáček, 2003). Change of solubility appears in many metallic systems when crystallization is finished and temperature drops. This reality might lead to problems and to a number of inaccuracies and dubiousness during studies of constitution diagrams. (Fiala et al., 2003).
Presentation of phase changes in technical literature is mostly of static nature. One of possibilities how to reach explicitness and clearness in constitution diagrams interpreting means computer animation. The authors created a dynamic project by means of Adobe Flash; it depicts phase changes in change of solubility in solid state in many implications. Accumulated experience from a number of publications (e.g. Filípek, Černý et al., 2006, Filípek, 2007) and conferences (e.g. Filípek, 2003, 2004) are utilized in this project.
Modelling stems from following premises:
• Phase changes are accomplished under very slow change of temperature under progress of sophisticated diffusion both in solid and liquid states.
• Phase changes are reversible (reverse processes runs during heating than during cooling).
Conception of respective animated programme
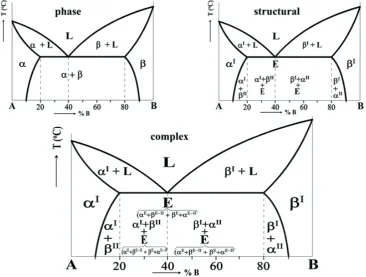
Isobaric binary constitution diagram with full solubility in liquid state with eutectonic change was chosen as an example. (Fig. 1). In solid state, solubility is partial and symmetrical (bilateral), it drops down with decreasing temperature. Chemical composition is stated in percentage by weight and temperature in °C. E.g. under-eutectic lead and tin alloys (pewter???) (Fig. 2) solidify in accordance with constitution diagram of this type.
The system from Fig. 1 can be described in three different ways – as a phase diagram, structural diagram or complex diagram. The shape of the diagram is the same in all three cases, but the description of phases and structure parts differs. Phases L, α and β can be found in constitution diagram. Taking into account the mechanism and kinetics of pf phase changes, further specifications must be made (αI, αII, αE, αE-II, βI, βII, βE, βE-IIa E).
To make it clear and unambiguous, phases and structural parts are shown in different colours in accordance with Fig. 3.
1474 Petr Dostál, Josef Filípek, Michal Černý, Jaroslav Začal
Fig. 5 shows changes that happen during continuous cooling of over eutectic alloy I. The mechanism of solid fluid β crystallization is characterized by formation of stabile nuclei (?) and their following growth. Even handling of heat and creation of equiaxed dendrits in smelt is supposed. With regard to slow cooling, dendritic unmixing (?) is not taken into account. From following eutectic change is absolutely clear that it is a non-variant phase change (Picture. 5b). Crystals of solid liquid α and crystals of solid liquid β (coexistence of three phases) arise under constant temperature from smelt L. When the eutectic crystallization is finished, a cut of structure is marked, which expands spontaneously. (Fig. 5c). Chemical composition of coexisting phases is described by the number of atoms of A phase and B phase in crystal grid of solid solution α and β.
If the temperature drops down, the solid liquid β becomes surfeited with component B and, at the same time, solution β is surfeited with component A. Mutual drop of solubility in solid state causes structural changes depicted in Fig. 5d.
When phase changes are studied in details, the user is free to move the mask of structural or possibly complex depicting. Fig. 6 compares structural and complex description of Sauver’s diagram under different temperatures. Similar date can be obtained from vertical, phase, structural or complex diagrams (Fig. 7). Sauveur’s diagram shows the state for all binary alloys under concrete
temperature. On the contrary, data about concrete alloy under all temperatures are acquired from vertical diagram.
Percentage of representation of individual phases and structural parts in alloy I under eutectic temperature and under ambient temperature is clear from Fig. 1.
Sauveur’s vertical diagrams show only percentage of individual phases and structural parts in alloy I under chosen temperature. The mechanism of creation and morphology of structure are described in details in Fig. 8. When we compare phase, structural and complex depicting, we get a clear idea about the course of change of solubility under heating or cooling.
2: Structure of lead and tin alloy (55 % Pb, 45 % Sn)
1476 Petr Dostál, Josef Filípek, Michal Černý, Jaroslav Začal
4: Stencil for animation creation
Legend:
1. Constitution diagram 2. Sauveur’s diagram
3. Chosen alloy (over eutectic alloy I)
4. Instant temperature of alloy (T1)
5. Vertical diagram of chosen alloy 6. Cooling curve of chosen alloy
7. Auxiliary diagram for determination of fix share in alloy I under temperature T1(it disappears from
the scene during eutectic change)
8. Structure of alloy I under temperature T1
9. Chemical composition of smelt L in alloy I under temperature T1(disappears from scene when eutectic
change is finished)
10. Chemical composition of solid solution β in alloy I under temperature T1(appear on the scene when
the temperature drops down under liquid line)
11. Chemical composition of solid solution αin alloy I under temperature T1(appear on the scene in
the beginning of eutectic change)
12. Mask for structural description (moves by keys “Home”, “End”, “PageUp”, “PageDown”)
13. Mask for complex description Moves by cursor keys ← → ↓ ↑,( it is placed in the scene in a thicker layer than the mask for structural description)
a – end of cooling
1478 Petr Dostál, Josef Filípek, Michal Černý, Jaroslav Začal
c – end of eutectic crystallizing
d – surrounding temperature
a – in the course of eutectic change
b – after finishing of eutectic change
c – under surrounding temperature
1480 Petr Dostál, Josef Filípek, Michal Černý, Jaroslav Začal
CONCLUSIONS
Proposed project dealing with problems of change of solubility in solid state is processed in such a way to depict phase and structural changes in metallic system.
Tools for interpreting of constitution diagram in animation are as follows: Sauveur’s diagram (Fig.), vertical diagram, alloy cooling curve, auxiliary diagram for setting percentage of phases, scheme of structure and clips depicting chemical composition of smelt L, solid solution α and solid solution β. All mutual relations can be monitored by means of phase, structural or complex image.
Acknowledgements
The research has been supported by the project IP 21/2015. “Monitoring of quality of composite materials in agricultural environment” financed by Internal Grant Agency of Agronomic Faculty, Mendel University in Brno.
7: Vertical phase, structural and complex diagram
I: Individual phases and structural particles in alloy I (%)
Temp.
Description
Phase Structural Complex
α β βI Ε αΙΙ βI E αII
TE 16,7 83,3 75 25 - 75
25
-αE βE-II βE αE-II
16,7 - 8,3
-Tenvirons 25 75 65,6 25 9,4 65,6
25
9,4
a – in the course of eutectic change
b – after the end of eutectic change
c – under surrounding temperature
1482 Petr Dostál, Josef Filípek, Michal Černý, Jaroslav Začal
Contact information Petr Dostál: [email protected]
Josef Filípek: [email protected] Michal Černý: [email protected] Jaroslav Začal: [email protected]
REFERENCES
FIALA, J., MENTL, V., ŠUTTA, P. 2003. Struktura a vlastnosti materiálů. 1. vyd. Praha: Academia.
FILÍPEK, J. 2003. Animace fázových přeměn v binárních kovových slitinách. In: Mezinárodní vědecké sympozium Kvalita a spolehlivost strojů. Nitra: 27.5–28. 5. 2003. 98–100.
FILÍPEK, J. 2004. Binární rovnovážné diagramy. In: Trendy technického vzdělávání. UP Olomouc, 22.–23. 6. 2004. Olomouc, 412–415.
FILÍPEK, J., ČERNÝ, M. et. al. 2006. Animovaný diagram železo – uhlík. 1. vyd. Brno: CERM.
FILÍPEK, J. 2007. Animované binární rovnovážné diagramy. 1. vyd. Brno: CERM.