An Improved KNN Text Classification Algorithm
Based on Clustering
Zhou Yong
School of Computer Science & Technology, China University of Mining & Technology, Xuzhou, Jiangsu 221116, China
Email: [email protected]
Li Youwen and Xia Shixiong
School of Computer Science & Technology, China University of Mining & Technology, Xuzhou, Jiangsu 221116, China
Abstract—The traditional KNN text classification algorithm used all training samples for classification, so it had a huge number of training samples and a high degree of calculation complexity, and it also didn’t reflect the different importance of different samples. In allusion to the problems mentioned above, an improved KNN text classification algorithm based on clustering center is proposed in this paper. Firstly, the given training sets are compressed and the samples near by the border are deleted, so the multi-peak effect of the training sample sets is eliminated. Secondly, the training sample sets of each category are clustered by k-means clustering algorithm, and all cluster centers are taken as the new training samples. Thirdly, a weight value is introduced, which indicates the importance of each training sample according to the number of samples in the cluster that contains this cluster center. Finally, the modified samples are used to accomplish KNN text classification. The simulation results show that the algorithm proposed in this paper can not only effectively reduce the actual number of training samples and lower the calculation complexity, but also improve the accuracy of KNN text classification algorithm.
Index Terms—text classification, KNN algorithm, sample austerity, cluster
I. INTRODUCTION
With the rapid development of internet, a large number of text information begin to exist with the form of computer-readable and increase exponentially. The data and resource of internet take on the character of massive. In order to effectively manage and utilize this large amount of document data, text mining and content-based information retrieval have gradually become the hotspot research field in the world. Text classification is an important foundation for information retrieval and text
mining, the main task is assigning text document to one or more predefined categories according its content and the labeled training samples [1]. Text classification has been used extensively. For example, some government departments and enterprises made use of text classification for email filtering. This kind of email classifiers can not only filter out junk emails, but also distribute emails to the corresponding departments according to the content. Text classification technology also widely used in web search engines, which can filter the message that users don’t concern about and supply their interested content. So we can take a conclusion that in the process of information services, text classification is a fundamental and important method, it could help users to organize and access to information and it has very important research value.
Study on text classification abroad dated back to the late 1950s, H.P.Luhn had done some ground-breaking research work and proposed the methodology of using word frequency for text automatic classification. In 1960, Maron published the first paper on text automatic classification, and then, a large number of scholars got fruitful research in this field. So far, the text classification technology in foreign country has been applied in many fields, such as email filtering, electronic meetings and information retrieval. There has also developed a number of relatively mature software, such as Intelligent Miner For Text developed by IBM, which can classify, cluster and get summary for the commercial documents; Net Owl Extractor developed by SAR implemented the function of text clustering, classification and email filtering; and also Insight Discoverer Categorizer developed by TENIS can filter out junk emails and knowledge management for the commercial documents [2].
Study on text classification in China had a late start. Professor Hou Han-Qing had done much research on text mining and introduced the conception of foreign computer management tables, computer information retrieval, and computer text automatic classification in 1981. Afterwards, many researchers and institutions have This work is partially supported by National Natural Science
begun to study the text classification. For, example, Zhu Lan-Juan and Wang Yong-Cheng from Shanghai Jiaotong University developed the Chinese scientific literature experimental classification system in 1987. In 1995, Wu Jun from Electronic Engineering Department of Tsinghua University developed a corpus automatic classification system and a new file classification system by Su Xin-Ning in Nanjing University. Zhang Yue-Jie and Yao Tian-Shun developed a Chinese text of news corpus automatic classification model in Northeastern University in 1998 and improved in 2000. And also developed classification system for Chinese technology text CTDCS by Zhou Tao and Wang Ji-Cheng[2].
Currently, the research on text classification has been made a lot of development, and the common algorithms for text classification include K nearest neighbor algorithm (KNN), Bayes algorithm, Support Vector Machine algorithm (SVM), decision tree algorithms, neural network algorithm (Nnet), Boosting algorithm, etc [2]. KNN is one of the most popular and extensive among these, but it still has many defects, such as great calculation complexity, no difference between characteristic words, does not consider the associations between the keywords and so on. In order to avoid these defects, many researchers had proposed some improvements. On account of the fact that the traditional method lacked of consideration of associations between the keywords, literature [3] proposed an improved KNN method which applied vector-combination technology to extract the associated discriminating words according to the CHI statistic distribution. The technology of vector-combination can reduce the dimensions of the text feature vector and improve the accuracy efficiently, but it can’t highlight the key words which have more contribution to classification. Literature [4] proposed a fast KNN algorithm named FKNN directed to the shortcomings of great calculation, but it can’t raise the accuracy. In order to reduce the high calculation complexity, this paper used clustering method and chosen the cluster centers as the representative points which made the training sets become smaller, and for overcoming the defect of no difference between characteristic words, this paper introduced a weight value for each new training sample which can indicate the degree of the importance when classified the documents, so this algorithm can both increase the efficiency and improve the accuracy of the algorithm.
II. KNN TEXTCLASSIFICATION ALGORITHM
A. Problem Description
Sebastiani pointed out that the process of text classification was assigning category ci to documentdj
for the predefined category collectionC {c1,c2,,ci,,cm} and the given document
collection D {d1,d2,,di,,dn} and creating the mapping from collection D to collection C. More formally, the task is to approximate the unknown target function f :DuCo{0,1} (that describes how
documents ought to be classified) by means of a function f':DuCo{0,1} which is called the classifier such that f and f' “coincide as much as possible” [6]. Namely, the Cartesian product result between collection D and collection C is :
} , , 2 , 1 , , , 2 , 1 |
{dc j ni m
C
Du j i ,
and the value of element djci is 1 means it’s true to
judge documentdj to category ci, otherwise, the value of
element djci is 0 means it’s false to judge documentdj
to category ci.
B. Pre-processing of Text Classification
In order to classify the document, the first problem must be solved is how to represent the document in computer. The common models for text presentation include Boolean Logic Model, Probability Model and Vector Space Model [1]. Vector Space Model has been used in many text classification algorithms because of its merits, and the core idea is to make the document become a numeral vector in multi-dimension space, so this paper also adopts Vector Space Model for text presentation.
The pre-processing of text classification includes many key technologies, such as sentence segmentation, remove stop words, feature extraction and weight calculation.
Sentence segmentation means to divide the sentence which doesn’t have clearly sign between words such as Chinese sentence into words. Sentence segmentation algorithm is introduced to process Chinese documents because of its character. The existing sentence segmentation algorithms include segmentation based on string matching, segmentation based on words understanding and segmentation based on statistic [7]. We used Backward Maximum Matching (BMM) method which is one algorithm of the segmentation based on string matching in this paper, and the machine dictionary used in BMM is from a standard vocabulary which includes 213663 words [8].
The words which can’t reflect the content of document and nearly have no effect on classification are called stop words, so it’s necessary to remove the stop words and it also reduces the dimension of vector. Commonly, stop words vocabulary include expletive, pronoun, quantifier and the other no meaningful words. We can get the Chinese stop words vocabulary from literature [9].
Feature extraction means that choose a subset T’ from the original feature collection T under the condition that T’ doesn’t influence the classification effect. The common methods for feature extraction include Document Frequency, Information Gain, Mutual Information, and CHI Statistic. We use Information Gain for feature extraction in this paper [10].
When considering term W, the information gain is defined as following:
¦
¦
k
j
k
j
j j
j
j PC PW PC W PC W C
P InfoGain
1 1
) / ( log ) / ( ) ( ) ( log ) (
¦
k
j
j j W PC W C
P W P
1
Where, )P(Cj is the ratio of the number of
j
C category documents to the number of all training
documents; P(W) is the ratio of the number of documents which include term W to the number of all training documents; P(Cj/W) is the ratio of the number of documents which include term W and belong to
j
C category to the number of documents which include
term W in all training samples; P(W)is the ratio of the number of documents which don’t include term W to the number of all training documents; P(Cj/W)is the ratio
of the number of documents which don’t include term W but belong to Cjcategory to the number of documents
which don’t include term W in all training samples; After calculating information gain, in order to reduce then dimension, we removed the terms which satisfy that Its InfoGain less than a given threshold and treated the InfoGain as the weight value for the other term. With pre-processing for the document, it becomes a plain vector, and then we can use it for classification.
C. KNN Text Classification Algorithm
KNN is one of the most important non-parameter algorithms in pattern recognition field [11] and it’s a supervised learning predictable classification algorithm. The classification rules of KNN are generated by the training samples themselves without any additional data. KNN classification algorithm predicts the test sample’s category according to the K training samples which are the nearest neighbors to the test sample, and judge it to that category which has the largest category probability. The process of KNN algorithm to classify document X is [12]:
Suppose that there are j training categories asC1,C2,Cj, and the sum of the training samples isN.
After pre-processing for each document, they all become m-dimension feature vector.
1˅Make document X to be the same text feature vector form (X1,X2,Xm) as all training samples.
2˅Calculate the similarities between all training samples and document X . Taking the ith document
) , , ,
( i1 i2 im
i d d d
d as an example, the similarity
) , (X di
SIM is as following.
2 1 2 1 1 ) ( ) ( ) , (
¦
¦
¦
m j ij m j j m j ij j i d X d X d XSIM ˄1˅
3) Choose k samples which are larger from N similarities ofSIM(X,di),(i 1,2,,N), and treat them
as a KNN collection of X . Then, calculate the probability of X belong to each category respectively with the following formula.
¦
KNN d j i i j i C d y d X SIM C XP( , ) ( , ) ( , ) ˄2˅
Where, )y(di,Cj is a category attribute function, which
satisfied ¯ ® j i j i j i C d C d C d y , 0 , 1 ) , ( .
4˅Judge document X to be the category which has the largestP(X,Cj).
The traditional KNN text classification has three defects [13]: 1) Great calculation complexity. When using traditional KNN classification, in order to find the K nearest neighbor samples for the given test sample, it must be calculated with all the similarities between the training samples, as the dimensions of the text vector is generally very high, so its has great calculation complexity in this process which made the efficiency of text classification very low. Generally speaking, there are 3 methods to reduce the complexity of KNN algorithm: reducing the dimensions of vector text [4]; using smaller data sets; using improved algorithm which can accelerate to find out the K nearest neighbor samples [5]; 2) Depending on training set. KNN algorithm does not use additional data to describe the classification rules, but the classifier are generated by the self training samples, this made the algorithm depend on training set excessively, for example, it need to re-calculated when there is a small change on training set; 3) No weight difference between samples. As formula (2), the category attribute function has pointed out that the traditional KNN algorithm treated all training samples equally, and there is no difference between the samples, so it don’t match the actual phenomenon which samples have uneven distribution commonly.
III. IMPROVEDKNN TEXTCLASSIFICATION ALGORITHM BASED ON CLUSTERING
In the practical application of text classification algorithms, it may be have multi-peak distribution problems between each category because of the uneven distribution of data. Specifically, the distribution in a category isn’t compact enough, which lead to that the distance between samples in the same category is larger than distance between samples in different categories. As shown in Figure 1, the distance between d2 and d3 in
k
C is larger than the distance between d1 in Cj and d2
in Ck ; the distance between d4 and d5 in Ci is also
larger than the distance between d1 in Cj and d4 in Ci.
For this distribution in Figure 1, both KNN algorithm and SVM algorithm can give the correct classification results.
In order to facilitate the description of the algorithm, assumption that there are j training categories asC1,C2,,Cj , and the number of samples in each
category is
j
C C
C N N
N , , ,
2
1 , so the sum of all samples
is
¦
j i Ci N N 1and the documents in the ith category Ciis
} , , ,
{di1 di2diNci . After pre-processing for each
is( , , , )
2 1 in inm
in d d
d . Moreover, we suppose that symbol
i
C is still representing the category after sample austerity and the number of the samples in category Ci is stillNCi.
A. Methodology of algorithms
In order to improving the multi-peak effect which generated by the issue of the uneven distribution of samples, reducing the complexity of traditional KNN algorithm and increaseing the accuracy of the classification, this paper proposed an improved KNN text classification algorithm based on clustering. Firstly, dealing with the given training sets by austerity process and removing the samples which near by the border, so it can eliminate the multi-peak effect of the training sample sets. Then, each category of training sample sets is clustered by k-means clustering, and all cluster centers are taken as the representative points (that is to say they are new training samples). At last, a weight value is introduced for the new samples in different categories, which can indicate the different importance of each sample. The classification accuracy can be raised by these improvements.
B. Sample Austerity
The process of sample austerity was shown in Figure 2. When sample austerity, in the first place is calculating the center point of each category. Taking Ci as an
example to calculate the center pointOi(Oi1,Oi2,,Oim):
¦
Cii
N
n inm C
im d
N O
1 1
˄3˅
Then, calculate the Euclidean Distances between the center point Oi and all sample points inCi. Taking the
nth document in Ci as an example, the Euclidean
Distance is:
¦
mj
ij inj
in d O
D 1
2 )
( ˄4˅
At last, remove the border samples which are far away from the center point Oi according the Euclidean
distances toOi. As an example in Figure 2, the sample d1 inCj, the sample d2㧘d3 in Ck and the sample d4㧘d5
in Ci are targets to be removed. The samples after
sample austerity are all kept into the broken line.
C. Generate Representative Points
In the traditional KNN algorithm, all training samples were used for training, that is, whenever a new test sample need to be classified, it is necessary to calculate similarities between it and all samples in the training sets, and then choose k nearest neighbor samples which have larger similarities. Due to test sample have to be calculated similarities with all the training samples, so the traditional method of KNN has great calculation complexity. Against the problem, this paper introduced a clustering method. Firstly, each category of training sample sets is clustered by k-means clustering. Secondly, cluster centers are chosen as the representative points, they become the new training samples. Thirdly, calculate similarities between the test sample and the representative points, and then choose k nearest neighbor samples, which will be classified samples for classification.
D. Revise the Weight of Samples
From section 2.3, we can see that when calculated P(X,Cj) , which is the probability of document X belonging to each category in the traditional KNN algorithm, ifdiCj, then the value of category
attribute function is 1, else ifdiCj, then the value is 0.
It has an obvious defect that the values of the function for all samples in Cj are all equal to1, so there’s no
difference between each sample, and the contribution for each sample in Cj is the same when using them for
classifying document X . But in the application, the distribution of training samples is often uneven and the importance of each sample is often different because of various factors in practice. Therefore, it’s necessary to measure the importance of each sample and assign the weight value for them on the basis of their contribution to the results of classification.
After k-means clustering algorithm for each training category, there’s only some cluster centers left for representation of corresponding category and they become the true training samples for this paper’s algorithm. The importance of each cluster center is measured by the number of samples in the same cluster, namely, the more samples the cluster included, the more importance of its cluster center.
Take Ci category as an example, suppose if it’s
divided into Si clusters by k-means algorithm, so we can
get Si cluster centers{Wi1,Wi2,,WiSi} which will be used
for represented Ci category. We also suppose that the
numbers of samples in Si clusters are
} , , ,
{Numi1 Numi2 NumiSi respectively, so the weight
value for cluster center Wij can be calculated by
i
C ij
N Num
,
namely, we get the new category attribute function as following:
° ¯ ° ®
j ij
j ij C
ij
j ij
C W
C W N Num C
W y
i
, 0
, )
,
( ˄5˅
E. Steps of Algorithm
Input: Documents in categoryCi,{di1,di2,,diNci}, the
clusters Si,i 1,2,,j when using k-means algorithm and the test sample document X.
Output: Document X’s category isCi.
Step1: Document X and all training samples should be pre-processed, and the corresponding feature vector saved in the xml file which can be used in the following steps.
Step2: Deal with the given training sets by austerity process and removing the border samples, take Ci
category as an example, we use formula (3) to calculate the center.
Step3: Calculate the Euclidean Distances Din between
the center point Oi and all samples {di1,di2,,diNci}inCi
by formula (4).
Step4: Remove the sample if it satisfiesDin !Di,(0ndNCi), with the given threshold
i
D , shown as Figure 2.
Step5: Using k-means algorithm to clustering for each category (Figure 3), and record the number of samples in each clusters, then, calculate each center’s weight value by formula (5).
Step6: Using all cluster centers as new training sets for improved KNN algorithm to classify the test document X. As the same as the traditional KNN algorithm, we calculate the similarities between all training samples and document X., and choose k samples which have larger similarities to compose a KNN collection for X. Then, calculate the probability of X belong to each category respectively with the following formula (6).
¦
KNN
W
j ij ij j
ij
C W y W X SIM C
X
P( , ) ( , ) ( , ) ˄6˅
Where, y(Wij,Cj) is the improved category attribute
function which can indicate the different importance of cluster center Wij inCj category, and if WijCj, then
the weight value is 0, namely, it satisfy formula (5). Step7: Judge document X to be the category which has the largestP(X,Cj), if suppose that P(X,Ci) is the
largest, and then outputCi.
IV. EXPERIMENTS AND ANALYSIS
A. Experimental Data and Environment
algorithm. Table 1 shows the specific quantity of samples in each category we chose.
Table 1˖Experimental Data Category Quantity of training
documents
Quantity of testing documents
C1-Art 440 100
C2-History 460 110
C3-Space 450 100
C4-Computer 500 120
C5-Enviornment 480 120
C6-Agriculture 460 110
C7-Economy 520 130
C8-Politics 490 110
C9-Sports 500 110
sum 4300 1010
Experiment environment: CPU is Intel Pentium Dual Core Processor, Genuine Intel(R) CPU 2140 1.6G; Memory is 2G DDR2; Windows XP+ Microsoft Visual Studio 2005 C#.netޕ
B. Experiments and Analysis
When evaluation of text classifiers, it must consider both classification accuracy rate and recall rate [15][16].
After classification, suppose that the number of the documents which are Cj category in fact and also the
classifier judge them to Cj category is a; the number of
the documents which are not Cj category in fact but the
classifier judge them to Cj category is b; the number of
the documents which are Cj category in fact but the
classifier don’t judge them to Cj category is c; the
number of the documents which are not Cj category in
fact and also the classifier don’t judge them to Cj
category is d.
Precision is the ratio of the number of documents which judge correctly by classifiers to the number of documents which classifiers judged to this category, so the precision of Cj is defined as following:
) /(
Precison a ab ˄7˅
Recall rate is the ratio of the number of documents which judge correctly by classifiers to the number of documents which are this category in fact, so the recall rate of Cj is defined as following:
) /(
Recall a ac ˄8˅
We can define a composite index called F-value by precision and recall rate as following:
R P
R P F
2 2
) 1 (
E E
E ˄9˅
Where, P is Precision and R is Recall rate,
E ,(0dEdf) is used to show the ratio of Precision and Recall rate. IfE 0, thenFE P; ifE f, thenFE R;
and ifE 1, we will get the F1-value which indicates Precision and Recall rate have the same importance when evaluating the classifiers; if E1 , it stresses the importance of Precision, otherwiseE !1, it stresses the
importance of Recall rate. In this paper, we chooseE 1, namely, F1-value, because of we should reach a compromise between Precision and Recall rate.
We designed 3 experiments to verify the validity of the algorithm as following:
Experiment 1: Using the traditional KNN classification algorithm and the results is shown in Table 2.
It can be seen from the above table that the traditional KNN algorithm doesn’t have satisfactory results and the accuracy is just about 70%, so it’s very necessary to improve the algorithm in order to enhance the accuracy of classification.
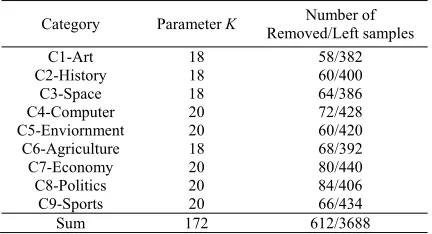
Experiment 2: Using cluster centers as new training samples for KNN classification algorithm directly after sample austerity and clustering. As in use of K-means clustering algorithm, the parameter K which indicates the number of clusters after clustering needs to be specified before running, and in order to avoid great differences between each training category, so we make K-value in each category as approximate as possible. Moreover, we compared some K-values for each category when clustering in the course of experiment, and recorded the K-values which have the best clustering effect. The best K-values, the number of removed border samples and the number of left samples are given in Table 3.
Table 2˖Result of the traditional KNN classification algorithm
Category Precision Recall F1
C1-Art 0.6562 0.6650 0.6606
C2-History 0.6520 0.6520 0.6520 C3-Space 0.7545 0.7433 0.7489 C4-Computer 0.7842 0.7645 0.7742 C5-Enviornment 0.6781 0.7058 0.6917
C6-Agriculture 0.6896 0.6467 0.6675 C7-Economy 0.7058 0.6801 0.6927 C8-Politics 0.6950 0.6950 0.6950
C9-Sports 0.7443 0.7559 0.7501
Average 0.7066 0.7010 0.7036
Table 3˖Parameter K and Number of Removed/Left samples
Category Parameter K Number of Removed/Left samples
C1-Art 18 58/382
C2-History 18 60/400
C3-Space 18 64/386
C4-Computer 20 72/428
C5-Enviornment 20 60/420
C6-Agriculture 18 68/392
C7-Economy 20 80/440
C8-Politics 20 84/406
C9-Sports 20 66/434
Sum 172 612/3688
Table 4˖Number of samples in each cluster in C1-Art category
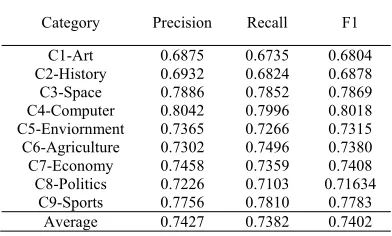
Table 5 shows the results of the KNN algorithm which used the 172 cluster centers as training samples without assigning weight value.
Table 5˖Result of the KNN classification algorithm without weight value
Category Precision Recall F1
C1-Art 0.6875 0.6735 0.6804 C2-History 0.6932 0.6824 0.6878
C3-Space 0.7886 0.7852 0.7869 C4-Computer 0.8042 0.7996 0.8018 C5-Enviornment 0.7365 0.7266 0.7315
C6-Agriculture 0.7302 0.7496 0.7380 C7-Economy 0.7458 0.7359 0.7408
C8-Politics 0.7226 0.7103 0.71634 C9-Sports 0.7756 0.7810 0.7783 Average 0.7427 0.7382 0.7402
Compared the results in Table 5 and Table 2, it is clearly to see that the accuracy of classification has been only improved a little but don’t play a substantial influence when taking the cluster centers for KNN training samples. Analyzing, the little improvement should be benefited from the process of sample austerity which removed the border samples, but these cluster centers are also the training samples for the traditional KNN algorithm, and there’s no differences which indicate the different importance of samples between them, so it can’t improve the classification accuracy efficiently and the results appeared in Table 5.
The algorithm used in this paper used k-means clustering algorithm which had high complexity, but the process of clustering just need to be executed one time. With the clustering for the categories, we can get clustering centers as the new training samples for KNN algorithm, so the number of the samples reduced greatly, which can lower the calculation complexity and raise efficiency of the algorithm. In experiment 1, we recorded the time for running traditional KNN algorithm (excluding the time for pre-processing), and calculated that it nearly took about 48 seconds for classifying one document in average. But in experiment 2, the process of k-means clustering for the categories had taken about 6 hours and the KNN algorithm used 172 samples had just taken about 145 minutes for classifying 1010 test samples, so it’s about 30 seconds for one test sample averagely. By contrast, we found that the algorithm this paper proposed can indeed reduce the time complexity.
Experiment 3: Using the algorithm this paper proposed, namely, sample austerity and clustering for training sets firstly, and then assign the weight value for the new training samples (cluster centers gotten in Experiment 2) according formula (5). The results were shown in Table 6 by this improved KNN algorithm.
From Table 6, it’s clearly to see that the accuracy of classification improved greatly when introducing a
suitable weight value for each training samples, so it confirmed the effectiveness of this algorithm.
Figure 4 shows the relationship between F1-values and each category in these 3 experiments. It shows clearly that the F1-values in experiment 3 are higher than experiment 1 and 2. It indicates that the algorithm this paper proposed is better that the traditional KNN algorithm and it can lower the calculation complexity but also improve the accuracy.
Table 6˖Result of the improved KNN classification algorithm with weight value
Category Precision Recall F1
C1-Art 0.8963 0.9025 0.8994
C2-History 0.9124 0.9225 0.9174 C3-Space 0.9396 0.9267 0.9331 C4-Computer 0.9270 0.9235 0.9252 C5-Enviornment 0.8865 0.8992 0.8928
C6-Agriculture 0.9217 0.9123 0.9170 C7-Economy 0.9152 0.9240 0.9196
C8-Politics 0.8993 0.8769 0.888 C9-Sports 0.9214 0.9158 0.9186
Average 0.9133 0.9115 0.9123
Figure.4 Comparison of F1-value
V. CONCLUSION
This paper proposed an improved KNN text classification algorithm based on clustering, which doesn’t use all training samples as traditional KNN algorithm, and it can overcome the defect of uneven distribution of training samples which may cause multi-peak effect. This improved algorithm used samples austerity technology for removing the border samples firstly. Afterwards, it dealt with all training categories by k-means clustering algorithm for getting the cluster centers which were used as the new training samples, and then introduced a weight value for each cluster center that can indicate the different importance of them. At last, the revised samples with weight were used in the algorithm. Cluster 1 Cluster2 Cluster3Cluster4Cluster 5 Cluster 6
Number 14 18 26 31 20 12
Cluster 7 Cluster 8 Cluster 9Cluster 10Cluster 11 Cluster 12
Number 30 10 19 35 9 22
Cluster 13 Cluster 14 Cluster 15Cluster 16Cluster 17 Cluster 18 Sum
The experiments confirmed the effectiveness of this algorithm.
There are also some limitations in this algorithm, such as the threshold Di was fixed only after calculating all
Euclidean Distances between the center point and all sample points, so how to choose Di before running
algorithm by theoretical analysis is a further study issue. Moreover, how to determine the parameter K-value when clustering for each category and the other methods for weight assignment will also be researched in the future.
ACKNOWLEDGMENT
This work is partially supported by National Natural Science Foundation of China (Grant No. 50674086), National Research Foundation for the Doctoral Program of Higher Education of China (Grant No. 20060290508) , and Project supported by the National Science Foundation for Post-doctoral Scientists of China (Grant No.
20070421041).REFERENCES
[1] Su Jinshu, Zhang Bofeng, Xu Xin, “Advances in Machine Learning Based Text Categorization”, Journal of Software, Vol.17, No.9, 2006, pp.1848í1859
[2] Ma Jinna, “Study on Categorization Algorithm of Chinese Text”, Dissertation of Master’s Degree, University of Shanghai for Science and Technology, 2006
[3] Wang Jianhui, Wang Hongwei, Shen Zhan, Hu Yunfa, “A Simple and Efficient Algorithm to Classify a Large Scale of Texts”, Journal of Computer Research and Development, Vol.42, No.1, 2005, pp.85í93
[4] Li Ying, Zhang Xiaohui, Wang Huayong, Chang Guiran, “Vector-Combination-Applied KNN Method for Chinese Text Categorization”, Mini-Micro Systems, Vol.25, No.6, 2004, pp.993í996 [5] Wang Yi, Bai Shi, Wang Zhang’ou, “A Fast KNN
Algorithm Applied to Web Text Categorization”, Journal of The China Society for Scientific and Technical Information, Vol.26, No.1, 2007, pp.60í64
[6] Fabrizio Sebastiani, “Machine learning in automated text categorization”, ACM Computer Survey, Vol.34, No.1, 2002, pp. 1-47
[7] http://blog.tianya.cn/blogger/post_show.asp?BlogID =420361&PostID=6916260
[8] http://www1.gobee.cn/ViewDownloadUrl.asp ˛
ID=14338
[9] http://download.csdn.net/sort/tag/%E5%81%9C%E 7%94% A8%E8%AF%8D
[10] Lu Yuchang, Lu Mingyu, Li Fan, “Analysis and construction of word weighing function in vsm”,
Journal of Computer Research and Development, Vol.39, No.10, 2002, pp.1205í1210
[11] Belur V, Dasarathy, “Nearest Neighbor (NN) Norms
˖ NN Pattern Classification Techniques”, Mc Graw-Hill Computer Science Series, IEEE Computer Society Press, Las Alamitos, California, 1991,pp.217-224
[12] Yang Lihua , Dai Qi, Guo Yanjun, “Study on KNN Text Categorization Algorithm”, Micro Computer Information, No.21, 2006, pp.269í271
[13] Wang Yu, Wang Zhengguo, „A fast knn algorithm for text categorization”, Proceedings of the Sixth International Conference on Machine Learning and Cybernetics, Hong Kong, 19-22 August 2007, pp.3436-3441
[14] http://www.nlp.org.cn/docs/doclist.php?cat_id=16 [15] Yang Y, Pedersen J O, “A comparative study on
feature selection in text categorization”, ICNL, 1997,pp.412-420
[16] Xinhao Wang, Dingsheng Luo, Xihong Wu, Huisheng Chi, “Improving Chinese Text Categorization by Outlier Learning”,Proceeding ofNLP-KE'05ˈpp. 602-607
[17] Jin Yang, Zuo Wanli, “A Clustering Algorithm Using Dynamic Nearest Neighbors Selection Model”, Chinese Journal of Computers, Vol.30, No.5, 2005, pp.759í762
Zhou Yong was born in Xuzhou, Jiangsu, China, in Sptember 1974. He received the Ph.D. degree in control theory and control engineering from China University of Mining and Technology, Xuzhou, Jiangsu, in 2006. His research interests include data mining, genetic algorithm, artificial intelligence and wireless sensor network. He has published more than 20 papers in these areas. He is currently an Assistant Professor in School of Computer Science and Technology, China University of Mining and Technology, Xuzhou, Jiangsu, China.
Li Youwen was born in Jianli, Hubei, China, in August 1985. He received the Bachelor's degree in electron information science and technology from China University of Mining and Technology, Xuzhou, Jiangsu, in 2007. His research interests is data mining.