Different Ventilation Patterns
Tarek Meakhail
Mech. Eng. Dept. Aswan Faculty of Energy Engineering, Aswan University
Abstract-- This study investigates (numerically and experimentally) airflow characteristics in multi-room building for different ventilation patterns with the same air inlet flow rate. Seven ventilation patterns (full open, pass through, right short circuit, left short circuit, pass through plus right short circuit, pass through plus left short circuit, and (right and left short circuit) are considered to study multi-room airflow characteristics. Also, the effect of door opening percentage on airflow characteristics in multi-room buildings is studied. The results show that although the air flow rate is the same for the seven ventilation patterns the airflow characteristics are quite different for various ventilation patterns. The ventilation pattern has a major effect on the air change. Also, the results indicate that the door opening percentage affected airflow characteristics in multi-room buildings and the model predications are in good agreement with the experiments.
Index Term-- Airflow; Multi-room, CFD and Ventilation Patterns.
I. INTRODUCTION
Recently, indoor air quality and thermal comfort become important issues, as these are related to both energy conservation and building occupant health. An actual building consists of multiple zones. Real room, however, often have complex geometries which produce flow fields that involved turbulence, flow separation, recirculation, and buoyancy. It is well known that the indoor air quality in buildings is influenced by the ventilation and infiltration of ambient air. Airflow rates between zones in a building can alter indoor air quality in any zone, there is a trend to quantify the air exchange rate between one zone and the adjacent zones.
The indoor air quality and thermal comfort in a room are not only affected by how uniform the air temperature and air velocity are in the occupied zone but also by the air motion and the dominant frequency of the flow fluctuations. These air environmental parameters which have profound influence on air quality and comfort, are controlled by a building’s ventilation system. Consequently, the objective of a ventilation system in a building is usually to provide fresh air and remove contaminants from the ventilated space as quickly as possible, as well as meet the heating and or cooling load of the building.
Numerical solutions are most suitable tools for studying the air flow pattern inside an occupied zone as results can be readily obtained and modifications can be made as required within a short time. It seems that the 3-D numerical simulation offers the ability to predict ventilation characteristics over a wide range of operation parameters and physical configurations. However some specific experimental
works are needed to support the accuracy of the numerical model.
To study indoor airflow either small scale or full scale should be built, however, small scale are constrained by the need for scaling factors for heat transfer and airflow, while full scale environmental chambers for indoor evaluations are expensive and practical experiments are time consuming. Nevertheless, the impact of variables such as opening positions, humidity, and object distribution can be studied via Computational Fluid Dynamic. Academic studies regarding inflow in multi room building have been done. Kao et al.,[1] numerically investigated airflow characteristics and particulate matter transport in multi room buildings for different natural ventilation patterns. Statistical airflow estimation methods were devised by Okuyama et al., [2] for multi-zonal buildings based on the non- negative least square method. Investigation the impact of the assumptions of uniform distribution of air temperature and contaminant concentration in multi –zonal airflow has been done by Wang and Chen [3]. Air movement and contamination transport in a portioned enclosure have been done numerically and experimentally by Chung [4]. The theory of the Wavelet Transform (WT) method by Le at al., [5] and its application to the study of fluctuating characteristics of airflow in building environment. Karava at al.,[6] presents an experimental study of basic cross ventilation flow characteristics that are essential inputs for accurate natural ventilation modeling and design. A model for predicting coupled multi-zone hygrothermal airflow transfer is presented by Qin et al., [7]. The application of the zonal approach for modeling airflow and temperature in ventilated double skin facades has been presented by Jiru and Haghighat [8]. A comparison from relatively simple three dimensional numerical simulations with Laser Doppler Anemometry has been done by Posner et al., [9].
The above CFD and experimental studied on indoor air environment are all restricted to a single room or two room buildings. Kao et al [1] have attempted to study effect of a more complicated ventilation patterns with the same air change rate on indoor air in multi room buildings.
In the present study, the flow characteristics are studied in a multi-room building for different ventilation patterns as well as different door opening.
II. EXPERIMENTAL ARRANGEMENT
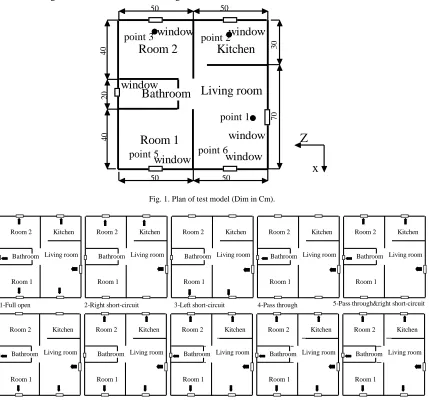
typical full size. The dimensions of the model building are 1m width 1m length and 0.45 m height i.e., it resembles the high building style. There are five rooms inside the building, including one living room, one kitchen, two bedrooms and one bathroom. The thickness of all the walls and indoor partitions of the building is set to be 0.01 m. Each room has at least one door and one window for ventilation. The airflow in the building is measured to be 32 °C iso-thermal. The dimension of all the doors in the building is 0.1m in width and 0.2 m in height. The size of the window in the bathroom is only 0.06 m width, 0.06 m height. Other windows have dimensions of 0.1 m in width, 0.1 m height. Outdoor air enters through the
window in the living room. Thus, the inlet opening size is 0.01 m2. The velocity of the inflow air is 0.2 m/s for natural ventilation. Seven typical types of cross-flow displacement ventilation, i.e., full-open, pass-through, right short-circuit, left short-circuit ventilation, pass-through plus right short circuit, path through plus left short circuit, and right plus left short circuit ventilation. Moreover, three more cases of full open ventilation at 75 percent, 50 percent and 25 percent of door opening are established for the Kitchen, Room1 and Room2, for the purpose of investigating the indoor flow characteristics in multi-room building as shown in Fig. 2.
window
window
window
window
window
window
Kitchen
Room 2
Room 1
Bathroom Living room
point 1 50 50 30 70 40 40 20
50 50
x
Z
point 2 point 3
point 5 point 6
Fig. 1. Plan of test model (Dim in Cm).
Kitchen Room 2
Room 1
Bathroom Living room
1-Full open 2-Right short-circuit 3-Left short-circuit 4-Pass through 5-Pass through&right short-circuit Kitchen
Room 2
Room 1
Bathroom Living room
Kitchen Room 2
Room 1
Bathroom Living room
Kitchen Room 2
Room 1
Bathroom Living room
Kitchen Room 2
Room 1
Bathroom Living room
Kitchen Room 2
Room 1
Bathroom Living room
6-Pass through&left short-circuit 7-Right& left short circuit 8-Full open & 75% door open 9-Full open & 50% door open 10-Full open 25% door open Kitchen
Room 2
Room 1
Bathroom Living room
Kitchen Room 2
Room 1
Bathroom Living room
Kitchen Room 2
Room 1
Bathroom Living room
Kitchen Room 2
Room 1
Bathroom Living room
Fig. 2. Ventilation patterns
The model is connected to an air blower that supplies continuous flow air for the purpose of natural and forced ventilation as shown in Fig.3. It is driven by an AC electric motor of 0.746 Kw. It is connected to a speed control. It runs at constant speed of 285 rpm. The suction side has a circular
Multi-room model
Duct
Blower
HFig. 3. Layout of the test rig.
The experiments are used to demonstrate quantitatively the comparison between experimental and numerical velocity distribution. A simple Hot-wire Anemometry (HWA) is used to measure the mean flow velocity.
The experimental procedures for air velocity measurement in ventilated rooms are carried out as following.
1- The blower was switched on and air was blown into the test model for some time to reach steady state condition.
2- The entering air velocity is fixed to 0.2 m/s with help of the speed control.
3- The digital hot-wire anemometry screen adjusted to zero reading.
4- Recording of the air velocity at each hole at the various vertical locations are done ie.,( h/H = 0.1 to 0.9 with step 0.1)
Numerical methodology
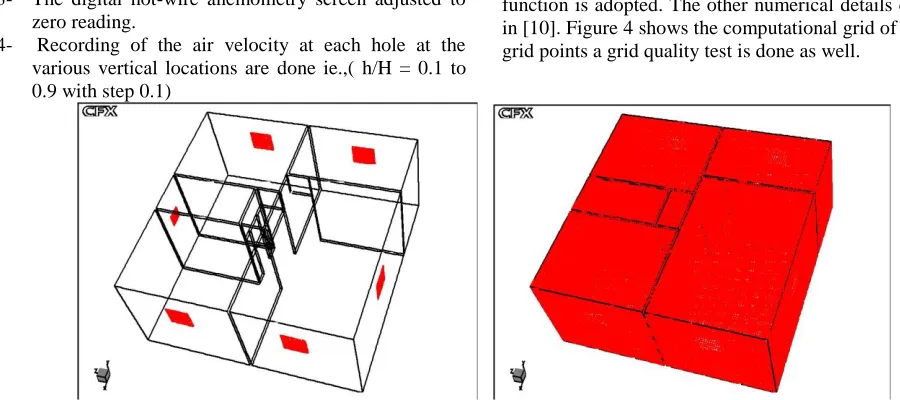
In the present study, a numerical model is adopted to simulate ten ventilation cases. First, a 3-D turbulent flow model CFX-TASC flow [10] code is used to simulate the indoor airflow field. For the present study, the finite volume mesh is developed for the discretization of governing equations. Three kinds of airflow boundary conditions are considered, including the inflow boundary which is the inlet velocity is 0.2 m/s for natural ventilation, outflow boundary is set to opening boundary of the atmospheric pressure and finally the solid surface boundary for the wall boundaries.. At the inflow boundaries, the velocities of inflow have to be defined. Near the regions of indoor solid surfaces, the wall function is adopted. The other numerical details can be found in [10]. Figure 4 shows the computational grid of (101,101,45) grid points a grid quality test is done as well.
Fig. 4. The computational grid
III. RESULTS AND DISCUSSIONS
Effect of ventilation pattern on Indoor airflow
characteristics
Ten runs were carried out using the CFX-Tascflow code on a model of air ventilated multi room. The analysis and discussion include the influences of ventilation patterns, door opening percentage on the indoor air flow characteristics.
To realize airflow characteristics of the multi-room building, the indoor airflow pattern with the airflow velocity vectors, velocity ratio contours are shown in Fig. 5 for the
seven ventilation patters at a level of 0.18 m high from the floor.
It can be seen from Fig.5 that the momentum of the incoming airflow is hindered by the interior partitions in the stream wise direction so that the airflow paths are swerved into the lateral and vertical directions for all flow patterns.
RMS fluctuating velocities in the entire building. Moreover, checking the velocity vectors it can be found that massive recirculation zones are predicted in all rooms. From the velocity contours figure it can be seen that the regions near exit windows have higher velocity values than the interior regions.
In case of right short-circuit ventilation, Fig. 5-b, the Bathroom and the Room1 are single sided ventilation rooms. A succinct airflow path from entry to exit is established to exhibit the so-called short circuit effect. It can be seen from the figure that the lateral side deviation and the massive circulation of the mean inflow velocity distribution in the Living room is attributed to the strong short circuit effect rather than the impediment of the interior partition. High mean velocities are found in the Living room and Room2 where receive good air exchange.
As to left short-circuit ventilation as shown in Fig. 5-c, one incoming stream with the short circuit effect lead to good air exchange in the Living room and Room1 and poor air exchange in the Kitchen, Room2 and the Bathroom as they are single sided ventilation. It can be noticed also that the Bathroom has a massive recirculation zoon.
Regarding the pass-through ventilation as shown in Fig. 5-d, due to the limited flow path in the lateral direction,
the inflow streams coming from the Living room are restricted to flow towards the Bathroom, all other rooms are single sided ventilation. The local dimensionless velocity reaches more than double near the exit window of the Bathroom as the ratio of the outlet-to-inlet opening size is as low as 0.36. Also, a massive recirculation zoon can be found in the left side of the Living room more that the right side due the existence of the partition in the front of the window of the Living room.
For pass-through and right short circuit, Fig. 5-e, the Room1 has single sided ventilation pattern while all rooms are double sided ventilation. The ratio of the outlet-to-inlet opening size is 2.36. A high exchange air flow is found in all rooms except the Room1.
For pass-through and left short circuit, Fig. 5-f, the Room2 and the Kitchen have single sided ventilation pattern, while the Bathroom, Living room and Room1 have double sided ventilation pattern. The ratio of the outlet-to-inlet opening size is still 2.36. A massive recirculation zones are found in the Living room around the inlet stream.
Finally, for the right and left short circuit ventilation pattern, Fig. 5-g, the Bathroom has a single ventilation pattern and all other rooms are double ventilation pattern. All rooms have a massive recirculation zone as well as the Bathroom.
a-Full-open ventilation
c- Left short-circuit ventilation
d- Pass-through ventilation
f- Pass through plus left short-circuit ventilation
g- Right short-circuit and left short-circuit ventilation Fig. 5. Indoor airflow characteristics of the multi-room building
Effect of door opening percentage on the flow characteristics
A qualitative analysis of the air flow pattern inside the multi room building is also done for different percentage of the door opening for the Kitchen, Room1 and Room 2. A quantitative analysis will be done in the next section.
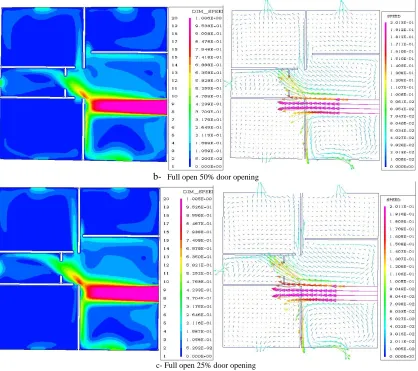
Figure 6-a, shows the air flow characteristics for full open pattern at 75 percent door opening. Comparing this figure with full open pattern (Fig. 5-a), it can be seen that due to the partial close of the doors in the Kitchen, Room1 and Room2, it makes the Bathroom receives more flow. Closing to 50 percentage of the doors, (Fig. 6-b) increases the flow entering the bathroom and it becomes higher when closing to 25 percentage as shown in Fig. 6-c.
b- Full open 50% door opening
c- Full open 25% door opening
Fig. 6. Indoor airflow characteristics for different door opening
Effect of flow pattern on the air change rate and volume flow rate
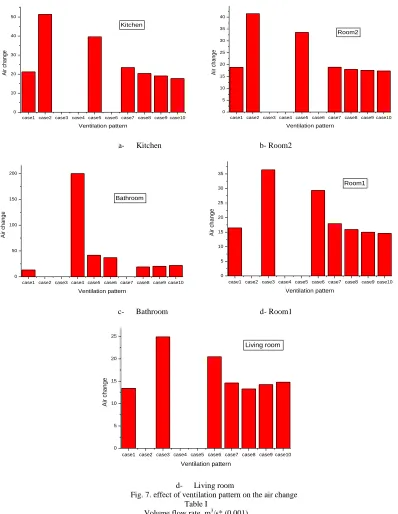
In this section, an average estimation is performed for each case to quantify the effect of each flow pattern on the volume flow rate entering each room hence it would be interested to study the air change rate for each room. The ten cases are in the order shown in the Table I and will be denoted from case1 to case10 respectively for the ease of representation. Table I also shows the inlet and outlet volume flow rate for each room for every case. The air change for natural ventilation of inlet velocity of 0.2 m/s is 16 h-1 for the entire building which considered being relatively high value because of the size of the small size of the model. The total inlet volume flow rate is 0.002 m3/s. The flow in different rooms is analyzed with the help of Table I and Fig. 7 as follows:
- The Kitchen
As shown in Fig. 7-a, and Table I, the kitchen receives the highest flow rate for the case2 (right short circuit). About 48 percent of the inlet air is directed to the kitchen for this
ventilation pattern where the air change reaches to N=51h-1. The effect of door opening is also shown (cases 8,9 and 10), the air change decreases gradually with decreasing the percentage door opening from N=20 h-1 at 75 percent, N=19 h -1
at 50 and N=18 h-1 at 25 percent.
- The Room2
Figure 7-b shows that Room2 has maximum air change for the case2 also (right short circuit), it reaches a maximum value of N=41h-1. The air change decreases gradually with decreasing the percentage door opening from N=18 h-1 at 75 percent, N=17.5 h-1 at 50 and N=17 h-1 at 25 percent respectively.
- The Bathroom
Bathroom with decreasing the percentage door opening from N=19 h-1 at 75 percent, N=20 h-1 at 50 and N=21 h-1 at 25 percent respectively.
- The Room1
Due to the left short circuit effect (case3), Room1 receives the maximum air change of 36 h-1, as shown in Fig. 7-d. In (case7), due to right and short circuit effect, Room1 slightly receives more air than full open (case1). The effect of door opening allows the air change rate to decrease with decreasing the percentage door opening from N=16 h-1 at 75
percent, N=15 h-1 at 50 and N=14.5 h-1 at 25 percent respectively.
- The Living room
The left short effect also makes the air change rate being at maximum value of N=25 h-1 for the living room. The full open (case1, N=13) is less than case 6, N=20 and case 7, N=14 respectively as shown in Fig. 7-e.
case1 case2 case3 case4 case5 case6 case7 case8 case9 case10 0 10 20 30 40 50 Ai r ch a n g e Ventilation pattern Kitchen
case1 case2 case3 case4 case5 case6 case7 case8 case9 case10 0 5 10 15 20 25 30 35 40 Ai r ch a n g e Ventilation pattern Room2
a- Kitchen b- Room2
case1 case2 case3 case4 case5 case6 case7 case8 case9 case10 0 50 100 150 200 Ai r ch a n g e Ventilation pattern Bathroom
case1 case2 case3 case4 case5 case6 case7 case8 case9 case10 0 5 10 15 20 25 30 35 Ai r ch a n g e Ventilation pattern Room1
c- Bathroom d- Room1
case1 case2 case3 case4 case5 case6 case7 case8 case9 case10 0 5 10 15 20 25 Ai r ch a n g e Ventilation pattern Living room
d- Living room
Fig. 7. effect of ventilation pattern on the air change Table I
Case 2 Right short circuit 2 0.96375 1.03625 0 0 0
Case 3 Left short circuit 2 0 0 0 0.91 1.09
Case 4 Pass through 2 0 0 2 0 0
Case 5 Pass through + Right short circuit
2 0.7435 0.8385 0.418 0 0
Case6 Pass through + left short circuit
2 0 0 0.371 0.733 0.896
Case 7 Right and left short circuit
2 0.44 0.4725 0 0.4485 0.639
Case8 Full open 75% 2 0.3815 0.449 0.1905 0.398 0.581
Case 9 Full open 50% 2 0.3575 0.44 0.204 0.375 0.6235
Case 10
Full open 25% 2 0.332 0.4325 0.219 0.365 0.6515
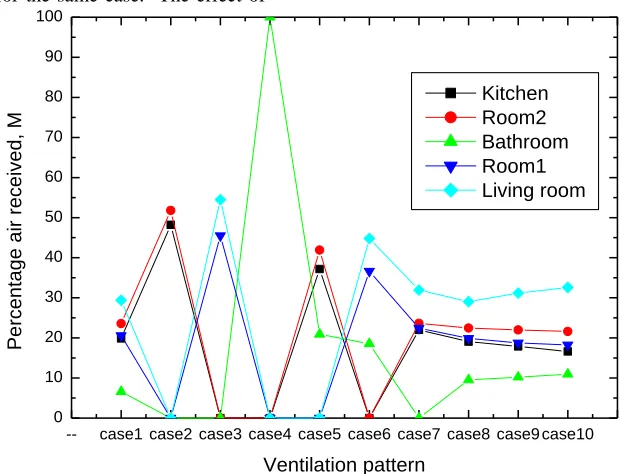
It would be very interesting also to evaluate the percentage of air received in each room for every case as a percentage of the quantity of the inlet air M. Figure 8 shows this evaluation. The Kitchen receives a maximum value of (M=51.4%) for the case2 (right short circuit). Also Room2 receives a maximum value of (M=41.5%) for the same case. The Bathroom receives the 100 percent of the inlet air in case4 (pass through). Room1 receives 45.5 percent maximum in case3 (left short circuit). The Living room receives the maximum value of M=54.5 for the same case. The effect of
door opening has also a slight change of the value of M. Decreasing the door opening from 75% to 25 % will increase the value of M from 9.5% to 10.95 in the Bathroom. The same trend can be found the Living room where M increases from 29% at 75% door opening to 32.5 at 25% door opening. A different trend can be found in the Kitchen, Room2 and Room1, where the Value of M decreases slightly with decreasing door opening.
-- case1 case2 case3 case4 case5 case6 case7 case8 case9 case10
0 10 20 30 40 50 60 70 80 90 100
Pe
rc
e
n
ta
g
e
a
ir
r
e
c
e
iv
e
d
, M
Ventilation pattern
Kitchen Room2 Bathroom Room1 Living room
Fig. 8. Effect of ventilation pattern on the percentage air received
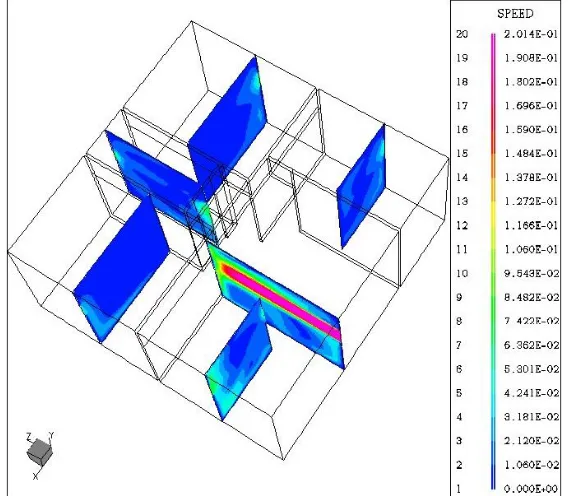
Velocity distortion in the vertical direction
At some selected vertical plans passing through points 1,2,3,4,5 and 6 shown in Fig. 1, the velocity contours are shown in Fig. 9 for the cas1 (full open). A highly distorted flow is found in the plan1 due to the effect of the inlet flow
Fig. 9. The velocity contours in vertical plans
Turbulent kinetic energy
The distribution of turbulent kinetic energy is shown in Fig. 10-a,b. It was found that at inlet velocity of 0.2 m/s the turbulence level is very low, a maximum value of Tke=3.4*10-3 is found in a thin layer near the wall partition in the front of the window of the Living room. Increasing the
value of the inlet velocity (by increasing the speed of the motor to nearly 3000 rpm) to a value of 4 m/s will result in forced ventilation pattern as shown in Fig. 10-b. The turbulence level will be quiet different and higher level of turbulence will prevail in the whole building reaching a maximum value of 5.2*10-1 in the regions surrounding the inlet flow window.
a- Natural ventilation (u= .2m/s ) b- Forced ventilation (u=4 m/s)
Fig. 10. Turbulent Kinetic energy
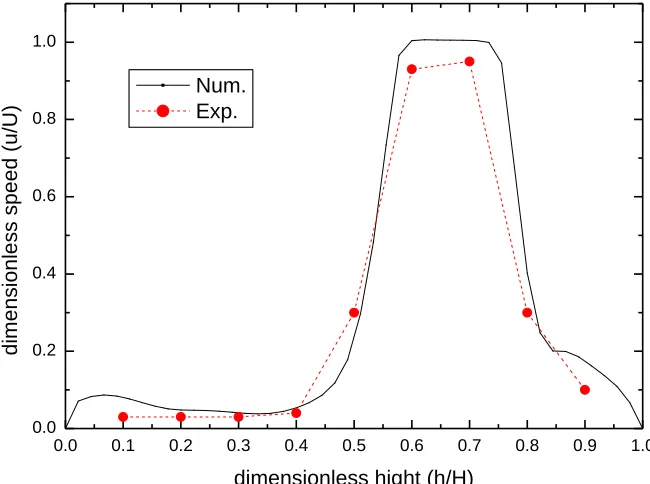
Velocity distribution and comparison to experimental
A sample of the dimensionless velocity distribution in a vertical line passing through point 1 located at 15 Cm from
0.0 0.1 0.2 0.3 0.4 0.5 0.6 0.7 0.8 0.9 1.0 0.0
0.2 0.4 0.6 0.8
d
im
e
n
si
o
n
le
ss
sp
e
e
d
(
u
/U
)
dimensionless hight (h/H) Num.
Exp.
Fig. 11. Comparison between experimental and numerical velocity at point 1
IV. CONCLUSION
As a result of the present analysis, the main conclusions which can be drawn from the present study on room air distribution are:
1- Velocity pattern inside the ventilated rooms and air change are strongly influenced by the air ventilation pattern.
2- A high vertical velocity distortion is obtained in the living room more than other rooms.
3- Full-open ventilation is the best choice as it gives better air change for all rooms.
4- The effect of percentage door opening has a slight effect on air change and mass flow ratio.
5- Good agreement between experimental and numerical results are obtained.
REFERENCES
[1] Hong Ming Kao, Tsang Jung Chang, Yi FangHsieh, Chia Ho Wang, Cheng I. Hsieh “ Comparison of airflow and particulate matter transport in multi room buildings for different natural ventilation patterns” Energy and Buildings 41 2009 966-974 [2] Hiroyasu Okuyama, Yoshinori Onishi, Shin ichi Tanabe, Seiichi
Kashihara “ Statistical data analysis method for multi zonal airflow measurement using multiple kinds of perfluorocarbon tracer gas” Building and Environment 44 2009 546- 557
[3] Liangzhu Leon Wang, Qingyan Chen “ Evaluation of some assumptions used in multizone airflow network models” Building and Environment 43 2008 1671 1677
[4] K. C. Chung “Three-dimensional analysis of airflow and contaminant particle transport in a partitioned enclosure” Building and Environment 34 1999 7-17
[5] Hongjun Li, Xiaochun Chen, Qin Ouyang, Yingxin Zhu “Wavelet analysis on fluctuating characteristics of airflow in building environments” Building and Environment 42 2007 4028-4033
[6] P. Karava, T. Stathopoulos, A. K. athienitis” Airflow assessment in cross ventilated buildings with operable façade elements” Building and Environment 46 2011 266-279
[7] Menghao Qin, George Walton, Rafik Belarbi, Francis Allard” Simulation of whole building coupled hygrothermal airflow transfer in different climates” Energy Conversion and Management 52 2011 1470- 1478
[8] Teshome Edae Jiru, Fariborz Haghighat “ Modeling ventilated double skin façade- A zonal approach” Energy and Buildings 40 2008 1567-1576
[9] J.D. Posner, C. R. Buchanan, D. Dunn-Rankin “Measurement and prediction of indoor air flow in a model room” Energy and Buildings 35 2003 515-526