ISSN (Online): 2320-9364, ISSN (Print): 2320-9356
www.ijres.org Volume 6 Issue 10 Series I ǁ 2018 ǁ PP. 23-29
Improved Accuracy in Determining Elderly Nutritional Status
Using Support Vector Machine Method
*1
Sri Widodo,
2Mursudarinah
*1Faculty of Health Sciences, Duta Bangsa University of Surakarta, Central Java, Indonesia 2STIKES Aisyiyah Surakarta, Central Java Indonesia
Corresponding Author: Sri Widodo
ABSTRACT:
Current method used to determine nutritional status of elderly is by measuring and categorizing with Body Mass Index (BMI) Indicator. Problem of Cadres is difficulty in determining nutritional status of elderly every month and difficulty in documenting data of elderly medical records. If elderly document is lost, development graph of elderly nutritional status can not be traced. The aim of research is to develop intelligent software to detect nutritional status of elderly. Software developed includes the recording of elderly medical record data, detection of elderly nutritional status automatically, and graphic development of elderly weight, height, blood pressure, and hemoglobin,cholesterol, gout and blood sugar.. This research consists of two main points. First is the development of intelligent software to detect the elderly's nutritional status using support vector machine (SVM) and data processing of elderly medical records. Output of intelligent system developed is Elderly Good Nutrition Status, Malnutrition, More Nutritional Status.KEYWORDS:
Body Mass Index, Cadre, Elderly, Elderly Nutritional Status, SVM.
--- --- Date of Submission: 16-01-2019 Date of acceptance: 28-01-2019
--- ---
I.
INTRODUCTION
Our society views older people as less productive, less attractive, less energetic, easy to forget, perhaps less valuable than those who are still in prime condition [1], for which in national development the government has succeeded realizing positive results in various fields, namely economic progress, environmental improvement, advancement of science and technology, especially in the medical or medical fields, so as to improve the quality of people's health and increase the life expectancy of humans [2]. As a result, the elderly population increases and increases tends to be faster or often referred to as Booming Elderly [3]. One of the Indonesia government's efforts to provide health facilities and implement health efforts for the elderly is by holding a Posyandu. Posyandu is one approach to community participation in the health sector. Posyandu is managed by posyandu cadres who have received training, from midwife. Posyandu cadres are health providers who are near target activities of Posyandu. The frequency of posyandu cadres face to face is more frequent than other health workers. Task of posyandu cadres is not just taking care of toddlers, but has been increased to take care of elderly [4-7], included is monitoring nutritional status of elderly.
II.
MATERIAL
Data used in this study can be divided into two. First is data that is used as training data. The data is data that will be used in the classification process. The data is taken from elderly examination which includes data on body weight, height, blood pressure, and hemoglobin levels, cholesterol, gout and blood sugar. Second is data used in the testing process. The data is the data from the examination of the elderly every month. Data collection was conducted at Sejahtera 2 Posyandu, Ponowaren, Tawangsari, Sukoharjo, Middle of Java, Indonesia. Data taken includes elderly medical record data and anthropometric data of the elderly including: body weight, height, blood pressure, and hemoglobin levels, cholesterol, gout and blood sugar.
III.
METHOD
Programming language used in developing software to detect nutritional status of elderly is Matlab programming language [9]. There are stages in developing software to detect nutritional status of elderly people can be described as follows:
a. Create User Interface
User Interface developed is designed as simply [10] as possible so that Posyandu Cadres can easily operate the program.
b. Management of Elderly Medical Record Data
Database development for management of continuous elderly medical record data, so that the data of the elderly medical record of the examination results per month can be well documented, including the status of the development of elderly health. To facilitate monitoring the health of the elderly, data is also presented in graphical form, which includes a graph of the development of body weight, height, blood pressure, and hemoglobin levels.
c. Detection of Elderly Nutritional Status Using Intelligent Sistem.
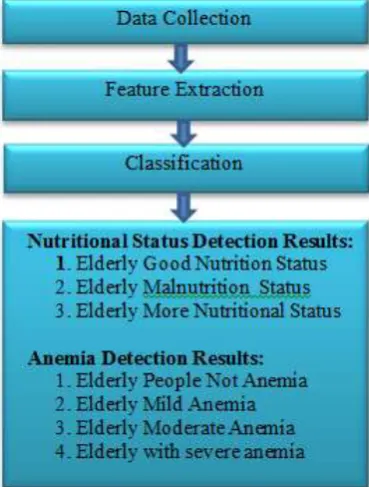
Method used to developt elderly nutritional status and anemia detection is detection of nutritional based on Body Mass Index (BMI) indicator and Hemoglobin levels using Support Vector Machine method. The stages of detection Nutrition status and anemia using intelligent systems can be explained as in Figure 1.
Figure 1. Stages of Methods for Detecting Elderly Nutritional Status
Stages of elderly nutritional status detection can be explained as follows: a. Data Collection from the Posyandu
(BMI) feature. While for anemia detection using hemoglobin level (HB) features. The selected features will later be used for the classification of nutritional status and anemia which include: Elderly Normal Nutrition Status, Elderly Poor Nutrition Status, Elderly More Nutritional status, Elderly No Anemia, Elderly Mild Anemia, Elderly Moderate Anemia and Elderly Severe Anemia.
c. Nutritional Status Detection Using Support Vector Machine (SVM)
Detection of nutritional status of elderly is done by carrying out classification process. One classification method is Support Vector Machine (SVM) [14]. Support Vector Machine (SVM) developed by Boser, Guyon, and Vapnik, was first presented in 1992 at the Annual Workshop on Computational Learning Theory. The basic concept of SVM is actually a harmonious combination of computational theories that have existed decades before, such as hyperplane margins (Duda& Hart in 1973, Cover in 1965, Vapnik 1964, etc.), the kernel was introduced by Aronszajn in 1950, as well as other supporting concepts. But until 1992, there had never been an attempt to assemble these components. Unlike the neural network strategy that seeks to find a dividing hyperplane between classes, SVM tries to find the best hyperplane in input space. The basic principle of SVM is a linear classifier, and then developed so that it can work on non-linear problems by incorporating the kernel trick concept in high-dimensional workspaces. These developments provide stimulation of research interest in the area of pattern recognition to investigate potential SVM capabilities theoretically and in terms of applications. At present SVM has been successfully applied in real-world problems, and generally provides better solutions than conventional methods such as artificial neural networks [14]. The program used is MATLAB, which is a language that is highly capable of computational techniques. Matlab combines computing, visualization and programming in a single environment (MathWork). The Software Module used is the Image Processing Toolbox. Toolbox is a compilation of functions given by matlab with the implementation of special image processing algorithms[9].
IV.
RESULTS
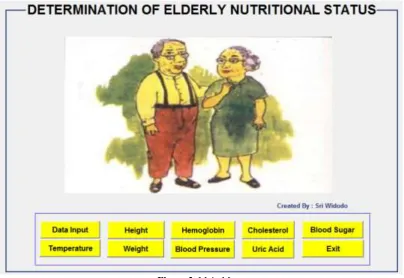
Application to detect nutritional status of elderly is designed to facilitate posyandu cadres in recording elderly medical record data, automatically detecting nutritional status, and displaying graphs of monitoring nutritional status of elderly. The main menu of application developed can be seen in figure 2.
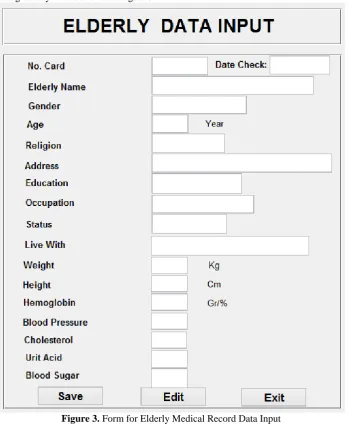
Form for inputting elderly data is shown in Figure 3.
Figure 3. Form for Elderly Medical Record Data Input
After entering elderly examination data every month, system will display detection results of elderly nutritional status which includes normal nutrition elderly, malnourished and excess nutrition. Results of elderly nutritional status detection are shown in figure 4.
Figure 4. Display of Detection Results of Elderly Nutritional Status
.
Figure 5. Display Results Detection of Elderly Anemia Status
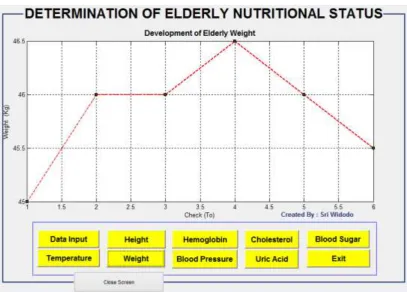
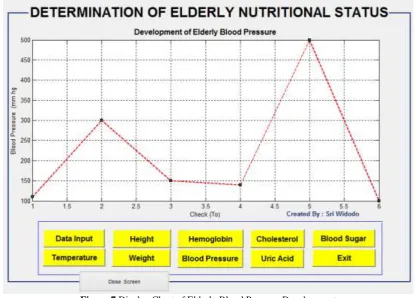
In this study also included a graph to monitor progress of data on elderly health. The chart includes graphs of temperature development, height, weight, hemoglobin, blood pressure, cholesterol, gout and blood sugar levels. Examples of charts to monitor progress of elderly health are shown in figures 6 and 7.
Figure 7 Display Chart of Elderly Blood Pressure Development
To find out accuracy of system being developed, it was tested seven times. The first is a system based on temperature, second is based on body weight, third is based on blood pressure, fourth is based on cholesterol, fifth is based on blood sugar, six is based on hemoglobin and seventh is based on all. Results of tests are shown in table 1.
Table 1. Data Testing Results
No Number of Test Data Test Result Test 1 (temperatur e) Test 2 (weight) Test 3 (blood presure) Test 4 (cholesterol ) Test 5 (blood sugar) Test 6 (Hemoglobi n) Test 7 (temperature, weight, blood presure, cholesterol, blood sugar, Hemoglobin)
1 20 100% 100% 100% 100% 100% 98.2% 94.6%
The training data used in the system developed were 300 data. The data consists of data from 0 to 100 are data on elderly normal nutritional status, 101 to 200 data on elderly malnutrition status and 201 to 300 are data on elderly normal more nutritional status. The features used to detect the nutritional status of the elderly are weight, height and blood pressure. Training data used to detect anemia in elderly as many as 160 data. The feature used is the hemoglobin level of the elderly. The test is done using 20 testing data. The test results based on temperature, height, weight, cholesterol and blood sugar were 100%. While the results of anemia testing based on hemoglobin were 98.2%. Results of testing nutritional status of elderly based on all features showed an accuracy 94.6%.
V.
CONCLUSION
www.ijres.org 29 | Page
REFERENCES
[1]. Kroll, W. dan Hawkins, D. (1999), Living Excellence at Dusk,Interpreting by Setiadarma, Y.E. Yogyakarta: YayasanAndi [2]. Almatsier, Sunita (2009), Basic Principles of Nutrition. Jakarta :Gramedia
[3]. Nugroho, W (2000), Gerontik Nursing, Edisi-2. Jakarta:EGC.
[4]. Department of Health (1987), Posyandu, Center for Public Health Counseling. Jakarta.
[5]. Gunawan L. A. danHariSutejo(1980), Village Community Health Development, Jakarta, IAKAMI. [6]. Karo-KaroSantoso. A New Superstar Cadre in the World of Health, MajalahKesehatan No. 72 tahun 1979. [7]. Mantra I.B. Dr. Community Expectation Cadre, Nutrition Refinement Development Project, Jakarta 1987.
[8]. Health Ministry of Republic of Indonesia (2010), Guidelines for Nutrition Status ThroughPosyandu. Jakarta :Depkes. [9]. MathWorks, n.d., (2004) „Matlab: The Language of Technical Computing‟, html page, viewed 25th th27 October 2004. [10]. Jogiyanto. 2005. Information System Analysis and Design.Yogyakarta:Andi Offset.
[11]. ArifMuntasa, Muhammad Hariadi, MauridhyHeryPurnomo (2009), A new Formulation of Face Sketch Multiple Features Detektion Using Pyramid Parameter Model dan Simultaneously Landmark Movement, International Journal of Computer Science Network and security, Vol 9.
[12]. Duda, R., Hart, P., and Stork, D. (2000), “Pattern Clasiffication”, Second Edition. J. Wiley and Sons, Inc.
[13]. Widodo S., Siti Farida, FitriaIkaWulandari,AgungSuryadi, (2016), Toddler Nutritional Status Monitoring Using Intelligent System, International Journal of Research in Engineering and Science (IJRES) Volume 4 Issue 12 , December 2016, PP.10-14
[14]. Nugroho, A.S., Witarto, B.A., Handoko, D., (2003), Support Vector Machine – Theories and their Applications in Bioinformatics, Public Lecture of Komputer.com.