Individual Parameter Selection Strategy for Artificial
Algae Algorithm (AAA)
Mehmet Beskirli*, Ismail Koc, Halife Kodaz
Department of Computer Engineering, Selçuk University, Konya, Turkey.
* Corresponding author. Tel.: +903322233711; email: [email protected] Manuscript submitted April 15, 2017; accepted July 30, 2017.
doi: 10.17706/jcp.13.4 450-460.
Abstract: Optimization, defined as the process of selecting the best one among all of the possible solutions to a problem within certain constraints, is used for the solution of engineering and numerical functions. The metaheuristics algorithm used for the solution of a wide variety of problems has been developed by influencing the behavior of living things in nature. The Artificial Algae Algorithm (AAA), proposed by Uymaz and one of the biologically inspired optimizations, was used in this study. The AAA is one of the various methods of numerical optimization. In this study, a fine tuning of the control parameters for the AAA was implemented over its different kernel parameters. For this process, the AAA was tested on eight different benchmark functions with different characteristics by making finer adjustments over the parameters. The effect of the parameters was analyzed in terms of both solution quality and convergence speed.
Key words: Artificial algae algorithm, benchmark functions, parameter tunings.
1.
Introduction
In the quest for a key for the solution to problems which are difficult or impossible in real life, it has been noticed that the result of problems solved by modern heuristic methods in a computer environment is close to the true values [1], [2]. Researchers have improved various algorithms to solve these problems[3]. These are the examples of algorithm: the Genetic Algorithm (GA)[4] and the Differential Evolution Algorithm (DE)[5], the Artificial Algae Algorithm (AAA)[6] based biology, the Gravitational Search Algorithm (GSA)[7] based physics, the Particle Swarm Optimization (PSO)[8], the Ant Colony Optimization (ACO)[9], the Bat Algorithm (BA) [10] based flock, the Tabu Search Algorithm (TS)[11] based social, the Harmony Search Algorithm (HS)[12] based music and the Artificial Chemical Reaction Optimization Algorithm (ACROA)[13] based chemistry.
As one can observe, living things in nature inspire science from the past to the present day. Many of these creatures have a major role in the emergence of new developments. Scientists developed many algorithms by imitating the behaviors of these creatures [2], [14]. In this article, the performance of the algorithm increases by changing the setting of the parameter using the Artificial Algae Algorithm.
increases by making adjustments on the AAA parameters, namely: the effect of the population, shear force, energy loss and adaptation. The AAA that has original parameter values and an AAA that makes another arrangement of the parameters have been tested on eight benchmark functions, all of which have different characteristics.
2.
Orijinal Artifical Algae Algorithm (AAA)
Inspired by characteristic features and life of AAA microalgae, Uymaz [18]developed a new biologically based metaheuristic method in 2015.
Algaes have various habitats like sea, fresh water, terrestrial ecosystems and icecaps. Along with these, light intensity, temperature and fluid composition changes which impact the growth of algae determine the dominant type of algae. Algaes have various types, such as blue and green algae. Algaes that are photosynthetic eukaryotic organisms include separate nuclear membranes and chlorophyll. There are two types: single and dual-cell. Single-celled algae are called microalgae, and double-celled algae are called macroalgae. Microalgaes are called phytoplankton, while macroalgaes are called marine algae, which can be in the appearance of macro-plant and have meters of length. The Artificial Algae Algorithm was developed by observing microalgaes [6].
In this algorithm, each solution in the problem space corresponds to an artificial algae colony. Artificial algae needs a light source to photosynthesize and progresses to the light source. At the same time, it moves in a helical swimming manner. AAA consists of three sections: evolutionary process, adaptation and helical movement. It is an algorithm that was improved by considering these features of algae[19], [20].
Denote the algae population, which comprises of a number of algal colonies, as equation 1 and 2:
Algae colony population [ ] (1)
[ ] (2)
Here 𝑗
. is algae cell of 𝑗. dimension algae colony. The number of algae cells in the colony is equal to
problem size. Every expresses suitable solution in solution space. It is believed that every algae cells in the algae colony moves suitable place in solution space processional. When algae colony reaches an ideal solution, an optimum result is obtained.
( 𝑗 )( ( )) (3)
( 𝑗 )( ( )) (4)
( 𝑗 )( ( )) (5)
The initial population value of the AAA is designated as 40. The number of the iteration is based on the termination criterion of the algorithm. 2000 was chosen as the number of the iteration. The size of the problem was chosen as 30. The algorithm has been applied 30 times to measure the stability of the study [21]. The algorithm has been applied according to all these parameters. The obtained mean and standard deviation values are presented in the tables.
Fig. 1. Flowchart of AAA [6].
3.
Experimental Studies
In this section, the results of the artificial algae algorithm (AAA) will be shown. These make finer adjustments over the parameters for the mathematical problems in the literature. The AAA which has changed the parameters and the AAA with the default parameter values are both used to minimize the result of eight benchmark functions with different characteristics. These are given in Table 1. The results achieved by this algorithm are presented comparatively in Tables 2, 3, 4 and 5. The parameter values of the results are located in the upper part of Tables 2, 3, 4 and 5.
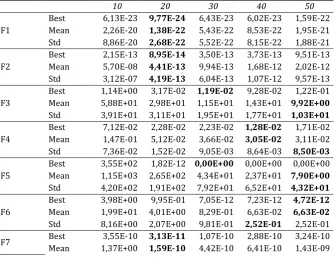
values are chosen randomly and are changeable in the original algorithm. The parameter values, however, were fixed in this study: 0.1, 0.2, 0.3, 0.4 and 0.5 values for adaptation; 0.1, 0.2, 0.3, 0.4 and 0.5 values for energy loss; 10, 20, 30, 40 and 50 values for population and 1, 2, 3, 4 and 5 values for shear force are used instead of the original parameter values of the AAA. The best values of the AAA in these parameters were investigated. Each function has been run 30 times. The best value was shown on Tables 2, 3, 4 and 5 with the best value, the mean value, and the result of standard deviation (robustness) obtained from 30 runs, as well as the parameter values of the AAA. In the comparison tables (Tables 2-9), the minimum mean, best and standard deviation values are given in bold font.
Table 1. Benchmark Functions (C: Characteristic, U: Unimodal, M: Multimodal) [2], [21], [22]
Range C Function Formulation Fitness
F1 [-5.12, 5.12] U Sphere 𝑓 ∑
𝑛
=
0
F2 [-10, 10] U Schwefel 2.22 𝑓 ∑ | |
𝑛 = ∏ | | 𝑛 = 0
F3 [-10, 10] U Rosenbrock 𝑓3 ∑[ 00( ) ( ) ]
𝑛−
=
0
F4 [-1.28, 1.28] U Noise 𝑓4 ∑ 4 𝑟𝑎 𝑑 𝑚[0 ]
𝑛
=
0
F5 [-500, 500] M Schwefel 𝑓5 4 8.98 887 7 43369 ∗ ∑ sin (√| |)
𝑛
=
0
F6 [-5.12, 5.12] M Rastrigin 𝑓6 ∑[ 0cos ( 𝜋 ) 0]
𝑛
=
0
F7 [-32, 32] M Ackley 𝑓7 0exp
{
0. √ ∑
𝑛
=
}
𝑒 { ∑ cos( 𝜋 )
𝑛
=
} 0 𝑒 0
F8 [-600, 600] M Griewank 𝑓8 4000∑
𝑛 = ∏ ( √ ) 𝑛 = 0
Table 2. The Comparison Results of the Different Adaptation Parameters on the Benchmark Functions
0,1 0,2 0,3 0,4 0,5
F1
Best 8,36E-22 4,04E-22 4,59E-22 1,03E-22 1,71E-22
Mean 7,14E-21 3,99E-21 2,11E-21 1,55E-21 1,37E-21
Std 6,09E-21 2,93E-21 1,69E-21 1,79E-21 1,39E-21
F2
Best 1,65E-12 1,14E-12 7,92E-13 6,19E-13 5,29E-13
Mean 3,47E-12 2,35E-12 1,89E-12 1,88E-12 1,36E-12
Std 1,60E-12 8,51E-13 8,82E-13 9,87E-13 6,39E-13
F3
Best 1,18E-01 3,55E-01 1,45E-01 9,70E-02 6,76E-02
Mean 1,87E+01 1,34E+01 1,65E+01 1,57E+01 8,76E+00
Std 2,05E+01 1,90E+01 1,89E+01 1,91E+01 1,30E+01
F4
Best 1,50E-02 1,56E-02 1,80E-02 1,72E-02 1,54E-02
Mean 3,04E-02 3,33E-02 3,19E-02 3,35E-02 3,27E-02
Std 7,84E-03 9,42E-03 9,39E-03 7,31E-03 7,90E-03
F5
Best 7,64E-11 7,28E-12 7,28E-12 1,09E-11 0,00E+00
Mean 1,57E-07 7,12E-09 7,90E+00 7,90E+00 3,95E+00
Std 3,59E-07 1,84E-08 3,01E+01 4,33E+01 2,16E+01
F6
Best 3,30E-09 2,52E-10 1,66E-10 2,55E-11 3,55E-12
Mean 9,53E-07 3,32E-02 6,65E-02 3,32E-02 9,95E-02
F7
Best 2,54E-09 1,13E-09 5,05E-10 2,61E-10 2,24E-10
Mean 8,80E-09 3,14E-09 1,86E-09 1,26E-09 7,19E-10
Std 7,14E-09 1,39E-09 1,05E-09 8,85E-10 3,56E-10
F8
Best 0,00E+00 1,11E-16 0,00E+00 0,00E+00 0,00E+00
Mean 2,41E-13 1,26E-13 8,20E-10 8,61E-14 2,27E-13
Std 1,07E-12 3,03E-13 4,49E-09 3,63E-13 1,11E-12
Table 3. The Comparison Results of the Different Energy Loss on the Benchmark Functions
0.1 0.2 0.3 0.4 0.5
F1
Best 2,67E-24 7,19E-24 4,70E-23 1,05E-21 1,64E-20
Mean 1,63E-23 7,05E-23 8,53E-22 9,60E-21 1,25E-19
Std 1,12E-23 7,73E-23 8,77E-22 7,85E-21 8,34E-20
F2
Best 7,56E-14 1,16E-13 3,69E-13 2,09E-12 8,98E-12
Mean 1,84E-13 3,70E-13 1,78E-12 6,81E-12 3,71E-11
Std 6,92E-14 2,33E-13 1,03E-12 3,58E-12 2,61E-11
F3
Best 3,48E-01 3,70E-01 1,11E-02 1,86E-01 3,89E-02
Mean 1,17E+01 1,57E+01 1,67E+01 1,48E+01 1,45E+01
Std 1,65E+01 1,95E+01 1,95E+01 1,60E+01 1,96E+01
F4
Best 1,53E-02 1,61E-02 7,62E-03 2,43E-02 2,09E-02
Mean 2,57E-02 2,86E-02 2,70E-02 3,71E-02 4,12E-02
Std 5,47E-03 8,21E-03 8,18E-03 7,35E-03 1,13E-02
F5
Best 1,82E-12 1,82E-12 1,82E-12 9,10E-12 5,40E-10
Mean 2,43E-13 7,90E+00 7,90E+00 2,18E+01 5,55E+01
Std 3,87E-12 3,01E+01 3,01E+01 4,53E+01 8,63E+01
F6
Best 3,91E-13 5,38E-13 9,70E-13 1,29E-11 3,40E-10
Mean 3,32E-02 5,72E-10 1,33E-01 4,75E-01 2,36E-01
Std 1,82E-01 1,50E-09 3,44E-01 6,73E-01 5,00E-01
F7
Best 7,83E-11 9,19E-11 2,36E-10 8,59E-10 2,19E-09
Mean 2,03E-10 2,81E-10 7,19E-10 3,12E-09 9,57E-09
Std 1,17E-10 1,16E-10 3,97E-10 1,67E-09 6,59E-09
F8
Best 0,00E+00 0,00E+00 1,11E-16 2,22E-16 3,55E-15
Mean 9,22E-16 3,56E-15 1,82E-14 6,16E-13 2,16E-12
Std 2,83E-15 8,37E-15 3,33E-14 1,59E-12 5,81E-12
Table 4. The Comparison Results of the Different Population on the Benchmark Functions
10 20 30 40 50
F1
Best 6,13E-23 9,77E-24 6,43E-23 6,02E-23 1,59E-22
Mean 2,26E-20 1,38E-22 5,43E-22 8,53E-22 1,95E-21
Std 8,86E-20 2,68E-22 5,52E-22 8,15E-22 1,88E-21
F2
Best 2,15E-13 8,95E-14 3,50E-13 3,73E-13 9,51E-13
Mean 5,70E-08 4,41E-13 9,94E-13 1,68E-12 2,02E-12
Std 3,12E-07 4,19E-13 6,04E-13 1,07E-12 9,57E-13
F3
Best 1,14E+00 3,17E-02 1,19E-02 9,28E-02 1,22E-01
Mean 5,88E+01 2,98E+01 1,15E+01 1,43E+01 9,92E+00
Std 3,91E+01 3,11E+01 1,95E+01 1,77E+01 1,03E+01
F4
Best 7,12E-02 2,28E-02 2,23E-02 1,28E-02 1,71E-02
Mean 1,47E-01 5,12E-02 3,66E-02 3,05E-02 3,11E-02
Std 7,36E-02 1,52E-02 9,05E-03 8,64E-03 8,50E-03
F5
Best 3,55E+02 1,82E-12 0,00E+00 0,00E+00 0,00E+00
Mean 1,15E+03 2,65E+02 4,34E+01 2,37E+01 7,90E+00
Std 4,20E+02 1,91E+02 7,92E+01 6,52E+01 4,32E+01
F6
Best 3,98E+00 9,95E-01 7,05E-12 7,23E-12 4,72E-12
Mean 1,99E+01 4,01E+00 8,29E-01 6,63E-02 6,63E-02
Std 8,16E+00 2,07E+00 9,81E-01 2,52E-01 2,52E-01
F7 Best 3,55E-10 3,13E-11 1,07E-10 2,88E-10 3,24E-10
Std 1,23E+00 1,38E-10 2,80E-10 2,66E-10 8,66E-10
F8
Best 0,00E+00 0,00E+00 0,00E+00 0,00E+00 0,00E+00
Mean 1,13E-02 1,23E-10 2,24E-13 3,70E-14 5,69E-14
Std 1,58E-02 5,97E-10 5,92E-13 1,21E-13 1,46E-13
Table 5. The Comparison Results of the Different Shear Force on the Benchmark Functions
1 2 3 4 5
F1
Best 2,42E-07 1,67E-22 5,20E-10 1,29E-05 6,62E-05
Mean 8,96E-06 1,30E-21 2,16E-09 6,90E-05 7,63E-04
Std 7,03E-06 1,48E-21 1,65E-09 4,79E-05 7,13E-04
F2
Best 1,80E-03 3,68E-13 6,58E-06 6,69E-03 3,63E-02
Mean 1,98E-02 1,39E-12 2,29E-05 2,19E-02 1,21E-01
Std 4,14E-02 6,60E-13 1,30E-05 1,23E-02 6,14E-02
F3
Best 8,38E+00 4,54E-02 1,25E+01 3,10E+01 2,94E+01
Mean 3,34E+01 1,84E+01 6,12E+01 1,20E+02 1,78E+02
Std 1,02E+01 2,12E+01 2,92E+01 4,20E+01 1,25E+02
F4
Best 6,01E-02 1,79E-02 2,62E-02 3,34E-02 8,67E-02
Mean 1,18E-01 3,07E-02 6,08E-02 1,48E-01 2,27E-01
Std 2,98E-02 8,58E-03 1,90E-02 5,11E-02 9,20E-02
F5
Best 8,04E+02 0,00E+00 3,56E+02 1,22E+03 1,10E+03
Mean 1,39E+03 1,97E+01 7,60E+02 1,68E+03 1,71E+03
Std 2,91E+02 4,49E+01 2,28E+02 2,65E+02 2,89E+02
F6
Best 1,38E+01 6,72E-12 4,12E+00 8,71E+00 1,60E+01
Mean 2,20E+01 9,95E-02 7,29E+00 1,63E+01 2,41E+01
Std 4,78E+00 3,04E-01 2,22E+00 3,38E+00 5,60E+00
F7
Best 5,95E-05 2,15E-10 4,54E-04 1,98E-02 6,96E-02
Mean 1,43E-03 8,15E-10 1,39E-03 1,11E+00 6,22E+00
Std 2,11E-03 3,70E-10 1,20E-03 1,34E+00 4,92E+00
F8
Best 2,92E-04 0,00E+00 4,74E-06 1,95E-02 1,14E-01
Mean 4,88E-03 6,72E-14 4,70E-05 8,97E-02 4,71E-01
Std 7,33E-03 2,23E-13 4,19E-05 5,81E-02 2,90E-01
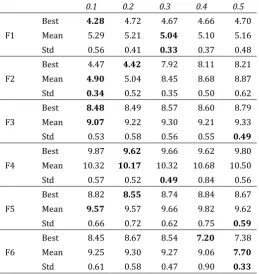
Table 6. The Comparison Results of the Different Adaptation on the Benchmark Functions
0.1 0.2 0.3 0.4 0.5
F1
Best 4.28 4.72 4.67 4.66 4.70
Mean 5.29 5.21 5.04 5.10 5.16
Std 0.56 0.41 0.33 0.37 0.48
F2
Best 4.47 4.42 7.92 8.11 8.21
Mean 4.90 5.04 8.45 8.68 8.87
Std 0.34 0.52 0.35 0.50 0.62
F3
Best 8.48 8.49 8.57 8.60 8.79
Mean 9.07 9.22 9.30 9.21 9.33
Std 0.53 0.58 0.56 0.55 0.49
F4
Best 9.87 9.62 9.66 9.62 9.80
Mean 10.32 10.17 10.32 10.68 10.50
Std 0.57 0.52 0.49 0.84 0.56
F5
Best 8.82 8.55 8.74 8.84 8.67
Mean 9.57 9.57 9.66 9.82 9.62
Std 0.66 0.72 0.62 0.75 0.59
F6
Best 8.45 8.67 8.54 7.20 7.38
Mean 9.25 9.30 9.27 9.06 7.70
F7
Best 7.22 7.26 7.29 7.33 7.34
Mean 7.57 7.69 7.63 7.65 7.75
Std 0.31 0.52 0.34 0.33 0.32
F8
Best 6.04 6.05 3.62 3.65 3.67
Mean 6.99 6.10 4.57 3.68 3.69
Std 0.67 0.05 1.22 0.02 0.02
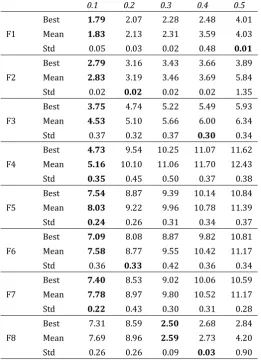
Table 7. The Running Time Comparison Results of the Different Energy Loss on the Benchmark Functions
0.1 0.2 0.3 0.4 0.5
F1
Best 1.79 2.07 2.28 2.48 4.01
Mean 1.83 2.13 2.31 3.59 4.03
Std 0.05 0.03 0.02 0.48 0.01
F2
Best 2.79 3.16 3.43 3.66 3.89
Mean 2.83 3.19 3.46 3.69 5.84
Std 0.02 0.02 0.02 0.02 1.35
F3
Best 3.75 4.74 5.22 5.49 5.93
Mean 4.53 5.10 5.66 6.00 6.34
Std 0.37 0.32 0.37 0.30 0.34
F4
Best 4.73 9.54 10.25 11.07 11.62
Mean 5.16 10.10 11.06 11.70 12.43
Std 0.35 0.45 0.50 0.37 0.38
F5
Best 7.54 8.87 9.39 10.14 10.84
Mean 8.03 9.22 9.96 10.78 11.39
Std 0.24 0.26 0.31 0.34 0.37
F6
Best 7.09 8.08 8.87 9.82 10.81
Mean 7.58 8.77 9.55 10.42 11.17
Std 0.36 0.33 0.42 0.36 0.34
F7
Best 7.40 8.53 9.02 10.06 10.59
Mean 7.78 8.97 9.80 10.52 11.17
Std 0.22 0.43 0.30 0.31 0.28
F8
Best 7.31 8.59 2.50 2.68 2.84
Mean 7.69 8.96 2.59 2.73 4.20
Std 0.26 0.26 0.09 0.03 0.90
Table 8. The Running Time Comparison Results of the Different Population on the Benchmark Functions
10 20 30 40 50
F1
Best 2.25 3.09 3.84 4.68 5.64
Mean 2.58 3.59 4.33 5.09 6.04
Std 0.24 0.33 0.29 0.35 0.27
F2
Best 2.12 2.85 3.77 8.15 9.35
Mean 2.36 3.27 4.40 8.59 10.26
Std 0.18 0.32 0.95 0.26 0.72
F3
Best 3.93 5.59 7.33 8.38 10.00
Mean 4.39 6.25 7.79 9.30 11.00
Std 0.34 0.53 0.39 0.65 0.60
F4
Best 4.48 6.09 7.88 9.63 11.56
Mean 4.95 6.87 8.70 10.26 12.45
F5
Best 3.98 5.63 7.00 9.01 10.80
Mean 4.60 6.42 8.01 9.74 11.54
Std 0.31 0.54 0.47 0.54 0.70
F6
Best 3.88 5.54 7.31 8.43 10.28
Mean 4.54 6.11 7.83 9.30 11.04
Std 0.37 0.38 0.48 0.53 0.55
F7
Best 4.03 5.40 6.11 7.42 8.70
Mean 4.48 6.16 7.45 7.69 9.05
Std 0.34 0.41 0.82 0.26 0.38
F8
Be st
3.3 5
4.7 4
6.1 1
7.3 1
8.6 8
Mean 3.57 5.02 6.40 7.74 9.09
Std 0.10 0.23 0.28 0.31 0.42
Table 9. The Running Time Comparison Results of the Different Shear Force on the Benchmark Functions
1 2 3 4 5
F1
Best 3.44 3.51 3.55 3.58 3.57
Mean 3.56 3.56 3.60 3.61 3.60
Std 0.13 0.03 0.05 0.02 0.02
F2
Best 3.51 3.42 3.41 3.41 3.42
Mean 3.60 3.46 3.46 3.47 3.45
Std 0.04 0.02 0.06 0.08 0.02
F3
Best 3.63 3.71 3.74 3.72 3.74
Mean 3.66 3.76 3.77 3.77 3.77
Std 0.02 0.03 0.02 0.02 0.02
F4
Best 4.25 4.29 4.27 4.30 4.30
Mean 4.29 4.31 4.30 4.34 4.34
Std 0.02 0.01 0.02 0.06 0.02
F5
Best 3.92 3.89 3.91 3.92 3.92
Mean 3.96 3.93 3.95 3.96 3.95
Std 0.02 0.02 0.02 0.02 0.02
F6
Best 3.77 3.72 3.77 3.78 3.80
Mean 3.82 3.76 3.82 3.82 3.84
Std 0.02 0.02 0.03 0.02 0.02
F7
Best 3.85 3.80 3.86 3.90 3.91
Mean 3.90 3.85 3.91 3.95 3.95
Std 0.02 0.02 0.02 0.02 0.02
F8
Best 3.78 3.82 3.87 3.92 3.93
Mean 3.82 3.87 3.92 3.95 3.97
Std 0.02 0.03 0.03 0.02 0.02
terms of the solution quality in the given parameter. The AAA found the best values in the best time in value 2 for the shear force parameter in the F1, F5, F6 and F7 functions. However, the running time did not become much different for the other parameter values.
4.
Conclusion
In this study, as noted above, we examined the effect of different parameter values of the Artificial Algae Algorithm in the optimization of well-known benchmark functions and compared the performance of the Artificial Algae Algorithm for the corresponding parameter. These are: effect of the population, shear force, energy loss and adaptation. When tuning the parameter, while the corresponding parameter whose performance was changed, the other parameters were fixed. Eight benchmark functions were used to compare the parameters of the method as a problem. The results of AAA applied to the functions are given in Tables 2, 3, 4 and 5 respectively.
The problem size is constant and is determined as 30. In this way, we tried to find the optimal parameters for the AAA. It is seen that the obtained results generally approached the optimum results when one considers the best values, mean values and standard deviation in the tables.
When the adaptation parameter (Table 2) was 0.5, it gave better results, but when the parameter value was 0.3, it gave the worst value. The energy loss parameter (Table 3) gave very good results when this parameter was equal to value 0.1, but when the method took the value of 0.5 for this parameter, the AAA produced the worst value. The population parameter (Table 4.) gave better results when the algorithm had the value 20 for the corresponding parameter, but when the parameter value was 10, it took the worst value. The shear force parameter (Table 5.) gave very good results when the parameter value was selected as 2, but in the other parameter values, it obtained the worst value. As a result, in the light of the obtained results, it can be said that the optimal parameter values are 0.5, 0.1, 20, 2 for adaptation, energy loss, parameter and shear force, respectively.
In this paper, the running time comparison results of the different parameters on the benchmark functions are given in Tables 6, 7, 8 and 9. When Table 6 was examined, when the adaptation parameter was taken as 0.1, the algorithm found the solution in the shortest time, but when its parameter was equal to 0.4, this method obtained the result in the longest time. As seen from Table 7, for the energy loss parameter, when the value was under 0.1, the algorithm achieved the result by spending the minimum running time, while the algorithm spent the maximum time under value 0.4. As seen from Table 8, when the size of the population was equal to 10, the algorithm obtained the result in the minimum time. As seen from Table 9, when the shear force parameter value was chosen as 2 in the values from 1 to 5, the method found the solution in the shortest running time.
When we use fixed parameter values instead of random values, the AAA gives better results, as can be understood from the results of this study.
References
[1] Akay, B. (2009). Nümerik optimizasyon problemlerinde yapay arı kolonisi (artificial bee colony) algoritmasının performans analizi. Doktora Tezi (Ph.D.), Erciyes Üniversitesi Fen Bilimleri Enstitüsü, Kayseri.
[2] Beskirli, M., & Koc, I. (2015). A comparative study of improved bat algorithm and bat algorithm on numerical benchmarks. Proceedings of the 4th International Conference on Advanced Computer Science Applications and Technologies (ACSAT).
[4] Golberg, D. E. (1989). Genetic algorithms in search, optimization, and machine learning. Addion Wesley, 102.
[5] Storn, R., & Price, K. (1997). Differential evolution–a simple and efficient heuristic for global optimization over continuous spaces. Journal of Global Optimization, 11(4), 341-359.
[6] Uymaz, S. A. (2015). Yeni bir biyolojik ilhamli metasezgisel optimizasyon metodu: Yapay alg algoritmasi. A Novel Bio-Inspired Metaheuristic Optimization Method: Artificial Algae Algorithm.
[7] Rashedi, E., Nezamabadi-Pour, H., & Saryazdi, S. (2009). GSA: A gravitational search algorithm. Information Sciences, 179(13), 2232-2248.
[8] Kennedy, J., & Eberhart, R. (1995). Particle swarm optimization. Proceedings of IEEE International Conference on Neural Networks.
[9] Dorigo, M., Birattari, M., & Stutzle, T. (2006). Ant colony optimization. IEEE Computational Intelligence Magazine, 1(4), 28-39.
[10]Yang, X. S., & Hossein, G. A. (2012). Bat algorithm: A novel approach for global engineering optimization. Engineering Computations, 29(5), 464-483.
[11]Glover, F., & Laguna, M. (2013). Tabu Search∗: Springer.
[12]Yang, X.-S. (2009). Harmony Search as a Metaheuristic Algorithm Music-Inspired Harmony Search Algorithm. Springer.
[13]Alatas, B. (2011). ACROA: Artificial chemical reaction optimization algorithm for global optimization. Expert Systems with Applications, 38(10), 13170-13180.
[14]Yang, X. S. (2010). A New Metaheuristic Bat-Inspired Algorithm Nature Inspired Cooperative Strategies for Optimization. Springer.
[15]Kuan Yew, W., & Komarudin. (2008). Parameter tuning for ant colony optimization: A review. Proceedings of International Conference on Computer and Communication Engineering.
[16]Akay, B., & Karaboga, D. (2009). Parameter tuning for the artificial bee colony algorithm. Proceedings of the International Conference on Computational Collective Intelligence.
[17]Smit, S. K., & Eiben, A. E. (2009). Comparing parameter tuning methods for evolutionary algorithms. Proceedings of IEEE Congress on Evolutionary Computation.
[18]Uymaz, S. A., Tezel, G., & Yel, E. (2015). Artificial algae algorithm (AAA) for nonlinear global optimization. Applied Soft Computing, 31, 153-171.
[19]Uymaz, S. A., Tezel, G., & Yel, E. (2015). Artificial algae algorithm with multi-light source for numerical optimization and applications. Biosystems, 138, 25-38.
[20]Zhang, X., Wu, C., Li, J., Wang, X., Yang, Z., & Lee, J. M. (2016). Binary artificial algae algorithm for multidimensional knapsack problems. Applied Soft Computing, 43, 583-595.
[21]Hakli, H., & Uguz, H. (2013). Levy flight distribution for scout bee in artificial bee colony algorithm. Lecture Notes on Software Engineering, 1(3), 254.
[22]Yılmaz, S. (2014). Yarasa algoritmasının unimodal, multimodal ve kaydırılmış sayısal optimizasyon problemleri (cec05) üzerinde geliştirilmesi/Modification of Bat Algorithm on Unimodal, Multimodal and Shifted Numeric Optimization Problems (also known as CEC05).
Ismail Koc obtained his B. Tech. and M. Tech. degree of computer engineering from Selcuk University in 2010 and 2016. Presently he is pursuing doctoral degree and he is working as research assistant in Computer Engineering, Faculty of Engineering at the same university. His areas of interests are classification methods, artificial intelligence, machine learning and optimization techniques.
![Fig. 1. Flowchart of AAA [6].](https://thumb-us.123doks.com/thumbv2/123dok_us/7809095.1662311/3.595.131.468.160.537/fig-flowchart-of-aaa.webp)
![Table 1. Benchmark Functions (C: Characteristic, U: Unimodal, M: Multimodal) [2], [21], [22]](https://thumb-us.123doks.com/thumbv2/123dok_us/7809095.1662311/4.595.124.473.525.768/table-benchmark-functions-c-characteristic-u-unimodal-multimodal.webp)