e-ISSN: 2278-067X, p-ISSN: 2278-800X, www.ijerd.com
Volume 8, Issue 8 (September 2013), PP. 33-40
Estimation of Plastic Stress Concentration Factor around
Elliptical Cut Outs
M Mohan kumar
1, Arjun H Rao
2, Jaikrishnan V
2, Arun S N
2, Mathew Chandy
21CSIR-National Aerospace Laboratories, Karnataka, India. 2
Department of Mechanical Engineering, R V College of Engineering, Karnataka, India
Abstract:- Design of structures needs to cater to key requirements of safety and weight. To achieve these requirements, smooth flow of stresses and optimum factor of safety at all points in the structure are necessary. However, presence of cut outs becomes a necessary feature in the structures which obstruct the flow of stresses and there will be local concentration of stresses near the cut outs which needs to be estimated so that a safe and weight efficient design may be worked out. In this work, stress concentration factors (both elastic and plastic) near the elliptical cut outs of various standard geometries and for different material are computed using FEA and a comparison is made with analytical and semi-empirical methods available which demonstrates the behaviour of the structures with cut outs in the plastic regime. The ratio of nominal stress at failure to the ultimate strength of the material is calculated for the different plastic stress concentration factors for all the elliptical cut out configurations and a comparison is made between the theoretical and FEM results.
Keywords:- Elliptical cut out, plastic stress concentration factor.
I.
INTRODUCTION
Allowable stress design is a design format extensively used in structural design. In allowable stress (or working stress) design, member stresses computed under service (or working) loads are compared to some pre-designated stresses called allowable stresses. The allowable stresses are often expressed as a function of the yield stress or tensile stress of the material divided by a factor of safety. The factor of safety is introduced to account for the effects of overload, under strength, and approximations used in structural analysis.
Another design format known as plastic design makes use of the fact that materials have reserved strength beyond the first yield condition. When a section is under flexure, yielding of the cross-section occurs in a progressive manner, commencing with the fibres farthest away from the neutral axis and ending with the fibres nearest the neutral axis. This phenomenon of progressive yielding referred to as plastification, means that the cross-section does not fail at first yield. The additional moment that a cross-section can carry in excess of the moment that corresponds to first yield varies depending on the shape of the cross-section. After complete yielding of a cross-section, force (or, more precisely, moment) redistribution will occur in which the un-yielded portion of the structure continues to carry some additional loadings. Failure will occur only when enough cross-sections have yielded rendering the structure unstable, resulting in the formation of a plastic collapse mechanism. In plastic design, the factor of safety is applied to the applied loads to obtain factored loads. A design is said to have satisfied the strength criterion if the load effects (i.e. forces, shears, and moments) computed using these factored loads do not exceed the nominal plastic strength of the structural component.
There are few studies on the stress concentration factors for various geometry of notches in a variety of materials [1]. The experimental methods of determining the elastic and plastic stress concentration factors with appropriate illustrations [2] and methodology for SARAS aircraft structures [4] are studied. The concept of elasticity and the effects of loading based on the orientation of an ellipse were showed [5]. The strain hardening and plasticity with important illustrations were also studied [6]. The non linear analysis of structures and critical information regarding the flow rule is studied [9].
In this project an in-depth analysis was done on the behaviour of elliptical cut outs (also known as stress raisers) in the elastic and the plastic region. The effect of stress concentration occurs around the vicinity of the cut outs. Cut outs maybe circular or elliptical in nature. The effect of stress raisers can be explained by the elliptical cut outs in the wing of an aircraft. During the course of the flight the wing is subjected to an upward thrust. This essentially leads to tensile stresses in the wings at the region around the cut outs where there is a localization of stresses, which are greater than the gross stresses. The localized stress in certain situations may lead to exceed the yield value, thus causing the material to enter the plastic zone. In this region behaviour becomes nonlinear and estimation of stress concentration factor becomes a challenging task.
methods or by FEM. However, the analytical methods do not pin point the exact points of failure, finite element methods can be used to overcome these difficulties.
II.
METHODOLOGY
Stress concentration refers to the amplification in the value of stress due to the presence of cracks, discontinuities or cut outs in a section of a material. The stress concentration factor is a simple measure of the degree to which an external stress is amplified with the presence of discontinuity.
Mathematically, the stress concentration factor is defined as the ratio of the maximum stress (σmax)
developed in the material to a reference stress (σnom) of the gross cross-section.
σmax = Kt × σnom
Kt = Theoretical Stress Concentration Factor σmax=Maximum stress at the discontinuity
σnom= Nominal stress of the member
Fig.1: Illustration of Stress concentration
From the Fig. 1 it can be seen that the stress is maximum at the cut out boundary and decreases to the nominal applied stress value with increasing distance away from the hole. When the maximum stress developed is less than the yield stress of the material, the stress concentration is termed as elastic and denoted by Kt. If
however, the maximum stress exceeds the yield stress of the material, the material enters into the plastic region and the stress concentration is termed as plastic and is denoted by KP. The elastic stress concentration factor is a
function of the geometry of the cut out whereas the plastic stress concentration factor also depends on the stress -strain response of the material and varies with the applied load.
Fig.2: Effect of stress raisers
With reference to Fig. 2, the maximum stress at the notch tip, σmax may be approximated by:
σmax = 2σnom
𝛼 𝜌𝑡
Where, σnom is the applied stress, ρt is the radius of curvature of the notch tip and a represents the length
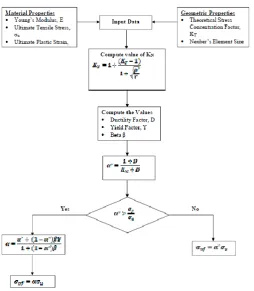
Fig.3: Flowchart to estimate the plastic stress concentration
Fig.4: Geometric configuration of the plate
Fig. 4 shows the details of the problem considered for analysis. A large plate (L/E >> 1, W/E >> 1) where, L and W are plate dimensions and E (a/b) is characteristic dimension of the cut out of thickness t (t <<W or L) in plane stress and subjected to uniaxial tension is considered. The plate under consideration has a length of L= 600mm and width W= 300mm with thickness t=2mm. The plate is subjected to a far field stress (nominal stress) of 25 kg/mm2 (MPa). By changing the aspect ratio of the elliptical hole, different stress concentration factors are obtained. Aspect ratio considered for analysis are a/b = 0.25, 0.5, 0.75, 1, 1.25, 1.5, 2. (a/b=1 gives the special case of a plate with circular hole).
A. Finite Element Model
Fig.5: Finite element mesh of elliptical cut out (a=10, b=40)
B. Material properties
While the elastic stress concentration factor depends on the geometry of the hole and applied stress state, plastic stress concentration factor additionally depends on the material properties. To study the effect of the stress concentration factor three commonly used aerospace materials are considered. The properties of these materials are shown in Table 6.1.
Table I: Properties of various alloys of Aluminium Property Al 2024 T-3 Al 2024 T-351 Al 2024 T-851 σy(Kg/mm2
) 34.437 37.248 42.168 σu(Kg/mm2)
44.98 39.357 46.380
E (Kg/mm2) 5739.5 6897.78 6914 εp(mm/mm) 0.176 0.009 0.01
III.
RESULTS
AND
DISCUSSION
A large plate with an elliptical cut out subjected to a uniaxial tensile force is considered. Elastic and plastic stress concentration factors are obtained from analytical methods and finite element calculations are also determined. Aspect ratio of the hole is taken as the parameter in the study to get varying stress concentration factors. Results for different material properties are tabulated. The results from analytical and finite element calculations are compared and discussed.
Elastic stress concentration factor are calculated from analytical methods and are presented in Table 6.2 along with corresponding FEA results. As the aspect ratio of the elliptical cut out (a/b) changes from 0.25 to 2. The elastic stress concentration factor varies linearly.
Table 6.3 shows analytical results taking plasticity effects into account. Hence, σnf for various hole shapes and material properties are tabulated. In these calculations a mean value of Neuber element size (ρ’) equals 0.3 mm is taken for calculating stress concentration factor. The FEA results are presented in the Table 6.3.
The variation of σnf/σu with respect to stress concentration factor is shown in Fig 6.17. In this Fig the
Table II: Comparison between Analytical and FEM values for various configurations of elliptical cutout in the elastic region.
a b a/b Kt Kt (FEM)
10 40 0.25 1.50 1.52
10 20 0.50 2.00 2.00
10 13.3 0.75 2.50 2.48
10 10 1.00 3.00 2.98
10 8 1.25 3.50 3.44
10 6.6 1.52 4.03 4.02
10 5.7 1.75 4.51 4.51
10 5 2.00 5.00 5.00
A detailed elasto-plastic finite element analysis is carried out for 8 elliptical cut out configurations and 3 material properties in total 24 finite element runs are carried out. The elastic material data are given in the form of MAT1 coordinates. The material non linearity option is invoked using NLPARAM entry and SOL 106 is used for the analysis.
The far field stress is applied in small increments and at each step the local stress near the elliptical hole boundary is monitored. When the highest local stress equals the ultimate strength σut of the material, the
corresponding far field stress is taken as the nominal stress to failure σnf.
Fig.7: Plastic FEA result of elliptical cut out for a=10, b=5 (Al 2024 T-3)
Fig.9: Plastic FEA result of elliptical cut out for a=10, b=5 (Al 2024 T-851)
The results of elasto-plastic finite element analysis are presented in Table 6.3 along with the analytical results for the three materials and eight stress concentration factors.
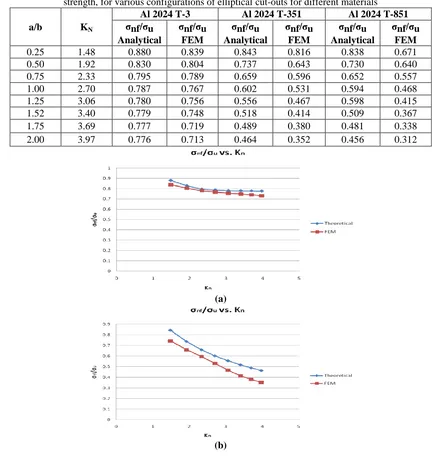
Table III: Comparison between FEM and analytical values of ratio between nominal stress at failure to ultimate strength, for various configurations of elliptical cut-outs for different materials
a/b KN
Al 2024 T-3 Al 2024 T-351 Al 2024 T-851 σnf/σu
Analytical
σnf/σu FEM
σnf/σu Analytical
σnf/σu FEM
σnf/σu Analytical
σnf/σu FEM 0.25 1.48 0.880 0.839 0.843 0.816 0.838 0.671 0.50 1.92 0.830 0.804 0.737 0.643 0.730 0.640 0.75 2.33 0.795 0.789 0.659 0.596 0.652 0.557 1.00 2.70 0.787 0.767 0.602 0.531 0.594 0.468 1.25 3.06 0.780 0.756 0.556 0.467 0.598 0.415 1.52 3.40 0.779 0.748 0.518 0.414 0.509 0.367 1.75 3.69 0.777 0.719 0.489 0.380 0.481 0.338 2.00 3.97 0.776 0.713 0.464 0.352 0.456 0.312
(c)
Fig.10: Comparison between the theoretical & FEM values of the nominal stress at failure (σnf)/Ultimate stress
(σu) VS. KN; (a) Al-2024 T-3, (b) Al-2024 T-351, (c) Al-2024 T-851.
IV.
CONCLUSIONS
The objective of this work is to establish the plastic stress concentration factors and nominal stress to failure for plates subjected to uniaxial tension and having different cut outs. For this purpose, elastic and elastic plastic analysis and FE calculations for a plate in plane stress and subjected to uniaxial tension are carried out. For analytical calculation Hadrath and Ohman with Figgie’s maximum tensile stress failure criteria is used.
MSC NASTRAN is used for FEM analysis and the results are presented for three aluminium alloys that are commonly used in aerospace industry. In all these calculations a linear strain hardening behavior is assumed. It is seen that elastic stress concentration factor computed from FE analysis agrees very well with analytical results. A study of plastic stress concentration factors indicates that the stress concentration factor has a major role in deciding the nominal stress to failure. As stress concentration factors increases the nominal stress at failure reduces for all the materials considered. This is due to the fact that with a higher stress concentration factors, the local stress reaches the ultimate tensile stress value at a lower far field stress. For values of stress concentration factor, the yield ratio will influence nominal stress at failure. A higher yield ratio results in a better nominal stress at failure. This is because, for lower values of stress concentration factor, the far field stresses also become plastic before the failure occurs. For high stress concentration factor the ductility factor also contributes in deciding the nominal stress at failure.
The elastic-plastic finite element analysis also shows a similar trend as in analytical method. However, the results from FE analysis predict slightly lower values of nominal stress at failure compared to analytical method. The difference becomes more pronounced for higher values of stress concentration factor and when the far field stress is elastic.
ACKNOWLEDGMENT
The authors would like to express the voice of gratitude and respect to all who had directly or indirectly supported for carrying out this study.The authors would like to thank and acknowledge Mr. Shyam Chetty, Director, and Dr. Satish Chandra, Head, STTD, CSIR-National Aerospace Laboratories, Bangalore, India for their support and encouragement during this work. Also sincere thanks are acknowledged to The Principal, R.V College of Engineering, Bangalore for the support. Special thanks are acknowledged to The Head of the Department, Department of Mechanical Engineering, R.V College of Engineering, for his overwhelming support & encouragement.
REFERENCES
[1]. Neuber H and J.W. Edwards, “Theory of notch stress: Principles for exact stress calculation”, 1946. [2]. Herbert Hadrath and Ohman, “A study of elastic and plastic stress concentration factors due to notches
and fillets in flat plates”.
[3]. Kuhn and Herbert Hadrath, “An engineering method for estimating notch size effect in fatigue tests on steel”.
[4]. Dr K.N. Raju, “Methodology to check structural integrity at design ultimate load in SARAS”, 2000. [5]. Timoshenko, S.P., and Goodier, J. N, Theory of Elasticity, Third edition , Mcgraw Hill Book
Company , 1970.
[6]. Boresi A.P., Schmidt R.J., Sidebottom, O.M. Advanced mechanics of materials, Fifth edition, Wiley, 1993.
[7]. Paul H.Black, O. Eugene Adams, Jr. Machine Design, 3 edition, McGraw-Hill Companies, 1968. [8]. J.R. Barber, Intermediate Mechanics Of Materials, Illustrated edition, Mcgraw Hill Science and
[9]. Muthukrishnan Sathyamoorthy, Non Linear Analysis Of Structures First edition , Taylor & Francis Publication, 1997.
[10]. Ferdinand P Beer, E Russell, Johnston,Jr, ,John T DeWolf, Mechanics Of Materials, 5th Edition, Mcgraw Hill Science and Engineering.
[11]. T.G.Sitharam, L GovindaRaju, Applied Elasticity, Interline Publishing, 2005-2006.
[12]. Advanced Mechanics Of Solids-L.S. Srinath. W F Chen and D.J. Han, Plasticity for Structural Engineers, J. Ross Publishing, 2007.
[13]. D. W. A. Rees, Basic Engineering Plasticity: An Introduction with Engineering and Manufacturing Applications, First edition 2006, Elsevier Limited.
[14]. W Johnson, P B Mellor Engineering Plasticity, Prentice Hall Publications 1983.